

Abstract
NSD1 is a SET‐domain histone methyltransferase that methylates lysine 36 of histone 3. In the crystal structure of NSD1, the post‐SET loop is in an autoinhibitory position that blocks binding of the histone peptide as well as the entrance to the lysine‐binding channel. The conformational dynamics preceding histone binding and the mechanism by which the post‐SET loop moves to accommodate the target lysine is currently unknown, although potential models have been proposed. Using molecular dynamics simulations, we have identified potential conformations of the post‐SET loop differing from those of previous studies, as well as proposed a model of peptide‐bound NSD1. Our simulations illustrate the dynamic behavior of the post‐SET loop and the presence of a few distinct conformations. In every case, the post‐SET loop remains in an autoinhibitory position blocking the peptide‐binding cleft, suggesting that another interaction is required to optimally position NSD1 in an active conformation. This finding provides initial evidence for a mechanism by which NSD1 preferentially binds nucleosomal substrates.
Keywords: histone methyltransferase, NSD family, cancer, structure‐based drug design, molecular dynamics
Abbreviations
- AdoMet
s‐adenosylmethionine
- ASH1L
Absent small and homeotic disks protein 1 homolog
- DIM‐5
Histone H3‐K9 methyltransferase dim‐5
- G9a
Euchromatic histone‐lysine N‐methyltransferase 2
- GLP
G9a‐like protein
- MLL
mixed‐lineage leukemia protein
- NSD1
nuclear receptor‐binding SET domain‐containing protein 1
- SETD2
SET domain‐containing protein 2
Introduction
Histone methylation is an important genetic regulatory element, among other post‐translational modifications. Methylation occurs at a number of different sites, including arginine, lysine, and histidine residues, and is catalyzed by the methyltransferase group of enzymes.1 The histone lysine methyltransferase enzymes are responsible for catalyzing the transfer of a methyl group from s‐adenosylmethionine (AdoMet) to the target lysine. Depending on the target residue and specific enzyme, the lysine may be mono‐, di‐, or tri‐methylated. These enzymes feature a conserved SET domain composed of ∼130 residues, and they often have similar pre‐ and post‐SET motifs.2
The NSD family of histone methyltransferases are responsible for mono‐ and dimethylation of lysine 36 on histone 3 (H3K36), and other targets have also been reported.3 The NSD family of proteins have been implicated in several types of cancer, including acute myeloid leukemia, breast cancer, glioma, neuroblastoma, and multiple myeloma.4, 5, 6, 7 In the case of acute myeloid leukemia, methylation of H3K36 by NSD1 was shown to be essential to gene activation and leukemogenesis through the presence of NUP98‐NSD1 fusion proteins which alter transcriptional regulation.4 Histone methyltransferases are therefore a promising drug target for the treatment of these diseases, although development efforts are hampered by the difficulty in achieving specificity among a protein family characterized by their conserved catalytic domain.
One way to achieve ligand selectivity is to capitalize on differences in flexibility between potential binding targets.8 The post‐SET loop of SET‐domain histone methyltransferases exhibits great conformational diversity. For example, NSD1, ASH1L, and SETD2 have all been crystallized with the post‐SET loop in an autoinhibitory position (the protein's conformation is such that the entrance to the active site is physically blocked), the structures of DIM‐5, NSD3 (PDB: 4YZ8, unpublished data), and MLL show a disordered loop, while the structure of G9a has the loop in an alpha‐helical conformation.9, 10, 11, 12, 13, 14 Recent structural studies of the catalytic domain of NSD1 and the homologous protein ASH1L indicate two potential autoinhibitory mechanisms observed in the post‐SET loop, as shown in Figure 1.10, 11 A similar autoinhibitory loop position is also observed in the structure of SETD2.12 In either case, a conformational change must occur in this loop region in order for the lysine to enter the substrate‐binding channel. Previous studies have primarily focused on the structure of NSD1 after manual insertion of a peptide rather than free‐dynamics of the loop. The dynamics of the post‐SET loop are significant, as the loop must move prior to peptide binding or its movement must be induced upon interaction with the substrate. In addition, mutagenesis studies on the corresponding region of ASH1L have suggested that this loop region is not merely a blockade to peptide binding, but rather plays a more complex role in enzymatic activity.15 As ligands targeting this region of NSD1 would have to bind prior to the peptide binding in order to be effective, it is necessary to understand the dynamics of this loop region.
Figure 1.
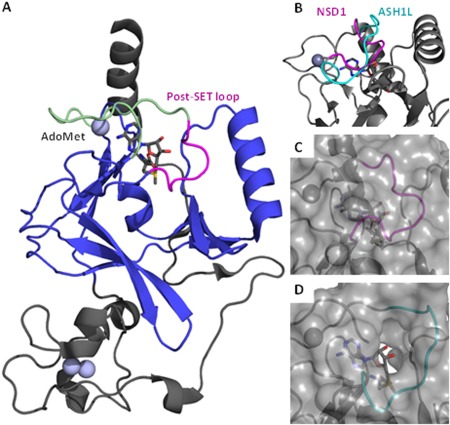
Crystal structures of NSD1 and ASH1L. A: The structure of the catalytic domain of NSD1 is shown (PDB: 3OOI). The SET domain is shown in blue, the post‐SET loop is shown in magenta, and the post‐SET domain is shown in green. The Zinc ions are shown as gray spheres. B: The post‐SET loop region of ASH1L is shown in cyan in comparison with the post‐SET loop region of NSD1 in magenta. For clarity, only the loop region of ASH1L is shown. C: Surface representation of the post‐SET loop of NSD1 which shows the lysine‐binding channel to AdoMet obstructed by the post‐SET loop. D: Surface representation of the post‐SET loop of ASH1L, showing a cavity not found in the crystal structure of NSD1.
Few studies thus far have analyzed the dynamic behavior of NSD1, so it is unclear what conformations exist prior to histone binding. Qiao and coworkers performed a 2 ns MD (Molecular Dynamics) simulation in order to examine the conformational variability of the post‐SET loop region.10 Although they were able to see “modest conformational changes,” the length of their simulation was relatively short and so they may not have captured other potential conformations. In addition, they used docking and energy minimization of the nucleosome against NSD1 to position H3K36 into the substrate binding channel. In their procedure, the majority of the nucleosome was held rigid while the histone tail was allowed to move. In the resulting model, the nucleosomal DNA contacts the post‐SET loop, which may play a role in stabilizing the active conformation.10 Work by the di Luccio group also utilized MD simulations to analyze a peptide‐bound model of the post‐SET loop.16, 17 However, their computational work has serious technical flaws; namely the use of a 1‐ps time step. Typical time steps for molecular dynamics simulations are on the order of 1‐2 fs. The 1‐ps time step is orders of magnitude too large, which leads to instabilities in the forces and poor sampling in the calculated motion of the protein.18 Additionally, they minimized their structures after simulation, so it is unclear what conformations were observed during the simulations themselves.
While the previous studies give some insight into the conformational diversity observed in the post‐SET loop, they have not sufficiently examined the potential conformations of NSD1 without the peptide bound which may be an important state for developing inhibitors of methyl transfer nor in the presence of the H3 peptide to better understand the substrate‐bound state of NSD1. In order to determine which conformations this loop may adopt, we have performed MD simulations of NSD1 with the post‐SET loop as observed in the crystal structure as well as simulations with the loop modeled to match that seen in homologous structures.
Results
In the present study, we utilized Molecular Dynamics simulations to examine three possible starting conformations of the NSD1 post‐SET loop: (1) a peptide‐bound model, (2) the position observed in the crystal structure (“closed‐inactive”), and (3) the position observed in the homologous protein ASH1L (“open‐inactive”). In the closed‐inactive structure, the post‐SET loop folds more compactly towards the AdoMet cofactor in contrast to the more‐relaxed position observed in the open‐inactive simulations.
Peptide‐bound simulations
Over the course of our simulations, the post‐SET loop relaxed into a stable conformation with minimal changes to the rest of the protein. RMSD measurements confirm this observation; the initial homology model deviated from the sampled trajectories with a minimal RMSD for the post‐set loop region of approximately 3 Å. In comparison to the minimized and equilibrated homology model, RMSD values over the course of the simulation oscillated around 2 Å for both the post‐SET loop and the entire protein. Each of the simulations of peptide‐bound NSD1 exhibited similar behavior. In every case, the post‐SET loop maintained a helical conformation for residues 208‐215 (PDB: 3OOI numbering), as shown in Figure 2. This conformation allows the lysine of the peptide to remain adjacent to AdoMet in preparation for methyl transfer. Based on our simulations, this structure represents a potential model of NSD1 bound to the H3 peptide.
Figure 2.
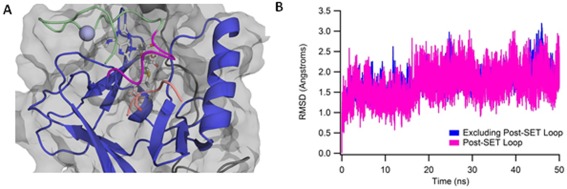
Model of Peptide‐bound NSD1. A: Representative structure of peptide‐bound NSD1. The H3 peptide is shown in salmon. This structure was chosen from a clustering of the final 10 ns of all peptide‐bound runs, and is the representative structure from the highest occupancy cluster. B: Representative backbone RMSD plot calculated relative to the equilibrated peptide‐bound model. As shown in magenta, the loop relaxed into a stable conformation with a relatively small RMSD to the starting structure, and remained stable, with minor oscillations of ±0.5 Å around the average position.
Closed‐inactive simulations
In contrast with the peptide‐bound simulations, the post‐SET loop region exhibited greater conformational variability during our simulations of NSD1‐AdoMet. In the simulations starting from the closed‐inactive structure, two of the runs adopted a conformation resembling the open‐inactive structure, five of the runs sampled about the closed‐inactive conformation, and three runs transitioned into a third autoinhibitory conformation.
The transition from the closed‐inactive to the open‐inactive structure was characterized by an outward movement of Asn214 (PDB: 3OOI numbering) and the simultaneous rotation of the adjacent post‐SET loop region. The degree of conformational variation was assessed using the dihedral and distance metrics described in the methods section. The transition from closed‐inactive to open‐inactive can be seen in the first and second closed simulations, as shown in Figure 3(A,B) respectively, in which both the dihedral metric and distance metric increase. This corresponds to a movement of the post‐SET loop away from the AdoMet cofactor and towards the nearby α‐helix. This conformational change is confined to the region directly surrounding Asn214, with very little conformational change in the rest of the post‐SET loop region. This outward movement of the Asn214 residue is not observed in the remainder of the closed‐inactive simulations.
Figure 3.
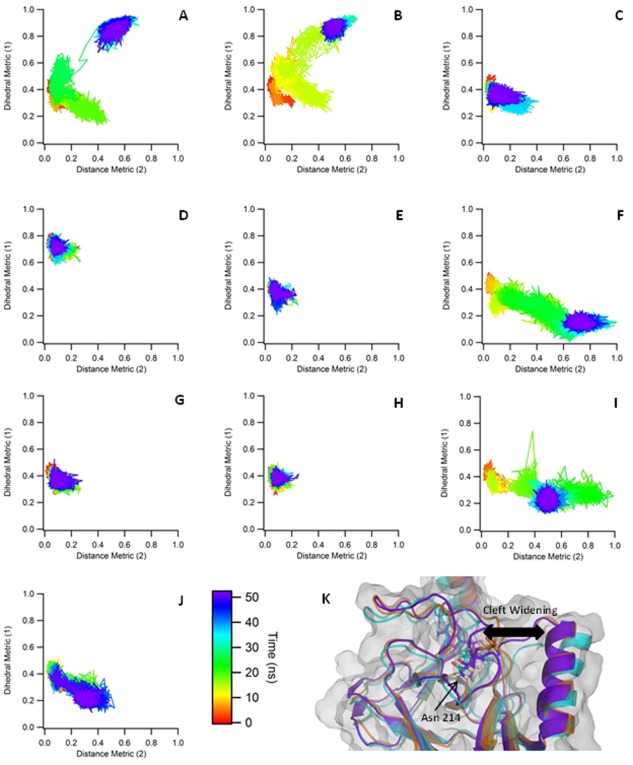
Closed‐Inactive Metrics. A−J: The metrics describing the movement of the post‐SET loop in the closed‐inactive simulations are shown. The average dihedrals are shown on the Y axis while the distance is shown in the X axis. All values shown are normalized for easier comparison. In five of the simulations, the post‐SET loop samples around the starting position. In the remaining simulations, we observed a transition to two other distinct conformations. K: Initial, intermediate, and final conformations from trajectory “F” are shown, colored orange, cyan, and purple, respectively.
In three of the simulations [Fig. 3(F,I,J)], we see a third conformational state, characterized by an increase in the distance metric without a corresponding increase in the dihedral metric. In these cases, Asn214 rotates in the opposite direction, away from both AdoMet and the alpha helix. In one case, this results in an enlargement of the upper portion of the peptide‐binding cleft, although the lysine binding channel is still blocked. Interestingly, the cleft makes a flexing motion over time, initially forming a wider intermediate state, which then narrows somewhat at the end of the simulation. This is depicted in Figure 3(K). This simulation was run for an additional 80 ns (for a total of 130ns) to determine if the loop would further transition into a conformation with the lysine binding channel exposed, however, the loop remained in the observed autoinhibitory position.
In the remainder of the simulations, shown in Figure 3(C–E,G,H), the loop remains in the closed‐inactive position. In these cases, the post‐SET loop primarily samples around the starting position and does not rotate outward.
Open‐inactive simulations
There is much less conformational variation observed in the simulations that were initialized with the post‐SET loop positioned like that of ASH1L. Using the same metric as the closed‐inactive simulations, as shown in Figure 4, the loop maintains the initial structure while sampling around this position. The backbone RMSD fluctuates around 2 Å, while the backbone RMSD of the post‐SET loop region relative to the homology model is approximately 2.5 − 3 Å over the course of the simulations. The open‐inactive simulations were initiated with Asn214 pointing outwards towards the α‐helix and away from AdoMet. In contrast to the closed simulations, Asn214 never rotates back towards AdoMet and always maintains this outward‐facing position.
Figure 4.
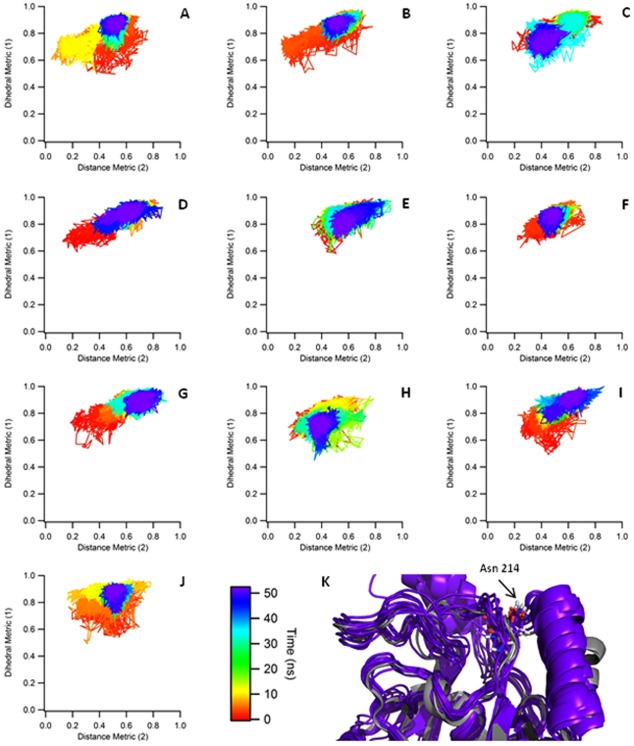
Open‐Inactive Metrics. A−J: The metrics describing the movement of the post‐SET loop in the open‐inactive simulations are shown. The average dihedrals are shown on the Y axis while the distance is shown in the X axis. All values shown are normalized for easier comparison. In all cases, the post‐SET loop primarily samples about the starting conformation. K: Comparison between final structures from the “open‐inactive” simulations (purple) and crystal structures of the homologous protein ASH1L (gray, PDB: 3OPE, 4YNM).
Discussion
In our simulations of NSD1, we witnessed several conformational changes. In the case of the NSD1‐AdoMet simulations, we observe three conformations in total. The first is that found in the NSD1 crystal structure, PDB: 3OOI, which has the post‐SET loop in an autoinhibitory position (“closed‐inactive”). Second, we observed another autoinhibitory position resembling that of ASH1L, PDB: 3OPE (“open‐inactive”). This conformation was observed in both the simulations beginning from the closed‐inactive structure and in those starting from the open‐inactive homology model. While we do not know how frequently this open conformation occurs in solution relative to the closed position, it was observed to be stable over the entire length of our simulations. Recent structural studies of the corresponding autoinhibitory loop of ASH1L showed similar conformational sampling within the loop region.15 Interestingly, we observed a third conformation in which the post‐SET loop moves upward, widening the peptide binding cleft. In previous studies by Qiao and coworkers, their docking simulations positioned the nucleosomal DNA against the portion of the loop blocking the lysine binding channel.10 It is possible that the motion observed in our simulations is a precursor to histone binding, with the remainder of the post‐SET loop moving upon contact with the nucleosomal DNA. While a shortened construct of NSD1 has been shown to methylate the H3K36 peptide in vitro, NSD1's preferred substrate is nucleosomal H3K36.3, 19 We speculate that the necessary conformational change in the post‐SET loop that opens the lysine binding channel and peptide binding cleft occurs spontaneously on occasion, thereby allowing for the methylation of peptide substrates, but is typically induced by the presence of the nucleosome via an induced‐fit mechanism, thus explaining the preference for nucleosomal H3K36. Our study is limited by the fact that full‐length crystal structures of NSD1 are unavailable, and so it is possible that there is another determinant of NSD1's specificity in vivo. Nevertheless, our simulations yield insight on the dynamics of the post‐SET loop region.
The observed conformations may also be useful in the design of NSD1‐specific small molecules. Currently known inhibitors of SET‐domain histone methyltransferases function as either competitive inhibitors of the substrate peptides or inhibitors of the cofactor AdoMet. For example, compounds such as BIX01294, E72, and UNC0321 have been found to block binding of the target peptide of H3 to the histone methyltransferase G9a, and Sinefungin derivatives have been developed that bind in place of AdoMet.12, 20, 21, 22, 23 Targeting histone methyltransferases via these mechanisms may be potentially difficult because of the need to develop specific inhibitors. Indeed, Nguyen et al. have studied the binding site similarity of SET‐domain methyltransferases and found scaffolds that may bind to subsets of these.24 They suggest that the substituents on these scaffolds may be changed to garner specificity. As an alternative to this, it may be possible to capitalize on the differing conformational changes between SET‐domain methyltransferases, including those seen in our simulations of NSD1. As mentioned previously, the structure of the post‐SET loop region varies within the histone methyltransferase family. By designing small molecules that stabilize the autoinhibitory loop rather than the cofactor or lysine binding site, researchers may be able to develop ligands with greater specificity for NSD1 over other SET‐domain methyltransferases. The results presented here provide conformations that can be used for structure‐based drug‐design efforts to inhibit methylation by NSD1.
Materials and Methods
Peptide‐bound conformation
No peptide‐bound crystal structures of NSD1 were available, so we first created the model of the histone H3 peptide (residues 33 − 37) bound to NSD1‐AdoMet based on the structurally homologous SET domain of the H3K9 methyltransferase GLP (PDB: 3SW9).25 This was done using the program MOE to manually adjust the post‐SET loop of NSD1 to mirror the positioning observed in the structure of GLP and to insert the corresponding peptide.26 Due to the large number of rotatable bonds in a peptide, modeling the peptide‐bound conformation using a homologous structure produces a more reliable model than docking the peptide into the structure. While previous studies have shown that a post‐SET extension of NSD1 is required for nucleosome binding, no crystal structures containing both the SET domain and this region exist. Although hypothetical models have been proposed, modeling this region in our simulations would introduce another level of uncertainty; therefore we have chosen to use the construct of NSD1 found in the crystal structure (PDB: 3OOI).10, 27
Inactive conformations
Second, we sought to enumerate potential conformations of the post‐SET loop that may exist prior to binding of the nucleosome. To do so, we carried out two sets of simulations based on binary NSD1‐AdoMet. The first, which we have termed the closed‐inactive position, started from the crystal structure of NSD1 (PDB: 3OOI).10 During our simulations, we observed a subset of the closed‐inactive models transitioning to a more relaxed conformation resembling the autoinhibitory loop position seen in ASH1L. In order to determine if this is a stable conformation, we also modeled the post‐SET loop to match the position seen in the crystal structure of ASH1L, termed the open‐inactive position(PDB: 3OPE).11 This was done using the secondary structure matching utility within the program Coot to align the corresponding post‐SET loop residues of NSD1 to those of ASH1L.28
Computational setup
Parameter files for the simulations were prepared using the tleap utility in AMBERTOOLS with the AMBER FF99SB force field.29 The parameters for the AdoMet cofactor were created using the antechamber utility in AMBERTOOLS with GAFF atom types and the AM1‐BCC charge model. Protonation states were assigned using PROPKA.30, 31, 32, 33 In the case of the peptide‐bound model, the target lysine was modeled as neutral in order to more closely mimic the transition state preceding methylation. This choice was based on the computational study by Zhang and Bruice which indicated the presence of a neutral lysine that is deprotonated through a water channel prior to methylation in related SET‐domain lysine methyltransferases.34 The systems were solvated with TIP3P water and sodium or chloride ions were added as necessary to achieve a net‐neutral charge.35 The systems were initially minimized for 7500 steps, followed by heating to 300 K over 80 ps with a 2‐fs time step and restraints on the protein. The systems were then equilibrated at 300 K for 1.75 ns while the restraints were gradually released. The SHAKE algorithm was used to constrain bonds with hydrogens and the temperature was controlled with the Berendsen thermostat.36 Ten separate production runs of 50 ns were completed for each of the three setups. All simulations were carried out using the sander and pmemd utilities in AMBER11.29 The trajectories were analyzed using the ptraj and cpptraj utilities.37 Visualization of trajectories was done using VMD and PyMOL.38, 39
Movement metric
In order to quantify the movements of the post‐SET loop during the simulations of the inactive conformations, we selected two metrics that captured the observed rotation and translation of the loop. This allowed us to assess the extent of conformational variation in each trajectory. The first metric calculated was the average of two dihedrals, Gly213N‐Gly213Cα‐Gly213C‐Asn214N and Gly104C‐Asn214C‐Asn214Cα‐Asn214Cγ, which measured the rotation of the post‐SET loop away from AdoMet. The second metric measured the distance between Cγ of Asn214 and the O3′ atom of AdoMet. For ease of comparison, both metrics were normalized from 0 to 1 before plotting.
Acknowledgments
The authors have no conflicting interests to declare. The authors thank Professor Tomasz Cierpicki for insightful discussions. Sarah Graham thanks the Rackham Graduate School for enabling the purchase of computing resources.
References
- 1. Greer EL, Shi Y (2012) Histone methylation: a dynamic mark in health, disease and inheritance. Nat Rev Genet 13:343–357. [DOI] [PMC free article] [PubMed] [Google Scholar]
- 2. Dillon SC, Zhang X, Trievel RC, Cheng X (2005) The SET‐domain protein superfamily: protein lysine methyltransferases. Genome Biol 6:227. [DOI] [PMC free article] [PubMed] [Google Scholar]
- 3. Li Y, Trojer P, Xu CF, Cheung P, Kuo A, Drury WJ, Qiao Q, Neubert TA, Xu RM, Gozani O, Reinberg D (2009) The target of the NSD family of histone lysine methyltransferases depends on the nature of the substrate. J Biol Chem 284:34283–34295. [DOI] [PMC free article] [PubMed] [Google Scholar]
- 4. Wang GG, Cai L, Pasillas MP, Kamps MP (2007) NUP98‐NSD1 links H3K36 methylation to Hox‐A gene activation and leukaemogenesis. Nat Cell Biol 9:804–812. [DOI] [PubMed] [Google Scholar]
- 5. Angrand PO, Apiou F, Stewart AF, Dutrillaux B, Losson R, Chambon P (2001) NSD3, a new SET domain‐containing gene, maps to 8p12 and is amplified in human breast cancer cell lines. Genomics 74:79–88. [DOI] [PubMed] [Google Scholar]
- 6. Berdasco M, Ropero S, Setien F, Fraga MF, Lapunzina P, Losson R, Alaminos M, Cheung NK, Rahman N, Esteller M (2009) Epigenetic inactivation of the Sotos overgrowth syndrome gene histone methyltransferase NSD1 in human neuroblastoma and glioma. Proc Natl Acad Sci USA 106:21830–21835. [DOI] [PMC free article] [PubMed] [Google Scholar]
- 7. Keats JJ, Maxwell CA, Taylor BJ, Hendzel MJ, Chesi M, Bergsagel PL, Larratt LM, Mant MJ, Reiman T, Belch AR, Pilarski LM (2005) Overexpression of transcripts originating from the MMSET locus characterizes all t(4;14)(p16;q32)‐positive multiple myeloma patients. Blood 105:4060–4069. [DOI] [PMC free article] [PubMed] [Google Scholar]
- 8. Huggins DJ, Sherman W, Tidor B (2012) Rational approaches to improving selectivity in drug design. J Med Chem 55:1424–1444. [DOI] [PMC free article] [PubMed] [Google Scholar]
- 9. Zhang X, Yang Z, Khan SI, Horton JR, Tamaru H, Selker EU, Cheng X (2003) Structural basis for the product specificity of histone lysine methyltransferases. Mol Cell 12:177–185. [DOI] [PMC free article] [PubMed] [Google Scholar]
- 10. Qiao Q, Li Y, Chen Z, Wang M, Reinberg D, Xu RM (2011) The structure of NSD1 reveals an autoregulatory mechanism underlying histone H3K36 methylation. J Biol Chem 286:8361–8368. [DOI] [PMC free article] [PubMed] [Google Scholar]
- 11. An S, Yeo K, Jeon Y, Song JJ (2011) Crystal structure of the human histone methyltransferase ASH1L catalytic domain and its implications for the regulatory mechanism. J Biol Chem 286:8369–8374. [DOI] [PMC free article] [PubMed] [Google Scholar]
- 12. Zheng W, Ibáñez G, Wu H, Blum G, Zeng H, Dong A, Li F, Hajian T, Allali‐Hassani A, Amaya MF, Siarheyeva A, Yu W, Brown PJ, Schapira M, Vedadi M, Min J, Luo M (2012) Sinefungin derivatives as inhibitors and structure probes of protein lysine methyltransferase SETD2. J Am Chem Soc 134:18004–18014. [DOI] [PMC free article] [PubMed] [Google Scholar]
- 13. Southall SM, Wong PS, Odho Z, Roe SM, Wilson JR (2009) Structural basis for the requirement of additional factors for MLL1 SET domain activity and recognition of epigenetic marks. Mol Cell 33:181–191. [DOI] [PubMed] [Google Scholar]
- 14. Wu H, Min J, Lunin VV, Antoshenko T, Dombrovski L, Zeng H, Allali‐Hassani A, Campagna‐Slater V, Vedadi M, Arrowsmith CH, Plotnikov AN, Schapira M (2010) Structural biology of human H3K9 methyltransferases. PloS One 5:e8570. [DOI] [PMC free article] [PubMed] [Google Scholar]
- 15. Rogawski DS, Ndoj J, Cho HJ, Maillard I, Grembecka J, Cierpicki T (2015) Two loops undergoing concerted dynamics regulate the activity of the ASH1L histone methyltransferase. Biochemistry 54:5401–5413. [DOI] [PMC free article] [PubMed] [Google Scholar]
- 16. Morishita M, di Luccio E (2011) Structural insights into the regulation and the recognition of histone marks by the SET domain of NSD1. Biochem Biophys Res Commun 412:214–219. [DOI] [PubMed] [Google Scholar]
- 17. Morishita M, Mevius D, di Luccio E (2014) In vitro histone lysine methylation by NSD1, NSD2/MMSET/WHSC1 and NSD3/WHSC1L. BMC Struct Biol 14:25. [DOI] [PMC free article] [PubMed] [Google Scholar]
- 18. Leach AR (1996) Molecular modelling: principles and applications. Harlow, England: Longman. [Google Scholar]
- 19. Rayasam GV, Wendling O, Angrand PO, Mark M, Niederreither K, Song L, Lerouge T, Hager GL, Chambon P, Losson R (2003) NSD1 is essential for early post‐implantation development and has a catalytically active SET domain. Embo J 22:3153–3163. [DOI] [PMC free article] [PubMed] [Google Scholar]
- 20. Kubicek S, O'Sullivan RJ, August EM, Hickey ER, Zhang Q, Teodoro Miguel L, Rea S, Mechtler K, Kowalski JA, Homon CA, Kelly TA, Jenuwein T (2007) Reversal of H3K9me2 by a small‐molecule inhibitor for the G9a histone methyltransferase. Mol Cell 25:473–481. [DOI] [PubMed] [Google Scholar]
- 21. Chang Y, Ganesh T, Horton JR, Spannhoff A, Liu J, Sun A, Zhang X, Bedford MT, Shinkai Y, Snyder JP, Cheng X (2010) Adding a lysine mimic in the design of potent inhibitors of histone lysine methyltransferases. J Mol Biol 400:1–7. [DOI] [PMC free article] [PubMed] [Google Scholar]
- 22. Liu F, Chen X, Allali‐Hassani A, Quinn AM, Wigle TJ, Wasney GA, Dong A, Senisterra G, Chau I, Siarheyeva A, Norris JL, Kireev DB, Jadhav A, Herold JM, Janzen WP, Arrowsmith CH, Frye SV, Brown PJ, Simeonov A, Vedadi M, Jin J (2010) Protein lysine methyltransferase G9a inhibitors: design, synthesis, and structure activity relationships of 2,4‐diamino‐7‐aminoalkoxy‐quinazolines. J Med Chem 53:5844–5857. [DOI] [PMC free article] [PubMed] [Google Scholar]
- 23. Devkota K, Lohse B, Liu Q, Wang M‐W, Stærk D, Berthelsen J, Clausen RP (2014) Analogues of the natural product sinefungin as inhibitors of EHMT1 and EHMT2. ACS Med Chem Lett 5:293–297. [DOI] [PMC free article] [PubMed] [Google Scholar]
- 24. Nguyen KT, Li F, Poda G, Smil D, Vedadi M, Schapira M (2013) Strategy to target the substrate binding site of SET domain protein methyltransferases. J Chem Inf Model 53:681–691. [DOI] [PubMed] [Google Scholar]
- 25. Chang Y, Sun L, Kokura K, Horton JR, Fukuda M, Espejo A, Izumi V, Koomen JM, Bedford MT, Zhang X, Shinkai Y, Fang J, Cheng X (2011) MPP8 mediates the interactions between DNA methyltransferase Dnmt3a and H3K9 methyltransferase GLP/G9a. Nat Commun 2:533. [DOI] [PMC free article] [PubMed] [Google Scholar]
- 26. Molecular Operating Environment (MOE) 2013.08. Montreal: Chemical Computing Group Inc; 2013. [Google Scholar]
- 27. Allali‐Hassani A, Kuznetsova E, Hajian T, Wu H, Dombrovski L, Li Y, Gräslund S, Arrowsmith CH, Schapira M, Vedadi M (2014) A basic post‐SET extension of NSDs is essential for nucleosome binding in vitro. J Biomol Screening 19:928–935. [DOI] [PubMed] [Google Scholar]
- 28. Emsley P, Lohkamp B, Scott WG, Cowtan K (2010) Features and development of Coot. Acta Cryst D66:486–501. [DOI] [PMC free article] [PubMed] [Google Scholar]
- 29. AMBER 11. San Francisco: University of California; 2010. [Google Scholar]
- 30. Wang J, Wolf RM, Caldwell JW, Kollman PA, Case DA (2004) Development and testing of a general amber force field. J Comput Chem 25:1157–1174. [DOI] [PubMed] [Google Scholar]
- 31. Jakalian A, Jack DB, Bayly CI (2002) Fast, efficient generation of high‐quality atomic charges. AM1‐BCC model: II. Parameterization and validation. J Comput Chem 23:1623–1641. [DOI] [PubMed] [Google Scholar]
- 32. Søndergaard CR, Olsson MHM, Rostkowski M, Jensen JH (2011) Improved treatment of ligands and coupling effects in empirical calculation and rationalization of pKa values. J Chem Theory Comput 7:2284–2295. [DOI] [PubMed] [Google Scholar]
- 33. Olsson MHM, Søndergaard CR, Rostkowski M, Jensen JH (2011) PROPKA3: consistent treatment of internal and surface residues in empirical pKa predictions. J Chem Theory Comput 7:525–537. [DOI] [PubMed] [Google Scholar]
- 34. Zhang X, Bruice TC (2007) Histone lysine methyltransferase SET7/9: formation of a water channel precedes each methyl transfer. Biochemistry 46:14838–14844. [DOI] [PubMed] [Google Scholar]
- 35. Jorgensen WL, Chandrasekhar J, Madura JD, Impey RW, Klein ML (1983) Comparison of simple potential functions for simulating liquid water. J Chem Phys 79:926–935. [Google Scholar]
- 36. Berendsen HJC, Postma JPM, van Gunsteren WF, DiNola A, Haak J (1984) Molecular dynamics with coupling to an external bath. J Chem Phys 81:3684–3690. [Google Scholar]
- 37. Roe DR, Cheatham TE (2013) PTRAJ and CPPTRAJ: software for processing and analysis of molecular dynamics trajectory data. J Chem Theory Comput 9:3084–3095. [DOI] [PubMed] [Google Scholar]
- 38. Humphrey W, Dalke A, Schulten K (1996) VMD: visual molecular dynamics. J Mol Graphics 14:33–38. [DOI] [PubMed] [Google Scholar]
- 39.The PyMOL Molecular Graphics System. 1.5.0.5: Schrodinger, LLC.