

Abstract
Objectives
To estimate the prevalence and distribution of passive smoking in the community population aged 15 years and older in China.
Design
A systematic review and meta-analysis of cross-sectional studies reporting the prevalence of passive smoking in China and a series of subgroup, trend and sensitivity analyses were conducted in this study.
Data source
The systematic review and meta-analysis, which included 46 studies with 381 580 non-smokers, estimated the prevalence and distribution of passive smoking in China. All studies were published between 1997 and 2015.
Results
The pooled prevalence of passive smoking was 48.7% (95% CI 44.8% to 52.5%) and was relatively stable from 1995 to 2013. The prevalence in the subgroups of gender, area, age and time varied from 35.1% (95% CI 31.8% to 38.3%) in the elderly (≥60 years) to 48.6% (95% CI 42.9% to 54.2%) in urban areas. The prevalence was lower in the elderly (≥60 years) than in those between 15 and 59 years of age (OR 1.61, 95% CI 1.44 to 1.81). The difference between females and males in urban and rural areas was not statistically significant (OR: 1.27, 95% CI 0.93 to 1.74 and OR: 1.14, 95% CI 0.82 to 1.58, respectively). In addition, a significantly increasing trend was found among males from 2002 to 2010. Heterogeneity was high in all pooled estimates (I2>98%, p<0.001).
Conclusions
The high and stable prevalence of passive smoking in China is raising increasing national concern regarding specific research and tobacco control programmes. Attention should be focused on young, middle-aged and male non-smokers regardless of region.
Keywords: passive smoking, Chinese, meta-analysis
Strengths and limitations of this study.
The study is the first meta-analysis of the prevalence and distribution of passive smoking in the community population aged 15 years and older in China.
To reduce the limitations of the meta-analysis regarding prevalence, strict inclusion and exclusion criteria were developed, and a series of subgroup, trend and sensitivity analyses were performed.
The high and stable prevalence of passive smoking in China is increasing national interest in specific research and tobacco control programmes.
The prevalence and distribution of passive smoking in the community population aged 15 years and older indicate that targeted public tobacco control policies are needed in China.
Introduction
The economic burden of tobacco use, including both active and passive smoking, is substantial and is deemed to be one of the primary contributors to the global disease burden.1–3 Relevant studies have examined the causal relationships between passive smoking and lung cancer, coronary heart disease, respiratory diseases and multiple adverse health effects, in infants and children.4 Tobacco use is also a leading risk factor for premature mortality and disability from non-communicable diseases in China.5 In China, 300 billion smokers and 740 billion non-smokers are exposed to second-hand smoke (SHS),6 and 16.5% of all deaths (1.4 million) in 2010 were attributed to SHS exposure.7 SHS exposure could result in approximately 3 million deaths per year by 2050 if effective interventions for tobacco control are not implemented.8
Previous studies have indicated that public smoking bans are effective ways to reduce exposure to SHS.9 Approximately 44 countries have implemented smoking bans. China endorsed the WHO Framework Convention on Tobacco Control and stated, in 2003, that it was “determined to give priority to the right to protect public health”.10 Many large cities have local regulations regarding tobacco control, but the effect has been less than expected.11 12 China is the largest tobacco grower and consumer in the world. Chinese national legislators have actively started the process of national bans on smoking in public and work places since 2014.5 However, because of significant interference, particularly from the tobacco industry, few effective legislative, executive, administrative or other measures designed to protect all persons from exposure to tobacco smoke have been implemented at any governmental level.10 13 The passive smoking problem in China is widespread and not taken seriously.14 15 Few studies on smoking have focused specifically on passive smoking, with the passive smoking rate generally included in surveys on active smoking or as a social demographic characteristic in health behaviour studies. The passive smoking rate in China varies greatly among studies, ranging from 28% to 86%, independent of the time period of the study.16 17 Even national-level studies conducted by different institutions in the same year reported a wide range in the passive smoking rate in China (39–72%).6 18 Accurate and scientific reports on passive smoking are needed to provide the government with information on the extent and seriousness of the epidemiology of passive smoking in China, to help evaluate the influence of passive smoking on health, and to provide data and evidence to support tobacco control policies in China.
We performed a systematic review and meta-analysis to estimate the prevalence of passive smoking in the community population aged 15 years and older in China and examined the prevalence of passive smoking by gender, area, age and survey years. The synthesis of these data would be helpful in determining susceptible populations and areas that could benefit from the establishment and implementation of targeted public policies based on the effects of previous tobacco control efforts.
Methods
We performed this analysis in accordance with the Meta-analysis of Observational Studies in Epidemiology (MOOSE)19 guidelines and the Preferred Reporting Items for Systematic reviews and Meta-Analyses (PRISMA)20 guidelines (when generating the flow diagram).
Search strategy
We searched MEDLINE, PUBMED, EMBASE, the Chinese Biological Medical Literature database (CBM), the Chinese Wanfang database, the Chinese National Knowledge Infrastructure (CNKI) and the Chongqing VIP database using the terms ‘(tobacco smoke pollution or passive smoking or second hand smoke or environmental tobacco smoke) and (cross-sectional study or descriptive research or survey or epidemiology)’ to identify studies on the prevalence of passive smoking among Chinese adults (aged ≥15 years) published from inception to January 2015. We also manually searched relevant annual investigation reports and reference lists to ensure the integrity of the electronic search results. See the online supplementary information for the search strategy.
bmjopen-2015-009847supp.pdf (336KB, pdf)
Selection criteria
Inclusion criteria
Passive smoke exposure was defined as a non-smoker being exposed to another person's tobacco smoke for at least 15 min daily for more than 1 day per week.21 Studies had to meet the following criteria for inclusion: (1) a sample of community non-smokers aged 15 years and older; (2) a cross-sectional study or surveillance of the prevalence of passive smoking in China; and (3) census or random sampling survey as the investigation type.
Exclusion criteria
We excluded studies if the definition of passive smoking was unclear, the data were incomplete and could not be obtained from the authors, or the study data had been published previously. In particular, we verified whether data used in provincial studies had already been utilised in national studies; if so, we excluded the provincial study.
Data extraction and quality assessment
Two reviewers independently extracted data and assessed the quality of each eligible study. Disagreements were discussed to reach consensus. The standardised extraction form included the following information: first author, year of publication, participant characteristics (geographical location, gender, age and sample size) and study methods (time of survey, type of survey, method of random sampling, and definition and measurement of passive smoking). Loney' et al's22 methodological scoring system with eight-item questions was used to perform quality assessments for all included studies. Each item was scored either as a ‘yes’ (score=1) or ‘no/unclear’ (score=0). The total possible score ranged from 0 to 8 and was classified as either ‘poor’ (total score=0–3), ‘moderate’ (total score=4–6) or ‘good’ (total score=7–8).23 See the online supplementary information for the methodological scoring system.
Statistical analysis
As the sample size of non-smokers was sufficient, reaching a prevalence of approximately 0.5 in all studies, we used the raw data to pool the overall prevalence estimates.24 25 In addition, the random effects model with the D-L method was used to calculate the pooled estimates and 95% CIs due to the high heterogeneity among studies (I2>75%).26–28 Publication bias was evaluated by Egger's test. If bias existed, the ‘trim and fill’ method was used to adjust for the publication bias.
In the subgroup analyses, we calculated the prevalence of passive smoking by gender (male and female), area (urban and rural) and age (15–60 and ≥60 years), and differences were determined by calculating ORs. To observe the relatively continuous and long-term trends of prevalence in passive smoking, trend analyses were performed by gender, area and age, using the studies that conducted surveys between 2002 and 2013. In addition, due to the wide range of sample sizes of the included studies, we excluded national health surveys and divided the non-national studies into two groups (sample sizes ≥1000 and <1000) for the sensitivity analyses. We performed all meta-analyses using Stata V.12.0 with the command metan. The trend figures were graphed in Excel V.2010.
Results
Our search yielded 1722 studies from the CNKI, 103 from the CBM, 133 from the Wanfang database and 45 from the VIP. We also identified 194 records in PUBMED, 63 in MEDLINE and 9 in EMBASE. Six additional records were identified through a manual search of publicly available data. After removing duplicates, 1650 studies remained. We screened the titles and abstracts of these studies, and excluded 1449 records due to inappropriate study types. The remaining 201 full-text articles were assessed for eligibility, and 46 studies with 381 580 non-smokers published between 1997 and 2015 on data obtained from 1995 to 2013 were finally included (figure 1). The quality of all eligible studies was moderate and acceptable. Online supplementary table S1 shows the methodological quality assessment results of included studies. Overall, studies with ‘good’, ‘moderate’ and ‘poor’ quality scores were 6 (13%), 39 (85%) and 1 (2%), respectively. Zero score was mainly in item 2 (unbiased sampling frame), item 6 (refusers described) and item 7 (CIs).
Figure 1.

Study selection flow diagram.
Descriptions of studies
Among the eligible studies, 176 15 17 29–42 were special investigations of passive smoking, and the remaining studies were generally part of broader investigations on smoking behaviour. In addition, six studies6 18 38 41 43 44 were conducted at the national level, and the remaining studies were conducted at the provincial level. Therefore, the sample sizes varied greatly, ranging from 13645 to 126 14244 participants. The multistage method of random sampling was primarily employed, although five studies15 46–49 used the cluster method and two16 50 used the stratified method. The area of study also varied, with 12 studies15 16 32 34 39 40 42 46 47 51–53 examining urban areas, 1117 30 33 35 37 48 49 53–56 examining rural areas, and the remainder examining both, urban and rural areas; 918 36 38 44 57–61 of these latter studies could be stratified for further subgroup analyses. Nearly all studies reported data for both genders, but female participants were more common, comprising between 61%46 and 100%32 39 40 of the study populations. Most study populations covered the full spectrum of adulthood except for two, which focused, respectively, on persons 35 years of age and older,47 and 45 years of age and older,32 and one15 only examining persons 60 years of age and older (table 1). Passive smoking was measured by self-reporting in all studies, and the estimated publication bias was not significant (Egger's test, p=0.493).
Table 1.
Characteristics and stratified data of the included studies
| Subgroup |
||||||||||||
|---|---|---|---|---|---|---|---|---|---|---|---|---|
| First author and year published | Survey year | Type (special investigation/contains relative data) | Location | Methods of random sampling | Female (%) | Age | Male | Female | 15–59 years | ≥60 years | Urban | Rural |
| Yang et al (2015)15 | 2010 | Special | Province | Cluster | 64 | 60–95 | 130/668 | 417/1203 | 547/1871 | 547/1871 | ||
| Chinese CDC (2014)43 | 2010 | Relative | National | Multistage | 66 | ≥60 | 1434/5085 | 3306/9923 | 4470/15 008 | |||
| Cai et al (2014)33 | 2010 | Special | Province | Multistage | 77 | ≥18 | 1031/2699 | 3859/8892 | 3655/8447 | 1235/3144 | 4890/11 591 | |
| Chen et al (a) (2014)32 | 2008–2010 | Special | Province | Multistage | 100 | 45–65 | 12 730/27 874 | 11 457/25 033 | 1273/2843 | 12 730/27 874 | ||
| Chen et al (b) (2014)68 | 2013 | Relative | Province | Multistage | 68 | 15–69 | 64/179 | 189/371 | ||||
| Li et al (a) (2014)31 | 2011 | Special | Province | Multistage | 71 | ≥18 | 162/227 | 345/549 | ||||
| Li et al (b) (2014)30 | 2011 | Special | Province | Multistage | 75 | ≥18 | 266/717 | 856/2124 | 758/1897 | 190/483 | 1122/2841 | |
| Qi et al (2014)29 | 2012 | Special | Province | Multistage | 77 | 15–74 | 1110/3055 | 4297/10 177 | 4692/11 185 | 169/623 | ||
| Wang et al (2014)58 | 2011 | Relative | Province | Multistage | 65 | ≥18 | 1905/4045 | 4090/7411 | 5238/9786 | 661/1670 | 1855/3291 | 4420/7486 |
| Yan et al (2014)57 | 2012 | Relative | Province | Multistage | 67 | 15–69 | 140/522 | 417/1044 | 321/700 | 373/866 | ||
| Li, S.J et al (2013)54 | 2011 | Relative | Province | Multistage | 81 | ≥18 | 230/558 | 1070/2279 | 2813/3629 | 1300/2837 | ||
| Fan et al (2013)69 | 2010 | Relative | Province | Multistage | 71 | 15–69 | 107/166 | 202/417 | ||||
| Li et al (2013)45 | 2012 | Relative | Province | Multistage | 15–69 | |||||||
| Liu et al (2013)34 | 2012 | Special | Province | Multistage | 65 | ≥15 | 113/262 | 233/491 | 322/653 | – | 346/753 | |
| Wu et al (2013)70 | 2010 | Relative | Province | Multistage | 66 | ≥18 | 69/144 | 141/285 | 182/366 | 28/63 | ||
| Zhang et al (2013)35 | 2010 | Special | Province | Multistage | 67 | 15–69 | 413/1293 | 1171/2901 | 1525/3967 | 59/227 | 1584/4194 | |
| Cai, L. et al (2012)37 | 2010 | Special | Province | Multistage | 78 | ≥18 | 901/1289 | 3469/4567 | 775/1194 | 4370/5856 | ||
| Feng et al (2012)52 | 2010 | Relative | Province | Multistage | 66 | ≥15 | 156/257 | 295/508 | 403/687 | 551/765 | ||
| Han et al (2012)56 | Relative | Province | Multistage | 88 | ≥18 | 26/104 | 309/794 | 335/898 | ||||
| Huang et al (2012)51 | 2010 | Relative | Province | Multistage | 68 | 15–65 | 50/103 | 77/221 | 127/324 | |||
| Li et al (2012)47 | 2010 | Relative | Province | Cluster | 62 | 35–86 | 35/84 | 62/138 | 97/222 | |||
| Sun et al (2012)50 | 2010 | Relative | Province | Stratified | 81 | ≥18 | 76/183 | 248/748 | 266/589 | 58/159 | 324/931 | |
| Wang et al (a) (2012)71 | 2010 | Relative | Province | Multistage | 74 | 15–69 | 131/415 | 501/1159 | 464/1122 | 27/93 | ||
| Wang et al (b) (2012)55 | 2010 | Relative | Province | Multistage | 68 | ≥15 | 582/1521 | 1258/3197 | 1605/3914 | 235/804 | 1840/4718 | |
| Wei et al (2012)46 | 2010 | Relative | Province | Cluster | 61 | ≥15 | 99/220 | 134/345 | 233/565 | |||
| Xu et al (2012)36 | 2010 | Special | Province | Multistage | 69 | ≥15 | 293/467 | 613/1047 | 513/821 | 420/806 | ||
| Feng et al (2011)62 | 2010 | Relative | Province | Multistage | 99 | ≥18 | 1/5 | 243/440 | ||||
| Meng et al (2011)59 | 2007 | Relative | Province | Multistage | 66 | 15–69 | 254/853 | 519/1647 | 417/1118 | 356/1380 | ||
| Chinese CDC (2010)18 | 2007 | Relative | National | Multistage | 72 | 15–69 | 3632/9879 | 10 546/26 145 | 12 116/69 768 | 1384/4659 | 5470/14 341 | 8708/21 683 |
| GATS China (2010)6 | 2010 | Special | National | Multistage | 69 | ≥15 | 2045/2760 | 4514/6305 | ||||
| Chinese CDC (2009)38 | 2004 | Special | National | Multistage | 79 | 18–69 | 1501/4842 | 6016/17 747 | 6243/17 929 | 612/2519 | 3047/8809 | 4470/13 780 |
| Chen et al (2009)72 | 2007 | Relative | Province | Multistage | 77 | 15–69 | 207/585 | 727/1950 | ||||
| Zhou et al (2009)16 | 2008 | Relative | Province | Stratified | 79 | ≥15 | 107/135 | 457/518 | 564/653 | |||
| Wang et al (2008)17 | 2004 | Special | Province | Multistage | 71 | 18–69 | 646/2358 | 1673/5784 | 2022/7079 | 211/1063 | 2391/8142 | |
| Jiang et al (2007)48 | 2004–2005 | Relative | Province | Cluster | ≥18 | 11 037/15 110 | ||||||
| Su et al (2007)53 | 2006 | Relative | Province | Multistage | 74 | ≥18 | 519/727 | 730/2068 | 1240/2523 | 81/272 | 1249/2795 | |
| Wang et al (2007)60 | 2004 | Relative | Province | Multistage | 64 | 15–69 | 792/2100 | 1641/3699 | 1268/3054 | 1222/2244 | ||
| Han et al (2006)40 | 2002 | Special | Province | Multistage | 100 | 15–94 | 2886/3500 | 2886/3500 | ||||
| Huang et al (2006)49 | 2002 | Relative | Province | Cluster | 93 | ≥40 | 298/354 | 3895/5300 | 1559/2201 | 500/1192 | 3393/5654 | |
| Ying et al (2006)39 | 2002 | Special | Province | Multistage | 100 | 15–86 | 814/1000 | 619/753 | 81/110 | 814/1000 | ||
| Zhang et al (2006)61 | 2002 | Relative | Province | Multistage | 69 | ≥15 | 437/2184 | 1823/4899 | 1908/5789 | 310/1242 | 1768/3850 | 1441/3764 |
| Ma et al (county team)(2006)44 | 2002 | Relative | National | Multistage | 70 | ≥15 | 9957/38 167 | 47 946/87 975 | 43 136/102 170 | 6108/21 021 | 29 236/47 792 | 56 699/89 991 |
| Yang et al (2005)41 | 2002 | Special | National | Multistage | 74 | 15–69 | 1323/2780 | 4169/7635 | ||||
| Yao et al (2002)42 | 1999 | Special | Province | Unclear | 66 | ≥18 | 292/1244 | 750/2389 | 992/3369 | 70/264 | 1042/3633 | |
| Wen et al (1999)73 | 1996 | Relative | Province | Multistage | ≥15 | |||||||
| Lin et al (1997)74 | 1995 | Relative | Province | Multistage | 75 | 15–69 | 468/1193 | 1537/3641 | ||||
Overall prevalence of passive smoking
A total of 173 622 non-smokers had been exposed to passive smoke. Estimates of the prevalence of passive smoking ranged from 28.7% to 86.4% (figure 2) with high heterogeneity (χ2=25 612.75, p<0.001; I2=99.8%). The pooled prevalence was 48.7% (95% CI 44.8% to 52.5%) and increased at an even rate over the survey years from 43.4% (95% CI 30.2% to 56.5%) in the 1995–1999 period to 51.6% (95% CI 35.6% to 67.6%) in the 2005–2007 period (see online supplementary table S2).
Figure 2.

Forest plot of the pooled prevalence and CIs of passive smoking in the community population aged 15 years and older in China. ES, effect size.
Subgroup and trend analyses
We collected and stratified the eligible studies by gender, area and age, for further subgroup analyses (table 1). The results are presented in table 2.
Table 2.
Pooled prevalence of passive smoking by gender, area and age, in the community population aged 15 years and older in China
| Heterogeneity |
Egger's test |
||||||
|---|---|---|---|---|---|---|---|
| Subgroup | Number of studies | Prevalence % (95% CI) | χ2 | p Value | I2, % | t | p Value |
| Gender | |||||||
| Male | 39 | 43.4 (38.9 to 48.0) | 7386.26 | <0.001 | 99.5 | 3.29 | 0.002 |
| Female | 43 | 47.8 (43.9 to 51.6) | 16 726.46 | <0.001 | 99.7 | −0.39 | 0.701 |
| Area | |||||||
| Rural | 20 | 43.5 (37.5 to 49.5) | 12 889.39 | <0.001 | 99.9 | −0.41 | 0.688 |
| Urban | 21 | 48.6 (42.9 to 54.2) | 7321.31 | <0.001 | 99.7 | 0.54 | 0.596 |
| Age | |||||||
| ≥60 | 24 | 35.1 (31.8 to 38.3) | 1378.78 | <0.001 | 98.3 | 1.44 | 0.164 |
| 15–59 | 22 | 47.1 (43.2 to 50.9) | 6681.43 | <0.001 | 99.7 | 1.17 | 0.257 |
Thirty-nine studies reported data for both genders, and three studies32 39 40 reported data only for females, so we included a total of 271 307 females and 94 424 males in the subgroup analyses. We excluded the data from one study62 that only included five male non-smokers. The pooled prevalence of passive smoking among females and males was 47.8% (95% CI 43.9% to 51.6%) and 43.4% (95% CI 38.9% to 48.0%), respectively. However, the difference calculated using the data of the 39 studies was not statistically significant (OR 1.19, 95% CI 0.99 to 1.43). In addition, the pooled prevalence of passive smoking among females changed significantly over the survey years, whereas among males it increased significantly from 2002 to 2010 and has decreased slightly in recent years (figure 3). The highest prevalence of passive smoking among females and males was between 2002 and 2004 (52.8% (95% CI 43.1% to 62.6%)) and between 2008 and 2010 (48.4% (95% CI 38.5% to 58.3%)), respectively (see online supplementary table S2). However, the estimated publication bias indicated that more studies are necessary to accurately pool the prevalence of passive smoking among males (Egger's test, p=0.002).
Figure 3.
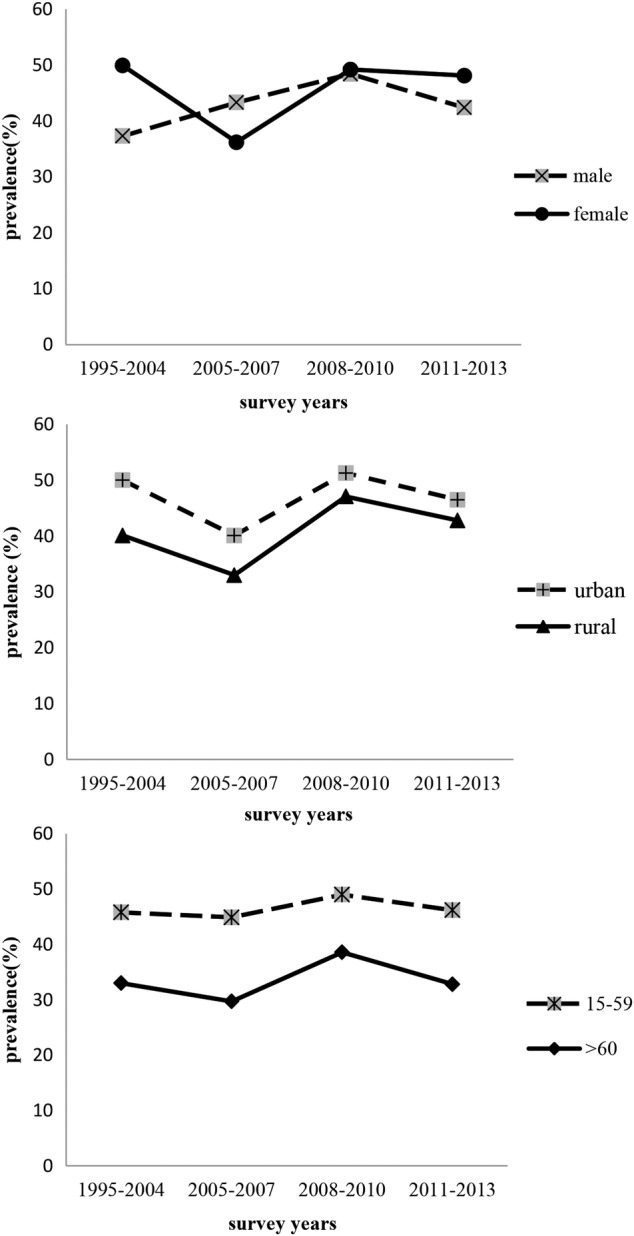
Trends in the pooled prevalence of passive smoking by gender, area and age in the community population aged 15 years and older in China: 2002–2013.
Twenty-one studies reported data for urban areas. These studies included a total of 123 369 non-smokers, 55 905 of whom were exposed to SHS. This resulted in a pooled prevalence of 48.6% (95% CI 42.9% to 54.2%). Twenty studies reported data for rural areas. A total of 192 375 non-smokers were included in these studies, 86 824 of whom were exposed to SHS, resulting in a pooled prevalence of 43.5% (95% CI 37.5% to 49.5%). We did not estimate the difference in the prevalence of passive smoking between urban and rural areas because of the small number of studies (n=9) that examined both areas. However, the prevalence of passive smoking was higher in urban areas than in rural areas for all those studies, and the prevalence in both areas showed an upward trend, particularly from 2005 to 2013 (figure 3). We also conducted a comparison of gender by area (figure 4); no significant difference was found between genders in either urban or rural areas (OR 1.27, 95% CI 0.93 to 1.74 and OR 1.14, 95% CI 0.82 to 1.58, respectively).
Figure 4.

The risk of passive smoking between genders and areas in the community population aged 15 years and older in China.
The participants in the 46 included studies were divided into two age groups, with 60 years of age designated the cut-off between groups, to simplify the data analysis. A higher prevalence was found in the group aged 15–59 years than in the group aged ≥60 years (OR 1.61, 95% CI 1.44 to 1.81). The pooled prevalence for the two groups was 47.1% (95% CI 43.2% to 50.9%) and 35.1% (95% CI 31.8% to 38.3%), respectively, and the difference remained constant throughout the survey years (figure 3).
Sensitivity analysis
The results of four sensitivity analyses did not significantly alter the pooled prevalence (table 3). When all included studies were compared, the absolute change in estimated prevalence ranged from 3.1% to 4.8%. The results of the ‘trim and fill’ method indicated that the pooled prevalence of males was moderate despite the existent publication bias (Egger's test, p=0.002) (see online supplementary figure S1). The heterogeneity of all analyses was substantial (I2>98%).
Table 3.
Sensitivity analyses of the prevalence of passive smoking in China
| Outcome | Number of studies | Number of non-smokers | Prevalence % (95% CI) | I2, % |
|---|---|---|---|---|
| All included studies | 46 | 381 580 | 48.7 (44.8 to 52.5) | 99.8 |
| National survey | 6 | 219 243 | 45.6 (36.8 to 54.3) | 99.9 |
| Non-national survey | ||||
| Non-national survey (sample size ≥1000) | 25 | 153 709 | 46.6 (40.3 to 52.9) | 99.9 |
| Non-national survey (sample size <1000) | 15 | 8628 | 53.5 (44.5 to 62.4) | 98.8 |
| Overall | 40 | 162 337 | 49.1 (44.1 to 54.1) | 99.8 |
Discussion
Our meta-analysis of the prevalence of passive smoking in the community population aged 15 years and older in China identified 46 studies and 381 580 non-smokers. The pooled overall prevalence of passive smoking was 48.7% (95% CI 44.8% to 52.5%) and remained high throughout the study period. Compared with the estimated prevalence of passive smoking in other developing countries, China is at an intermediate level;63 however, passive smoking in China is much more common than in the USA, where the prevalence of adult (>20 years) non-smokers exposed to passive smoke was 48.0% (42.6% to 53.4%) between 1999 and 2000 and decreased to 21.3% (18.6% to 24.0%) between 2011 and 2012.64 This finding indicates that China has not yet met its commitment to the Framework Convention on Tobacco Control and that we need to further accelerate the process of legislation and the implementation of tobacco control.
The prevalence of passive smoking in China varies by gender, area and age group. Specifically, previous studies showed that females were more likely to be exposed to passive smoke, due to the high proportion and rate of smoking among Chinese men and to women's difficulty in avoiding exposure because of the social environment that existed at the time of those studies, in which women held a weak position in the family and workplace.6 However, our trend and subgroup analyses revealed a remarkable increase in the prevalence of passive smoking among males, particularly from 2002 to 2010, and found that the differences in the overall prevalence and the prevalence in urban and rural areas between females and males were not significant. This result may be valuable from a public health standpoint as it suggests that, although tobacco exposure of females in China is a source of major concern, attention should also be given to male non-smokers, who have a greater likelihood of passive smoking in the workplace and in public areas.63
The prevalence of passive smoking in urban areas was higher than in rural areas throughout the survey years, and an upward trend was found in both areas from 2002 to 2013. However, a previous meta-analysis on the prevalence of passive smoking in China obtained the opposite results, indicating that the prevalence of passive smoking was greater in rural areas than in urban areas.65 Several factors may have contributed to this divergence. First, our meta-analysis used stricter criteria and included 30 studies published between 2010 and 2015 that were not included in the previous meta-analysis. Second, people in urban areas may be more likely to be exposed to passive smoke in the workplace and during social interactions. Third, passive smoking was measured by self-reporting in all eligible studies. The much greater health consciousness in urban areas could have led to more self-reports of passive smoking,66 and the prevalence may have been underestimated in rural areas. With the trend of urbanisation in China and the massive annual migration to urban areas for jobs, tobacco control policies should focus on both populations.
The age analysis showed that people aged 15–59 years were 61% more likely to be exposed to SHS than those aged ≥60 years. The possible explanation for this finding is that the retired elderly are more concerned about health, and some have quit smoking or intentionally reduced tobacco exposure because of multiple chronic diseases and on the advice of their doctors.67 In addition, the high prevalence of passive smoking among people aged 15–59 years, which was stable for nearly a decade, suggests that more attention should be paid to tobacco exposure in young and middle-aged non-smokers.
There are some limitations in this meta-analysis. First, the heterogeneity between studies was substantial despite the strict inclusion and exclusion criteria. Subgroup, trend and sensitivity analyses were performed to explore the high heterogeneity but with no conclusive results. Therefore, the more conservative random effects meta-analysis model was used. The high heterogeneity might have been due to the confounding effects of the variations in geographical distribution of the eligible studies, and these could not be extracted based on characteristics such as age in different genders, education level, ethnicity and passive source because many of the included studies reported passive smoking as an additional outcome. Second, no studies on special administrative regions were included, which limits the representativeness and significance of these findings. Third, most eligible studies were written in Chinese, which makes it difficult for non-Chinese readers to review the original materials. Finally, pregnant women and children (<15 years old), whose health is more seriously affected by passive smoking, were not included in the review.4
Conclusion
Tobacco control has been difficult to implement since China committed to the Framework Convention on Tobacco Control. This meta-analysis summarises the prevalence and distribution of passive smoking in the community population aged 15 years and older in China to help inform public policy. Young and middle-aged populations, regardless of region, are vulnerable to exposure. Although women have been the primary focus to date, attention should also be given to male non-smokers. The existing studies on tobacco control, especially those regarding passive smoking in China, are insufficient, and the high and stable prevalence of passive smoking over the past decade requires a nationwide focus and effective cessation interventions.
Footnotes
Contributors: SY conceived and JZ designed the research. JZ and SY conducted the systematic review. YH, LW, JW, YW, DZ and BJ interpreted the data. JZ performed the statistical analysis. YH and ML handled supervision. JZ and SY drafted the manuscript.
Funding: This study was supported by the National Natural Science Foundation of China (81373080), the Beijing Municipal Science and Technology Commission (Z121107001012070), the Beijing Municipal Science and Technology Commission (D121100004912003) and the Chinese PLA General Hospital Doctor Innovation Foundation (13BCZ07).
Competing interests: None declared.
Provenance and peer review: Not commissioned; externally peer reviewed.
Data sharing statement: No additional data are available.
References
- 1.Lim SS, Vos T, Flaxman AD et al. . A comparative risk assessment of burden of disease and injury attributable to 67 risk factors and risk factor clusters in 21 regions, 1990–2010: a systematic analysis for the Global Burden of Disease Study 2010. Lancet 2012;380:2224–60. 10.1016/S0140-6736(12)61766-8 [DOI] [PMC free article] [PubMed] [Google Scholar]
- 2.Max W, Sung HY, Shi Y. Deaths from secondhand smoke exposure in the United States: economic implications. Am J Public Health 2012;102:2173–80. 10.2105/AJPH.2012.300805 [DOI] [PMC free article] [PubMed] [Google Scholar]
- 3.Morishima T, Imanaka Y, Otsubo T et al. . Burden of household environmental tobacco smoke on medical expenditure for Japanese women: a population-based cohort study. J Epidemiol 2013;23:55–62. 10.2188/jea.JE20120072 [DOI] [PMC free article] [PubMed] [Google Scholar]
- 4.U.S. Department of Health and Human Services. The health consequences of smoking-50 years of progress: a report of the surgeon general. Atlanta, GA: Centers for Disease Control and Prevention (US), 2014. [Google Scholar]
- 5.Yang G, Wang Y, Wu Y et al. . The road to effective tobacco control in China. Lancet 2015;385:1019–28. 10.1016/S0140-6736(15)60174-X [DOI] [PubMed] [Google Scholar]
- 6.GTAS China. Global Adult Tobacco Survey—part of China Survey Report. Beijing: China CDC, 2010. [Google Scholar]
- 7.Yang G, Wang Y, Zeng Y et al. . Rapid health transition in China, 1990–2010: findings from the Global Burden of Disease Study 2010. Lancet 2013;381:1987–2015. 10.1016/S0140-6736(13)61097-1 [DOI] [PMC free article] [PubMed] [Google Scholar]
- 8.Chen Z, Peto R, Zhou M et al. . Contrasting Male and female trends in tobacco-attributed mortality in China: evidence from successive nationwide prospective cohort studies. Lancet 2015;386:1447–56. 10.1016/S0140-6736(15)00340-2 [DOI] [PMC free article] [PubMed] [Google Scholar]
- 9.Hyland A, Higbee C, Borland R et al. . Attitudes and beliefs about secondhand smoke and smoke-free policies in four countries: findings from the International Tobacco Control Four Country Survey. Nicotine Tob Res 2009;11:642–9. 10.1093/ntr/ntp063 [DOI] [PMC free article] [PubMed] [Google Scholar]
- 10.Hu TW, Lee AH, Mao Z. WHO Framework Convention on Tobacco Control in China: barriers, challenges and recommendations. Glob Health Promot 2013;20:13–22. [DOI] [PMC free article] [PubMed] [Google Scholar]
- 11.Xu Z, Han H, Zhuang C et al. . Tobacco use and exposure to second-hand smoke among urban residents: a community-based investigation. Int J Environ Res Public Health 2015;12:9799–808. 10.3390/ijerph120809799 [DOI] [PMC free article] [PubMed] [Google Scholar]
- 12.Yang T, Jiang S, Barnett R et al. . Who smokes in smoke-free public places in China? Findings from a 21 city survey. Health Educ Res 2016;31:36–47. 10.1093/her/cyv054 [DOI] [PMC free article] [PubMed] [Google Scholar]
- 13.Schwartlander B, Pratt A. Tobacco in China: taming the smoking dragon. Lancet 2015;385:2123–4. 10.1016/S0140-6736(15)60996-5 [DOI] [PubMed] [Google Scholar]
- 14.Katanoda K, Jiang Y, Park S et al. . Tobacco control challenges in East Asia: proposals for change in the world's largest epidemic region. Tob Control 2014;23:359–68. 10.1136/tobaccocontrol-2012-050852 [DOI] [PMC free article] [PubMed] [Google Scholar]
- 15.Yang S, He Y, Liu M et al. . Changes in and patterns of smoking exposure in an elderly urban population in Beijing: 2001–2010. PLoS ONE 2015;10:e0118500 10.1371/journal.pone.0118500 [DOI] [PMC free article] [PubMed] [Google Scholar]
- 16.Zhou Y, Luo T, Mao W et al. . Smoking and passive smoking status in men and women of Yun county, Yunan province. Chin J Public Health 2009;25:1189–91. [Google Scholar]
- 17.Wang CP, Xu XF, Ma SJ et al. . [The current status of passive smoking in Chinese families and associated factors]. Chin J Prey Med 2008;42:186–91. [PubMed] [Google Scholar]
- 18.China CDC. Chronic disease and its risk factor surveillance in China (2007). Beijing: People's Medical publishing House, 2010. [Google Scholar]
- 19.Stroup DF, Berlin JA, Morton SC et al. . Meta-analysis of observational studies in epidemiology: a proposal for reporting. Meta-analysis Of Observational Studies in Epidemiology (MOOSE) group. JAMA 2000;283:2008–12. [DOI] [PubMed] [Google Scholar]
- 20.Moher D, Liberati A, Liberati A et al. , PRISMA Group. Preferred reporting items for systematic reviews and meta-analyses: the PRISMA statement. Open Med 2009;3:e123–30. [PMC free article] [PubMed] [Google Scholar]
- 21.Yang G, Fan L, Tan J et al. . Smoking in China: findings of the 1996 National Prevalence Survey. JAMA 1999;282:1247–53. 10.1001/jama.282.13.1247 [DOI] [PubMed] [Google Scholar]
- 22.Loney PL, Chambers LW, Bennett KJ et al. . Critical appraisal of the health research literature: prevalence or incidence of a health problem. Chronic Dis Can 1998;19:170–6. [PubMed] [Google Scholar]
- 23.Woodbury MG, Houghton PE. Prevalence of pressure ulcers in Canadian healthcare settings. Ostomy Wound Manage 2004;50:22–4, 6, 8. [PubMed] [Google Scholar]
- 24.Barendregt JJ, Doi SA, Lee YY et al. . Meta-analysis of prevalence. J Epidemiol Community Health 2013;67:974–8. 10.1136/jech-2013-203104 [DOI] [PubMed] [Google Scholar]
- 25.Wang PX, Li HT, Liu JM. Meta-analysis of non-comparative binary outcomes and its solution by Stata. J Evid Based Med 2012;12:52–6. [Google Scholar]
- 26.Jonathan AC. Sterne. Meta-analysis in Stata: an undated collection from the Stata journal. USA: Stata Press, 2009:6. [Google Scholar]
- 27.Borenstein M, Hedges LV, Higgins JP et al. . A basic introduction to fixed-effect and random-effects models for meta-analysis. Res Synth Methods 2010;1:97–111. 10.1002/jrsm.12 [DOI] [PubMed] [Google Scholar]
- 28.DerSimonian R, Laird N. Meta-analysis in clinical trials. Control Clin Trials 1986;7:177–88. 10.1016/0197-2456(86)90046-2 [DOI] [PubMed] [Google Scholar]
- 29.Xiao-yan QI. Smoking and passive smoking status and its influencing factors in Henan residents. Zhengzhou University, 2014. [Google Scholar]
- 30.Jiang-rong LI. Analysis of current situation and influencing factors of tobacco exposure in Yu Long county of Yunnan province. Kunming Medical University, 2014. [Google Scholar]
- 31.Hui LI, Zhang T, Wang Y et al. . Survey on secondhand smoking exposure among the residents in Ningbo. Chin J Health Educ 2014;30:583–6. [Google Scholar]
- 32.Chen C, Huang Y, Liu X et al. . [Current status of smoking and passive smoking among aged 45 to 65 years old females in five cities of China]. Zhonghua Liu Xing Bing Xue Za Zhi 2014;35:797–801. [PubMed] [Google Scholar]
- 33.Cai L, Cui W, He J et al. . The economic burden of smoking and secondhand smoke exposure in rural South-West China. J Asthma 2014;51:515–21. 10.3109/02770903.2014.892964 [DOI] [PubMed] [Google Scholar]
- 34.Liu M, Qu Z, Miao J. Survey on passive smoking prevalence among residents aged 15 and older in Chongqing. Chongqing Med 2013;42:4302–6. [Google Scholar]
- 35.Zhang L, Cui Y, Wang C et al. . [Survey on status of smoking, passive smoking and quitting smoking in rural areas of the midwestern provinces in China]. Zhonghua Liu Xing Bing Xue Za Zhi 2013;34:137–9. [PubMed] [Google Scholar]
- 36.Xu Y, Wu QQ, Xu SY et al. . Current research of passive smoking exposure in Zhejiang. Dis Surveill 2012;27:887–97. [Google Scholar]
- 37.Cai L, Wu X, Goyal A et al. . Patterns and socioeconomic influences of tobacco exposure in tobacco cultivating rural areas of Yunnan Province, China. BMC Public Health 2012;12:842 10.1186/1471-2458-12-842 [DOI] [PMC free article] [PubMed] [Google Scholar]
- 38.China CDC. Chronic disease and its risk factor surveillance in China (2004). Beijing: Peking Union Medical College Press, 2009. [Google Scholar]
- 39.Ying GY, Liu X, Gan DK et al. . Cross-sectional study on the influence of passive smoking on no smoking women's health. Mod Prev Med 2006;33:2044–6. [Google Scholar]
- 40.Han JX, Ma L, Zhang HW et al. . A cross sectional study of passive smoking of non-smoking women and analysis of influence factors on women passive smoking. Wei Sheng Yan Jiu 2006;35:609–11. [PubMed] [Google Scholar]
- 41.Yang GH, Ma JM, Liu N et al. . [Smoking and passive smoking in Chinese, 2002]. Zhonghua Liu Xing Bing Xue Za Zhi 2005;26:77–83. [PubMed] [Google Scholar]
- 42.Yao JH, Deng Q, Guo X et al. . A cross-sectional study of passive smoking among urban residents. Mod Prev Med 2002;29:353–5. [Google Scholar]
- 43.China CDC. A report on the health of the aged and its risk factors surveillance in China (2010). Beijing: People's Medical Publishing House, 2014. [Google Scholar]
- 44.Guan-sheng MA, Kong LZ. Behaviour and lifestyle of the survey report of the residents' nutrition and health status in China 2002. Beijing: People's Medical publishing House, 2006. [Google Scholar]
- 45.Qiong-yan LI, Guo-zhong HU, Zhang B. Investigation on exposure status of smoking and secondhand smoking among residents on Daishan Island of Zhejiang Province. Chin J Health Educ 2013;29:938–9+50. [Google Scholar]
- 46.Wei Q. Smoking behaviour status analysis and countermeasures research for health promotion for 15 years old and above of the community residents in Nanning city proper. Guangxi Medical University, 2012. [Google Scholar]
- 47.Chun-yan LI, Tang SY. Survey and analysis on morbidity rates of main chronic diseases in the middle-aged and elderly in community and the smoking behaviour. Chin Nurs Res 2012;26:317–18. [Google Scholar]
- 48.Jiang WP, Wang YL, Zhang JT et al. . Epidemiological survey on smoking pattern of residents in rural community. Chin J Public Health 2007;23:56–7. [Google Scholar]
- 49.Huang JY, Cao YF, Guo JP et al. . Investigation on cigarette smoking in rural area population over 40 years of Guangming town of Shanghai city. Chin J Public Health 2006;22:478–9. [Google Scholar]
- 50.Sun J, Cha J, Li HL. Analysis of smoking status of rural residents in Fuyang City. Chin Rural Health Serv Adm 2012;32:1259–60. [Google Scholar]
- 51.Huang RQ. A study on tobacco use among residents in Changning district, Shanghai. Fudan University, 2012. [Google Scholar]
- 52.Feng LY, Sun L, Sun JF et al. . Smoking behavior of community residents in Zhengzhou 2010. China, Nanjing: the Fifteenth National Symposium on control of smoking, 2012. [Google Scholar]
- 53.Su J. The study on risk factors related to non-communicable chronic diseases and disability adjusted life expectancy of residents in Chengdu. Sichuan University, 2007. [Google Scholar]
- 54.Li SJ, Cai L, Shu ZK et al. . [Analysis of association of economic burden of hypertension with tobacco exposure in Luoping county of Yunnan province]. Zhonghua Yu Fang Yi Xue Za Zhi 2013;47:958–62. [PubMed] [Google Scholar]
- 55.Wang X. Investigation studies on tobacco exposure and KAP about tobacco in rural areas. Shangdong University, 2012. [Google Scholar]
- 56.Han F. The study on smoking and passive smoking status influence factors research of Rural Residents in Tonghai County Yunnan Province. Kunming Medical University, 2012. [Google Scholar]
- 57.Yan W, Zhu LP, Ji L et al. . Investigation of smoking prevalence in residents (15–69 years old) of Jiangxi province. Chin J Prev Control Chronic Dis 2014;22:648–50. [Google Scholar]
- 58.Wang HC, Zhang JY, Yan LX et al. . Survey on the Status of Smoking in Adult Population in Shandong Province of China during 2011. Mod Prev Med 2014;41:2202–5+23. [Google Scholar]
- 59.Meng XY, Chen NY, Yang H et al. . Smoking, passive smoking and smoking cessation among urban and rural residents in Guangxi. Chin J Prevention Control Chronic Disease 2011;34:206–7. [Google Scholar]
- 60.Wang H, Hu RY, Yu M et al. . Investigation on smoking status and its costs in residents in Zhejiang Province. Dis Surveill 2007;22:633–5. [Google Scholar]
- 61.Zhang JH, Tang ZZ, Chen XL et al. . Smoking status of residents aged 15 years and over in Guangxi. Appl Prev Med 2006;12:272–5. [Google Scholar]
- 62.Feng W, Sun S, Cao YS et al. . Prevalence of smoking among residents in Fenghua city, Zhejiang province. Dis Surveill 2011;26:550–3. [Google Scholar]
- 63.King BA, Mirza SA, Babb SD. A cross-country comparison of secondhand smoke exposure among adults: findings from the Global Adult Tobacco Survey (GATS). Tob Control 2013;22:e5 10.1136/tobaccocontrol-2012-050582 [DOI] [PMC free article] [PubMed] [Google Scholar]
- 64.Homa DM, Neff LJ, King BA et al. . Vital signs: disparities in nonsmokers' exposure to secondhand smoke—United States, 1999–2012. MMWR Morb Mortal Wkly Rep 2015;64:103–8. [PMC free article] [PubMed] [Google Scholar]
- 65.He Q, Wang J, Zhu Y et al. . [Prevalence of passive smoking among inland residents in China: a systematic analysis of 2000–2009 studies]. Zhonghua Liu Xing Bing Xue Za Zhi 2011;32:159–63. [PubMed] [Google Scholar]
- 66.Yao Z. Problems and Countermeasures of the knowledge gap in the urban and rural health communication. Chengdu University of Technology, 2012. [Google Scholar]
- 67.Shadel WG, Elliott MN, Haas AC et al. . Clinician advice to quit smoking among seniors. Prev Med 2015;70:83–9. 10.1016/j.ypmed.2014.11.020 [DOI] [PMC free article] [PubMed] [Google Scholar]
- 68.Chen XX, Wang LY, Liu LC. Investigation on behaviour risk factors for chronic diseases among adults in Taizhou City, Zhejiang Province. Chin J Health Educ 2014;30:889–91+99. [Google Scholar]
- 69.Fan LH, Zhang N, Shao YQ. Survey on smoking and drinking among residents in Wenzhou. Shanghai J Prev Med 2013;25:225–8+31. [Google Scholar]
- 70.Wu CX. A cross-sectional Study on overweight, obesity and hypertension among population in Qianjiang District, Chongqing. Third Military Medical University, 2013. [Google Scholar]
- 71.Wang LY. Cross-sectional study of adult health related behaviour risk factors in Taizhou City. Fudan University, 2012. [Google Scholar]
- 72.Chen ML, Zheng YL, Lu ZL et al. . Prevalence of smoking behaviour among residents aged 15∼69 in Shandong Province in 2007. Chin J Dis Control Prevention 2009;13:163–6. [Google Scholar]
- 73.Wen YB, Huang CM, She HZ et al. . Epidemiological Survey on Smoking Pattern of Residents in Shantou, 1996. Guangdong J Health Epidemic Prev 1999;26:1–3. [Google Scholar]
- 74.Lin H, Hong RT, Zheng JF et al. . An epidemiological survey on the characteristics of smoking behaviours in Fujian, China. Strait J Prev Med 1997;3:4–7. [Google Scholar]
Associated Data
This section collects any data citations, data availability statements, or supplementary materials included in this article.
Supplementary Materials
bmjopen-2015-009847supp.pdf (336KB, pdf)