

Summary
Nutrient levels dictate the activity of O-linked N-acetylglucosamine Transferase (OGT) to regulate O-GlcNAcylation, a post-translational modification mechanism to “fine-tune” intracellular signaling and metabolic status. However, the requirement of O-GlcNAcylation for maintaining glucose homeostasis by regulating pancreatic β-cell mass and function is unclear. Here, we reveal that mice lacking β-cell OGT (βOGT-KO) develop diabetes and β-cell failure. βOGT-KO mice demonstrated increased ER stress and distended ER architecture, and these changes ultimately cause the loss of β-cell mass due to ER stress-induced apoptosis and decreased proliferation. Akt1/2 signaling was also dampened in βOGT-KO islets. The mechanistic role of these processes was demonstrated by rescuing the phenotype of βOGT-KO mice with concomitant Chop gene deletion or genetic reconstitution of Akt2. These findings identify OGT as a regulator of β-cell mass and function, and provide a direct link between O-GlcNAcylation and β-cell survival by regulation of ER stress responses and modulation of Akt1/2 signaling.
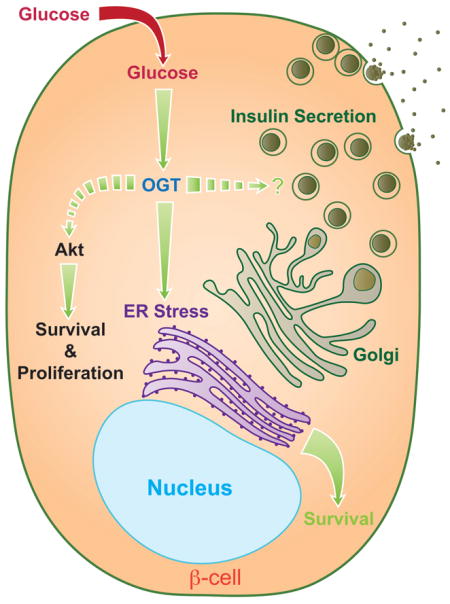
Graphical abstract
Introduction
Type 2 diabetes (T2D) occurs when pancreatic β-cells fail to adequately expand and function sufficiently when there is increased insulin demand with insulin resistance (Alejandro et al., 2014a). The ability of β-cells to fulfill the demand in insulin is dependent on both β-cell mass and function. Although the pathogenesis of β-cell dysfunction in T2D remains controversial, failure of β-cell mass and function has been attributed to multiple factors including endoplasmic reticulum (ER) stress (Eizirik et al., 2008; Ferrannini, 2010). Deficits in adaptive β-cell mass are partly attributed to enhanced apoptosis in T2D (Marchetti et al., 2010) and inherent poor self-renewal capabilities of β-cells (Dor et al., 2004; Teta et al., 2007).
During the pathogenesis of T2D, β-cells are continually exposed to high levels of glucose. Approximately 3–5% of glucose entering the β-cell is shunted to the hexosamine biosynthetic pathway (HBP) for the synthesis of uridine diphosphate-N-acetylglucosamine (UDP-GlcNAc), the substrate for O-GlcNAcylation, a dynamic and reversible post-translational protein modification analogous to phosphorylation that affects the function, stability, and sub-cellular localization of β-cell proteins (i.e. Pdx-1). O-GlcNAcylation involves the addition of a single O-GlcNAc to serine or threonine residues on nuclear and cytosolic proteins solely by the enzyme O-linked GlcNAc transferase (OGT). The O-GlcNAc is removed by the O-linked β-N—acetyl hexosaminidase (O-GlcNAcase or OGA) enzyme. O-GlcNAcylation has been implicated in the etiology of insulin resistance and glucose toxicity in diabetes (Yang et al., 2008) (Copeland et al., 2008). Variants in OGA are associated with T2D (Lehman et al., 2005), suggesting the importance of O-GlcNAcylation in human diabetes. However, it is poorly understood how O-GlcNAcylation modulates β-cell responses to cause diabetes.
OGT is encoded by a single gene on the X-chromosome and is critical for development because whole body deletion of OGT is embryonically lethal (Shafi et al., 2000). Although β-cells uniquely expressed high levels of OGT, the importance of O-GlcNAcylation in insulin-secreting cells is unclear. O-GlcNAcylation of critical insulin signaling proteins to regulate metabolism (IRS-1, PDK1, Akt1/2, and FoxO1) and transcription factors required for insulin biosynthesis (NeuroD1, Pdx-1, and MafA) has been demonstrated, implying the importance of O-GlcNAcylation by OGT in β-cells (Andrali et al., 2007; Gao et al., 2003). Filholaud et al demonstrated that O-GlcNAcylation is also essential for β-cell development in vitro (Filhoulaud et al., 2009). The effect of decreased O-GlcNAcylation on β-cell function has been tested by over-expressing OGA in β-cells: these transgenic mice have increased glucose intolerance, decreased insulin synthesis, and secretory capacity only at young age (Soesanto et al., 2011). However, the mechanisms driving these phenotypes remains unknown.
The present studies investigate the direct requirement of O-GlcNAcylation in regulating β-cell mass and function in vivo. Using multiple genetic approaches, we report that female and male mice harboring β-cell OGT deletion (βOGT−/− or βOGT−/y respectively) developed severe hyperglycemia, glucose intolerance, impaired insulin secretion, and these mice ultimately exhibit severe diabetes due to β-cell failure. Loss of β-cell mass due to enhanced apoptosis was preceded by ER stress and down-regulation of critical prosurvival proteins Akt1/2 and Pdx-1. Deletion of one Chop allele, a protein induced by ER stress, improves hyperglycemia and restores β-cell mass in βOGT−/y confirming the critical mechanistic role of ER stress in the loss of β-cells. Finally, the rescue of the metabolic dysfunction in βOGT−/y mice over-expressing of Akt2 (βOGT−/−;caAkt(Tg)) highlights the importance of Akt signaling in islets lacking OGT. Together, these data implicate that loss of OGT leads to deterioration of β-cell mass, defects in insulin secretion, and diabetes. These data identify OGT as a regulator of β-cell mass and function, and emphasize the emerging role of this protein in β-cell survival by modulating ER stress and Akt signaling.
Results
Conditional deletion of OGT in β-cells causes severe hyperglycemia in an age-dependent manner
Assessment of OGT expression in acinar and islet lysates demonstrated that this protein is expressed primarily in islets (Figure 1A–B). To identify the importance of OGT in β-cell mass and function, we generated mice with conditional deletion of OGT in β-cells (male RIPCre;OGTflox/y (βOGT−/y) or female RIPCre;OGTflox/flox (βOGT−/−) by crossing male mice expressing Cre recombinase in β-cells (Rip-Cre) (Herrera, 2000) with female OGTflox/flox (breeding scheme shown in Supplemental Figure 1A). Efficient and specific recombination of the RIPCre enzyme in β-cells of βOGT−/y;CAGGFP (with GFP reporter) mice was observed by EGFP expression in the majority of the β-cells (Supplemental Figure 1B). OGT protein and mRNA levels were significantly reduced in islets from βOGT−/− mice compared to control (OGTx/x, Figure 1C and Supplemental Figure 1C). A reduction in OGA mRNA level was also observed (data not shown). No alteration of OGT protein level was observed in hypothalamus and liver tissues (Supplemental Figure 1D–E). A reduction of O-GlcNAcylation of proteins in islets from βOGT−/− mice confirmed OGT deletion in β-cells (Figure 1D). Body weight in male βOGT−/y and female βOGT−/− mice was comparable to littermate control (OGTx/y, data not shown). Examination of female βOGT−/− and littermate control mice (OGT+/+, here in referred to as control) showed hyperglycemia by 16 weeks of age (Figure 1E). In contrast, βOGT−/y mice developed random hyperglycemia earlier than female βOGT−/− with glucose levels greater than 350 mg/dL by 10 weeks (Figure 1F). A reduction in fed insulin levels was observed in 10-week old βOGT−/− mice (data not shown). These studies demonstrate that male and female mice lacking OGT in β-cells developed severe hyperglycemia in age-dependent manner.
Figure 1. Conditional deletion of OGT in β-cells causes severe hyperglycemia and glucose intolerance in an age-dependent manner.

(A, B) OGT protein level in primary mouse islet and acinar, and quantification is shown in B. (C) OGT protein level and quantification in islets from 8-week old βOGT−/− mice. (D) O-GlcNAc level, a read out of OGT activity, in islets from 8-week-old βOGT−/− and control mice. (E, F) Development of hyperglycemia in female (E) or male (F) βOGT-KO mice compared to control. (G–J) Intraperitoneal glucose tolerance test (IPGTT) was performed in female (G, I) and male (H, J) βOGT-KO mice and littermate control. *P < 0.05 vs. βOGT-KO and control.
Young and adult mice with conditional deletion of OGT in β-cells develop glucose intolerance
Next, we assessed glucose homeostasis in young and adult mice lacking OGT in β-cells. We observed significant impairment in glucose tolerance in female βOGT−/− mice starting at 10 weeks, a time point where they were still normoglycemic (Figure 1E,G). These mice developed severe glucose intolerance with elevated fasting blood glucose level by 20 weeks of life (Figure 1I). Because the male βOGT−/y mice developed hyperglycemia at earlier age, we tested glucose tolerance in four-week-old male βOGT−/y. These mice demonstrated normal glucose tolerance compared to control (Supplemental Figure 1F. In contrast, eight-week old βOGT−/y male mice exhibited glucose intolerance without fasting hyperglycemia compared to control (Figure 1H). Impaired glucose tolerance was even more significant with elevated fasting glucose level by 12 weeks of age (Figure 1J). Together, these data show male and female mice lacking OGT present glucose intolerance without apparent alteration in random glucose level.
Young mice lacking OGT in β-cells exhibit normal β-cell mass while adult mice show reduced β-cell mass
Next we sought to assess the relative contribution of insulin sensitivity in peripheral tissues. Despite demonstrating glucose intolerance, eight-week-old male βOGT−/y mice presented normal insulin tolerance (Figure 2A), pointing to a defect in β-cell mass or insulin secretion. To tease apart the relative contribution of β-cell mass and function, we first assessed β-cell mass in various ages. Because we observed similar phenotype in both gender, we focused on male βOGT−/y. We observed no alteration in β-cell mass at 4 and 7-week-old βOGT−/y mice compared to control (Figure 2B–C). Examination of adult 12-week-old βOGT−/y mice exhibited significant reduction in β-cell mass (Figure 2D). Adult female βOGT−/− mice also demonstrated reduced β-cell mass (Supplemental Figure 2A). The reduction in β-cell mass at 3 months was associated with a significant decrease in proliferation (Figure 2E), as well as induction of β-cell death measured by TUNEL staining (Figure 2F). Not surprisingly, significant reduction in β-cell mass was associated with blunted insulin secretion in 12-week old βOGT−/y mice compared to control (Figure 2G). Thus, significant reduction in β-cell mass was only observed in adult mice harboring OGT deletion in β-cells.
Figure 2. Young mice lacking OGT in β-cells exhibit normal β-cell mass and insulin secretion defect, while adult mice show reduced β-cell mass.

(A) Intraperitoneal insulin tolerance test (ITT) was performed in 10 week-old βOGT−/y mice and littermate control. (B–D) β-cell mass at 4 (B), 7 (C) and 12-week-old (D) βOGT−/y. (E–F) Proliferation assessed by KI67 staining (E), and apoptosis measured by TUNEL staining (F) in 12-week-old βOGT−/y mice. (G) In vivo glucose-stimulated insulin secretion (GSIS) in 12-week-old βOGT−/y and control mice. (H) Insulin secretion corrected to DNA content in response to 2 mM, 22 mM glucose, and 30 mM KCl of islets isolated from normoglycemic 8-week-old βOGT−/− mice and control. (I–M) Measurement of intracellular Ca2+ in islets of 8-week-old βOGT−/− mice. *P < 0.05 vs. βOGT-KO and control, n values and age of mice are noted within figures.
Young mice lacking OGT in β-cells have a defect in insulin secretion, in part due to altered Ca2+ signaling
To identify an independent β-cell function defect, islets from eight-week-old normoglycemic βOGT−/− mice with normal β-cell mass were assessed for insulin secretion in vitro. We observed diminished insulin secretion in response to both high glucose and KCl (Figure 2H) in βOGT−/− islets. Because we detected reduced insulin secretion in response to KCl, we assessed Ca2+ signaling and discovered that it was impaired in islets from 8-week-old normoglycemic βOGT−/− mice (Figure 2I). Interestingly, approximately 33% of βOGT−/− islets did not oscillate in response to 8 mM glucose compared to control (where 100% of islets oscillated). The oscillations of βOGT−/− islets showed reduced amplitude, period, and plateau fraction in response to 11 mM glucose compared to control (Figure 2J–M). Assessment of time dependent changes in calcium signaling showed impaired Ca2+ signaling at different ages including normoglycemic 6-week old mice and hyperglycemic 19-week-old mice lacking OGT (Supplemental Figure 2B). In addition to altered Ca2+ signaling, we identified that insulin content was reduced in normoglycemic βOGT−/y and βOGT−/− mice (Supplemental Figure 3A, B). A reduction in insulin content can be partly explained by the down regulation of ins1, ins2, Pdx-1, and NueroD1 mRNA levels in islets from male and female mice lacking OGT (Supplemental Figure 3C–I). These data implicate reduced Ca2+ signaling and insulin content as contributing factors to defective insulin secretion in mice with conditional deletion of OGT.
Mice with inducible deletion of OGT in mature β-cells develop glucose intolerance and defective insulin secretion
To assess the requirement of OGT in mature β-cells, we deleted OGT in β-cells of 12-week-old mice. By breeding the inducible MIPCre-ERTM and OGTflox/flox, we generated inducible MIPCre-ERTM;OGT−/y mice (iβOGT−/y). The MIPCre-ERTM recombination was efficient after Tamoxifen (TMX) injection as demonstrated by β-cell specific expression of GFP reporter transgene (Rosa-CAGZsGreen) only in iβOGT−/y islets (Supplemental Figure 3J). Four-weeks after TMX injection, we observed ~70% β-cells expressing the GFP reporter both in iβOGT−/y mice and control mice (MIPCre-ERTM; CAG-ZsGreen, Supplemental Figure 3K). iβOGT−/y mice did not develop hyperglycemia compared to βOGT−/y mice (data not shown). Eight-weeks post-TMX injection resulted in moderate but significant glucose intolerance in iβOGT−/y mice that worsened with age (Figure 3A–B). Significant glucose intolerance was observed at 12 and 22 weeks post-OGT ablation. In parallel to the glucose intolerance, an insulin secretion defect was detected in iβOGT−/y mice by glucose-stimulated insulin secretion (GSIS) test in vivo, confirming the importance of OGT in insulin secretion (Figure 3C). No significant changes in β-cell mass was observed between iβOGT−/y and control mice at 22 weeks post-TMX injection (Figure 3D). These data from the inducible model clearly suggest that OGT in mature β-cells is important for regulating insulin secretion.
Figure 3. Mice with inducible deletion of OGT in mature β-cells develop glucose intolerance and insulin secretion dysfunction.

(A–B) Ablation of OGT in mature β-cells caused glucose intolerance and insulin secretion dysfunction. IPGTT was performed in male iβOGT−/y (MIPCre;OGT−/y) post-Tamoxifen treatment at 12 (A) and 22 weeks (B). (C) In vivo GSIS in iβOGT−/y and control at 22 weeks post-Tamoxifen treatment. (D) β-cell mass assessment between iβOGT−/y and control mice measured at 22 weeks post-Tamoxifen treatment. *P < 0.05 vs. iβOGT−/y and control, n= 4–6.
Phloridzin, partially ameliorates the development of diabetes in mice lacking OGT in β-cells
Because a rapid loss in β-cell mass from 4 to 12-week-old in βOGT−/y and not in iβOGT−/y mice was observed, we hypothesized that glucotoxic conditions could play a role on the decline of β-cells. To assess an independent effect of glucotoxicity contributing to β-cell mass loss, we treated βOGT−/y mice with Phloridzin (PHZ), a naturally occurring metabolite that promotes glucose secretion in the kidney via inhibition of sodium-glucose contransporters (Ehrenkranz et al., 2005). We established two cohorts of mice implanted with osmotic pumps containing PHZ. The first cohort was 10-week-old βOGT−/y and control mice. Prior to implantation, we observed glucose intolerance and elevated fasting blood glucose level in βOGT−/y mice compared to control mice (Supplemental Figure 4A). No effect on body weight was observed in all mice treated with PHZ (data not shown). We tested the efficiency of PHZ to lower glucose during a fasting state on day-18 of treatment. After a 12-hour fasting, glucose levels of βOGT−/y mice were normalized to control (Supplemental Figure 4B), suggesting PHZ was effective in reducing blood glucose levels. Fed glucose levels in βOGT−/y mice were reduced and remained comparable to control mice from day-2 to day-15 of PHZ treatment (Supplemental Figure 4C). However, the effect of PHZ was transient; βOGT−/y mice eventually developed hyperglycemia and glucose intolerant on day-20 post-PHZ treatment (Supplemental Figure 4C–D). When compared to age-matched βOGT−/y mice without PHZ treatment (Figure 1I, Supplemental Figure 6D), PHZ treatment improved basal fasting glucose levels at time 0 and partially improved glucose tolerance in βOGT−/y mice (Supplemental Figure 4E–F). Both fed and fasting insulin levels remain significantly reduced in βOGT−/y mice compared to control treated with PHZ (Supplemental Figure 4G–H). These data suggest that hyperglycemia contributed to the metabolic dysfunction in βOGT−/y mice. Because PHZ normalized fasting blood glucose levels in βOGT−/y mice treated with PHZ and glucose intolerance was still present at this time, these data point to an inherent insulin secretion defect in mice lacking OGT.
We established a younger cohort of mice to assess whether an earlier and longer period of intervention could rescue the metabolic dysfunction in βOGT−/y mice. Seven-week-old βOGT−/y mice and control were implanted with ALZET pump with PHZ. Fed glucose levels of βOGT−/y mice treated with PHZ were comparable to control up to 16 days of continuous treatment (Figure 4A). When comparing to age-matched mice without PHZ treatment, βOGT−/y mice treated with PHZ demonstrated improved fed glucose levels (Figure 4B). On day-17 of PHZ treatment, βOGT−/y mice showed improved glucose tolerance that is not different than that of the control (Figure 4C). Comparing βOGT−/y mice with or without PHZ, the mice treated with PHZ were metabolically better (Figure 4D,E). However, PHZ treatment was insufficient to maintain glucose tolerance in βOGT−/y mice on day-25 treatment (Figure 4F). Although βOGT−/y mice treated with PHZ eventually developed glucose intolerance compared to control with PHZ, they remained metabolically better compared to βOGT−/y mice not treated with PHZ (Figure 4E). No differences in body weight, fed or fasting insulin levels were observed (Figure 4G–H). Despite the transient improvement in glucose tolerance, no restoration of β-cell mass was observed in β-cell mass in βOGT−/y mice treated with PHZ (Figure 4I). Interestingly, PHZ treatment restored β-cell proliferation and apoptosis in βOGT−/y mice to control levels (Figure 4J–K). Together these data suggest that PHZ intervention was beneficial in younger cohort of βOGT−/y mice and delayed the onset of diabetes. However, despite improving glucose levels and normalizing proliferation and apoptosis to control levels, PHZ did not restore β-cell mass in βOGT−/y mice. Thus, it may require an earlier intervention or longer PHZ treatment to observe a major impact on β-cell mass. It is also possible that PHZ treatment only reduces the stress on β-cells, improving both proliferation and survival, but not sufficient to rescue and/or restore β-cell mass.
Figure 4. Phloridzin, partially ameliorates the development of diabetes in mice lacking OGT in β-cells.

(A) Random glucose levels in βOGT−/y and control mice treated with Phloridzin (PHZ). (B) Comparison of random glucose levels in βOGT−/y mice treated with or without PHZ. (C–D) IPGTT was performed on day 17 of PHZ (C) or without treatment (D). (E) Quantification of area under curve (AUC) of D. (F) IPGTT was performed on day 25 of PHZ. (G–H) Random (G) and fasting (H) insulin levels taken on day 20 of PHZ treatment. (I–K) β-cell mass (I), proliferation (J, measured by KI67), and apoptosis (K, assessed by TUNEL staining) between βOGT−/y and control mice on day 27 of PHZ treatment. *P < 0.05 vs. βOGT−/y and control, n=5.
Down regulation of prosurvival Akt1/2 and Pdx-1 signaling and enhanced ER stress in young and normoglycemic mice lacking OGT in β-cells
To unravel the cause of β-cell dysfunction in mice with lacking OGT in β-cells, we focused our mechanistic studies on young and normoglycemic animal. The PI3K/Akt/Pdx-1 signaling is one of the major pathways regulating β-cell survival, both apoptosis, and ER stress (Sachdeva et al., 2009). Because Akt phosphorylation has been shown to be regulated by OGT, we assessed the phosphorylation status of prosurvival protein Akt1/2 at Ser 473 in islets from normoglycemic βOGT−/− mice. We found a reduction in phosphorylated Akt1/2 Ser 473 with increased changes in total Akt1/2 protein level (Figure 5A–B′). Total protein of Pdx-1, a critical transcription factor for insulin gene transcription and β-cell survival, were reduced in 7-week-old female βOGT−/− islets compared to control (Figure 5C, suggesting that Pdx-1 protein levels were altered in before the loss in β-cell mass.
Figure 5. Down regulation of prosurvival Akt1/2 and Pdx-1 signaling, and enhanced ER stress in young and normoglycemic mice lacking OGT in β-cells.

(A) Down regulation of prosurvival Akt1/2 at Ser 473 and Pdx-1 in islets of normoglycemic 8-week-old female βOGT−/− mice. (B–C) Quantification phosphorylated Akt1/2(Ser473)/Total Akt ½ (B), total Akt/tubulin (B′) and Pdx-1/tubulin (C). (D–G) ER stress markers protein expression in islets from normoglycemic 4-week-old βOGT−/y mice; BiP (D), Chop (E), phosphorylated eIF2α (F), and Caspase-12 (G) in islets of 4-week-old βOGT−/y mice. (H) Electron microscopy images of β-cell showing distended ER (arrow) and rounded mitochondria from 4-week-old βOGT−/y mice. *P < 0.05 vs. βOGT-KO and control, n=3. Scale bars are 200 μM (A) and 500 ηM(G).
Despite normal glucose tolerance and β-cell mass, 4-week-old βOGT−/y mice presented reduced insulin and elevated proinsulin circulating levels (Supplemental Figure 5A–C), suggesting alterations in ER function. Co-staining with ER marker Calnexin showed increased accumulation of proinsulin in the ER (Supplemental Figure 5D–E), supporting the notion that βOGT−/y mice have enhanced ER stress prior to development of glucose intolerance and β-cell failure. Elevated protein expression of ER stress marker BiP, chop and phosphorylated EIF2α (Figure 5E–G) were observed in islets from 4-week-old βOGT−/y mice. Increased caspase12, a specific mediator of ER stress-induced apoptosis (Yoneda et al., 2001) was evident in islets of βOGT−/y mice (Figure 5H). Increased BiP levels were also observed in female βOGT−/− islets (Supplemental Figure 5F). Furthermore, ER morphology by electron microscopy showed distended ER in islets from 4-week-old βOGT−/y mice and abnormalities in mitochondria morphology compared to control (Figure 5I). Together, these data suggest that ER stress is directly involved in the early deterioration of β-cells before the onset of glucose intolerance and hyperglycemia in mice lacking OGT.
Akt overexpression prevents hyperglycemia and improves glucose tolerance by normalizing β-cell mass in mice lacking OGT in β-cells
Prosurvival Akt signaling was reduced in islets of 8-week-old βOGT−/− mice, thus, we hypothesized that Akt overexpression in β-cells ameliorates the metabolic phenotype of mice lacking OGT. To directly assess the involvement of Akt, we generated transgenic mice overexpressing Akt (caAkt(Tg)) (Bernal-Mizrachi et al., 2001) with β-cell specific deletion of OGT (βOGT−/−;CaAkt(Tg)). The onset of hyperglycemia was prevented in βOGT−/− mice overexpressing Akt (βOGT−/−;CaAkt(Tg)) compared to βOGT−/− mice (Figure 6A). We observed increased fed and fasting insulin levels in the βOGT−/−/CaAkt(Tg) compared to βOGT−/− mice alone. As expected, Akt overexpressing mice show elevated fed and fasting insulin compared to wild type control (Figure 6B–C). As shown in previous cohorts, glucose intolerance was observed in 9-week-old βOGT−/− mice that worsen with age (Figure 6D). Mice lacking OGT in β-cells exhibited worse glucose intolerance at 22 weeks-old compared to βOGT−/−;CaAkt(Tg), suggesting that overexpression of Akt improved glucose tolerance in mice lacking OGT (Figure 6E). GSIS assessment in vivo suggest that βOGT−/−;CaAkt(Tg) have increased basal and stimulated insulin values compared to βOGT−/− mice (Figure 6F). β-cell mass in βOGT−/−;CaAkt(Tg) was significantly improved compared to βOGT−/− mice (Figure 6G). However, the increase in β-cell mass in βOGT−/−;CaAkt(Tg) was normalized to control and not to the CaAkt(Tg) level. We observed a robust increased in β-cell proliferation in βOGT−/−;CaAkt(Tg) compared to CaAkt(Tg) (Figure 6H). However, no differences in apoptosis (Figure 6I), and OGlcNAc levels were observed between islets from βOGT−/− and βOGT−/−;CaAkt(Tg) even in the presence of enhanced Akt signaling in βOGT−/−;CaAkt(Tg) as demonstrated by increased phosphoGSK3β (Ser9)(Supplemental Figure 6A and 6B). On the other hand, we observed partial rescue of ER stress demonstrated by enhanced proinsulin localization in the Golgi of βOGT−/−;CaAkt(Tg) islets compared to proinsulin staining in the ER of βOGT−/− islets (Supplemental Figure 7A). These data indicate that Akt is sufficient to prevent diabetes in βOGT−/− mice by modulating β-cell mass via proliferation and provide a mechanistic link between O-GlcNAcylation and β-cell survival by modulation of Akt signaling.
Figure 6. Akt overexpression prevents hyperglycemia and improves glucose tolerance in mice lacking OGT in β-cells.

(A–C) Random glucose (A), random insulin (B) and fasting insulin (C) levels in βOGT−/− mice with or without Akt overexpression (CaAkt(Tg)). (D–E) IPGTT was performed in 8 and 22-week-old βOGT−/− mice with (βOGT−/−;CaAkt(Tg)) or without the Akt transgene (CaAkt(Tg)). (F–H) In vivo GSIS (F), β-cell mass (G), β-cell proliferation (H, measured by KI67), and apoptosis (I, TUNEL) at 22-week-old βOGT−/− with or without CaAkt(Tg). *P < 0.05 and n=4.
Deletion of one chop allele improves hyperglycemia and β-cell mass in mice with conditional deletion of OGT in β-cells
Chronic unfolded protein response signaling leads to the commitment phase of ER stress-induced apoptosis, where C/EBP homologous protein (Chop) can trigger pro-apoptotic signals. Having demonstrated that islets from βOGT−/y exhibited increased ER stress, we tested the hypothesis that reduction of Chop in βOGT−/y ameliorates the alterations in glucose homeostasis and loss of β-cells. Indeed, deletion of one Chop allele in βOGT−/y (Chop+/−;βOGT−/y) was sufficient to lower glucose in βOGT−/y mice (Figure 7A). Six-week-old Chop+/−;βOGT−/y demonstrated improved glucose tolerance compared to Chop+/+;βOGT−/y (Figure 7B). Fed insulin levels were also improved in twelve-week-old Chop+/−;βOGT−/y compared to Chop+/+;βOGT−/y mice (Figure 7C), however, this level of insulin was not sufficient to normalize random blood glucose level. β-cell mass was preserved in Chop+/−;βOGT−/y compared to Chop+/+;βOGT−/y (Figure 7D), in part, by reduction of β-cell apoptosis (Figure 7E). These data suggest that ER stress plays a major role in the β-cell failure in mice lacking OGT in β-cells and provide a direct link between O-GlcNAcylation and β-cell survival by regulation of ER stress responses.
Figure 7. Deletion of one allele of chop improves hyperglycemia and β-cell mass in mice lacking OGT in β-cells.

(A) Random blood glucose levels taken at time points indicated. (B) IPGTT was performed in 6-week-old βOGT−/y mice expressing (Chop+/−;βOGT−/y) or without one allele of Chop (Chop+/−;βOGTx/y) or wild-type control (Chop+/+;βOGTx/y). (C) Blood insulin levels (C) taken on 12-week-old mice with the shown genotypes. (D) β-cell mass (D), and β-cell apoptosis (E, measured by TUNNEL) at 12 week-old βOGT−/y with or without one allele of Chop. *P < 0.05 and n=4.
Discussion
In the present study, we define the role of O-GlcNAcylation in β-cells using several genetically modified mice. We reveal that OGT is indispensable for controlling both insulin secretion and β-cell number. Independent of mass, OGT inherently regulates insulin secretion, partly due to alterations in calcium signaling and insulin content. In addition, we identified roles of OGT in proliferation and survival specifically through modulating Akt signaling and ER stress responses respectively. Reconstituting Akt signaling or deletion of one Chop allele to improve ER stress were sufficient to reduce hyperglycemia and glucose intolerance in βOGT−/− or βOGT−/y (βOGT-KO) mice. These findings suggest that impairment of O-GlcNAcylation leads to ER stress early in life and subsequently, deterioration of both β-cell mass and function. Together, these studies provide strong evidence of the mechanistic link between O-GlcNAcylation, ER stress and Akt signaling in regulation of pancreatic β-cell mass and function.
These studies identified the role of OGT at different stages of β-cell development. OGT is dispensable for β-cell development and the first 30 days of life as observed by normoglycemic and normal β-cell mass. However, young mice exhibited a defect in insulin secretion changes in Ca2+ signaling affecting the percentage of islets that oscillates and their profiles (amplitude, period, and plateau fraction) in response to glucose, which can all have major impact on insulin granule release. The mechanism mediating abnormalities in intracellular Ca2+ signaling are unclear but it is possible that O-GlcNAcylation of proteins involved in Ca2+ handling in β-cells such as VDAC, IP3 receptor, and SERCA could be involved as reported in cardiac tissue (Johnsen et al., 2013; Rengifo et al., 2007). Independent of calcium-mediated insulin secretion defect, young and normoglycemic mice lacking OGT presented lower insulin content, in part, by reduced Ins1, Ins2, NeuroD1, and Pdx-1 mRNA messages. In addition at Pdx-1 O-GlcNAcylation is important for binding to the insulin gene and insulin secretion in MIN6 cells (Gao et al., 2003). The abnormalities in insulin mRNA and content are similar to those observed in transgenic mice with β-cell specific overexpression of OGA (Soesanto et al., 2011). Conversely, the current evidence support the notion that enhanced O-GlcNAcylation potentiates insulin secretion (Tang et al., 2000; Zraika et al., 2002). Taken together, previous evidence suggested that O-GlcNAcylation regulates insulin content and secretion and our data identify an important role for O-GlcNAcylation on intracellular Ca2+ homeostasis. Furthermore, OGT could independently regulate cytoskeletal reorganization and proteins (i.e. synapsin I, Synaptotagmin) involved in insulin exocytosis (Cole and Hart, 1999; Fukuda, 2002).
While young mice lacking OGT in β-cells exhibited normal β-cell mass, adult mice demonstrated significant reduction in β-cell mass because of enhanced cell death and impaired proliferation. These phenotypes were partly explained by down-regulation of prosurvival Akt and Pdx-1 signaling. Akt signaling is important for β-cell mass affecting both proliferation and apoptosis rates (Bernal-Mizrachi et al., 2001). Islets from βOGT-KO mice demonstrated reduced Akt phosphorylation at Ser473 compared to control. The mechanisms underlying this effect are not clear but specific O-GlcNAcylation sites on Akt modulate Ser473 phosphorylation (Heath et al., 2014). Our data suggest that the interplay between OGT and Akt signaling is prosurvival in β-cells. Overexpression of Akt in βOGT-KO mice improved glucose tolerance and prevented the onset of frank diabetes by restoring β-cell mass in βOGT-KO mice suggesting that abnormalities in Akt signaling could be a major mechanism for the defects in β-cell mass. Interestingly, restoration of β-cell mass in βOGT−/−;Akt(Tg) occurs mainly via proliferation and not survival. A potential role for Akt on rescuing apoptosis in βOGT-deficient cells cannot be ruled out as previous data have shown that Akt overexpressing mice exhibit a high β-cell turnover with enhanced apoptosis and proliferation (Bernal-Mizrachi et al., 2001). It is still possible that lower levels of Akt activation could improve survival in βOGT-deficient cells and that can be tested in in vitro experiments. Finally, the cross talk between Akt and OGT signaling appears more complex as shown by the reduction of β-cell mass in βOGT−/−;Akt(Tg) compared to OGTx/x;Akt(Tg). These results suggest that reduction of OGT signaling could modulate biological process regulating proliferation downstream of Akt signaling.
Unlike adult mice lacking OGT since embryonic day 13.5, ablating OGT in mature β-cells does not cause diabetes, but instead, glucose intolerance due to insulin secretion defect and not mass. Thus, OGT could play a protective role in states of chronic hyperglycemia and glucotoxicity and thereby regulating β-cell mass and function. OGT modulates O-GlcNAcylation of proteins according to glucose level availability. Hyperglycemia increases glucose flux through HBP, as such enhancing OGT activity and O-GlcNAcylation. Non-physiological levels of glucosamine promote β-cell dysfunction upon chronic exposure to hyperglycemia (Kaneto et al., 2001). In the present study, mice lacking OGT appears to be more sensitive to glucotoxic condition because PHZ treatment delayed the onset of diabetes and normalized proliferation and apoptosis rate in βOGT-/y mice to that of control levels. The mechanism for the beneficial effect of PHZ is unclear, but reduction in ER stress load may contribute to this processes. In hyperglycemic states, OGT could also lessen glucose toxicity by increasing O-GlcNAcylation output, thereby reducing the amount of glucosamine and O-GlcNAc in the milieu. OGT can independently modulate proteins (i.e. CamKIV, Pdx-1, and MafA) that regulates β-cell failure in glucotoxic conditions (Copeland et al., 2008; Gao et al., 2003; Song et al., 2008b; Sugiyama et al., 2011; Vanderford et al., 2007). Under low glucose levels, MafA and Pdx-1 are localized in the cytoplasm and are transported to the nucleus after high-glucose-induced O-GlcNAcylation. Glucotoxic conditions greatly diminishes protein levels of MafA and Pdx-1 (Robertson, 2004); Although the mechanisms are elusive, the process is thought to first involve the exclusion of these proteins from the nucleus and then disappearance from the cytoplasm. Therefore, it is possible that OGT-deficient β-cells in glucotoxic conditions potentiates the exclusion of these proteins from the nucleus.
Our findings identified a role of O-GlcNAcylation by OGT in ER stress responses in β-cell. As mice lacking OGT age, significant β-cell mass loss ensues due to ER stress-induced apoptosis. Although young and normoglycemic mice initially demonstrated normal β-cell mass, ER stress markers are increased in islets of βOGT-KO mice. Interestingly, reducing ER stress by deleting one allele of Chop was sufficient to reduce hyperglycemia, improve glucose tolerance, and restore β-cell mass in Chop+/-;βOGT−/y compared to Chop+/+;βOGT−/y mice. Although insulin level was comparable between Chop+/−;βOGT−/y mice and controls (Chop+/−;OGTx/y or Chop+/+;OGTx/y) it was not sufficient to normalize random blood glucose level and it is possible that complete deletion of Chop could result in a complete rescue of β-cell function (Song et al., 2008a). It is of high interest in the future to identify which protein(s) involve in the unfolded protein response are regulated by OGT. Remarkably, Jang et al just reported that eukaryotic translation initiation factor 2α (eIF2α), a major branch of the UPR, is O-GlcNAcylated at Ser 219, Thr 239, and Thr 241, which leads to reduced phosphorylation of eIF2α at Ser 51 and ER stress-induced Chop activation in liver tissue (Jang et al., 2015). Thus, OGT could regulate ER stress by modulating function of genes involved in UPR as shown in Hek293 cells, COS-7 and neonatal rat ventricular myocytes (Ferrer et al., 2014; Jang et al., 2015) as well as ER homeostasis by regulating proteins involved in calcium handling as demonstrated in the heart tissue (Johnsen et al., 2013; Rengifo et al., 2007). Although the exact mechanisms contributing to ER stress in βOGT-KO mice are not fully mapped out, it is possible that loss of OGT in β-cells alters ER homeostasis by directly affecting calcium channels or in conjunction with alteration in UPR proteins responses. The prosurvival effects of OGT on ER stress response observed in βOGT-KO mice supports earlier studies by other groups. Using C. elegans model, Denzel et al showed that HBP metabolites enhance protein quality control (Denzel et al., 2014). In the heart and breast cancer cell lines, OGT signaling has been shown to prevent ER stress (Ngoh et al., 2009)(Ferrer et al., 2014). Together, the present study supports these findings and extends the setting in vivo and provides a mechanism in glucose-sensitive and ER-stress prone β-cells.
In summary, our data propose OGT as a prosurvival nutrient sensor, modulating proximal insulin signaling and targeting specific downstream pathways to elicit diverse physiological responses and fine-tuning mechanisms governing β-cell mass and function. As a highly expressed nutrient sensor in β-cells, OGT is poised to regulate cell proliferation, survival and function. The coordinated actions of OGT, the enzyme that rivals hundreds of kinases involved in phosphorylation protein modification, at multi-levels to regulate intracellular signaling pathways in response to nutrient changes in β-cells are just beginning to unravel, and significant advances in our understanding of OGT action underscore the contribution of O-GlcNAcylation in ER stress, Akt signaling, and the etiology of type 2 diabetes.
Experimental Procedures
Generation of O-linked GlcNAc transferase knockout mice
To generate mice with conditional OGT deletion in β-cells (herein referred to as male βOGT−/y (RIPCre-OGTflox/y) or female βOGT−/− (RIPCre-OGTflox/flox) we crossed the following breeders: Female OGTflox/flox and male mice harboring one allele of Cre-recombinase under the rat insulin 2 promoter (RIPCre) (Supplemental Figure 1C, RIPCre, provided by Dr. Pedro Herrera, University of Geneva Faculty of Medicine, Geneva, Switzerland) or the inducible mouse insulin promoter (MIPCre-ERTM, Dr. Louis H. Philipson, University of Chicago, Chicago, IL). Homozygous female βOGT−/− was generated by breeding female OGTflox/flox and male RIPCre-OGTflox/y. Littermate offspring with or without the RIP or MIPCre transgene were analyzed. Schematic diagram of breeding is shown in Supplemental Figure 1A. C57BL/6, OGTflox/flox, and Chop−/+ animals were purchased from Jackson Laboratory. The generation of Akt transgenic mice (caAkt(Tg)) was previously described (Bernal-Mizrachi et al., 2001). All procedures were performed in accordance with the University of Michigan Animal Studies Committee.
Islet Isolation
Primary mouse islets from young and normoglycemic male βOGT−/y or female βOGT−/− mice were isolated using collagenase (1mg/mL, Roche Applied Science) and hand picked after filtration with a 70 μm cell strainer (BD Falcon) as described previously (Alejandro et al., 2014b).
Western blotting
Immunoblotting was performed as described previously (Alejandro et al., 2014b). Briefly, islet cells were washed after treatments with PBS before adding cell lysis buffer (Cell Signaling) with protease inhibitor cocktail and phoshopStop tablets (Roche Applied Science). Primary antibodies against OGT, O-GlcNAc and Vinculin were from Abcam. Pdx-1 antibody was purchased from Millipore. Phosphorylated S6 (Ser 240), GSK3β (Ser9), and Akt (Ser473, Thr308) and total Akt antibodies were from Cell Signaling. Antibodies against β-actin and tubulin were from Sigma and Chop was from Santa Cruz. Caspase-12 was from Bioscience. Pro-insulin antibody is from ALPCO. Bip antibody was generated by Dr. Arvan’s laboratory.
β-cell mass, proliferation, and TUNEL analysis
Formalin-fixed pancreas tissues were embedded into paraffin. Sections were deparaffinized, rehydrated, and incubated with blocking solution as previously described (Bernal-Mizrachi et al., 2001). Sections were incubated overnight at 4ºC with antibodies against insulin (Dako), OGT (Abcam), followed by secondary antibodies conjugated to FITC and Cy3 (Jackson Immunoresearch). DAPI-containing mounting media (Vector Laboratories) was added to cover slips. β-cell mass analysis entails assessing total pancreas and insulin-positive cell areas from five insulin-stained sections (5 μm) separated 200 μm were measured by using Image Pro Software (Media Cybernetics). β-cell mass (average β-cell fraction multiplied by pancreas weight) assessment was performed using Surveyor Software (Objective Imaging) automated scanning with a Leica fluorescent microscope (Leica Microsystems). Cell proliferation and apoptosis were analyzed using co-staining of Ki67 or TUNEL with insulin on tissue sections of control and knockout mice. At least ~3000 stained cells were counted from each animal.
Mouse pancreas confocal imaging and proinsulin analysis
Pancreata from 4-week-old male βOGT−/y and control were prepared as mentioned above, but deparaffinized and stained as previously described (Haataja et al., 2013; Wright et al., 2013). For quantification of wild type proinsulin localization, sections were immunostained with anti-proinsulin (ALPCO), anti-calnexin, anti-insulin antibodies, and a blinded reader scored the localization of proinsulin in β-cells as either a predominant juxtanuclear crescent of increased intensity (Golgi) or mainly diffused and colocalized with calnexin (ER) (Wright et al., 2013). An average of 715 insulin-positive β-cells (~6 islets) were analyzed per genotype.
Glucose and insulin tolerance tests
Fasting glucose levels were measured after an overnight fasting. Glucose tolerance tests were performed by intraperitoneal delivery of 2g/kg glucose to mice after 12 hours of fasting. Insulin tolerance test was done with 0.75Unit/kg insulin (Humalog, Eli Lilly) to mice after six-hour fasting. Blood glucose was monitored for two hours after glucose or insulin injection. Plasma insulin levels were measured using ultra-sensitive mouse insulin ELISA kit (ALPCO).
Measurement of intracellular Ca2+
Isolated islets were allowed to recover overnight from islet isolation prior to measurement of intracellular Ca2+. Islets were preloaded with 2.5 μM Fura2-AM (Molecular Probes) in 0.1% DMSO for 30 min at 37°C and washed for 10 minutes before recording. The recording solution contained, in mM: 145 NaCl, 5 KCl, 1.2 MgCl2, 2.6 CaCl2, 10 HEPES, and glucose as indicated; pH 7.4. Ca2+ is reported as the ratio of alternative excitation at 340 nm/380 nm, with emission measured at 510 nm (Merrins et al., 2013).
Phloridzin transplantation studies
We utilized ALZET Osmotic Pumps (Model 2006, pump flow rate=0.15ul/hr, Cupertino, CA) to continuously deliver a dose of 0.8 mg/Kg/day (~5ug/μl) of Phloridzin (Sigma) for 25 days in two cohorts of βOGT−/− and littermates control: Cohort 1 was 70-day-old mice with an average body weight of 25.0 g. Cohort 2 was 50-day-old with an average weight of 20.5 g. Mice were anesthetized with intraperitoneal injection of ketamine (100 mg/kg body weight) and xylazine (10 mg/kg body weight) and ALZET pumps were implanted subcutaneously to all mice. Mice were fully recuperated from the surgery before the in vivo experiments were performed.
Transmission electron microscopy
Philips CM-100 electron microscope at 60 kV was utilized to examine ultra-thin sections (70 nm) of isolated islets fixed with 2.5% glutaraldehyde in 0.1 M Sorensen buffer, post-fixed in OsO4 and stained with 3% uranyl acetate. Megaplus camera system was operated using AMT software (Advanced Microscopy Techniques Corp.).
Statistical analysis
Data are presented as mean ± SEM. Data was analyzed using non-parametric Mann-Whitney tests (u-test) using GraphPad Prism version 6 (GraphPad Software, Inc. La Jolla, CA). Results were considered statistically significant when the p value was less than 0.05.
Supplementary Material
Acknowledgments
This work was supported by National Institutes of Health Grant RO1 DK084236 and DK073716 (to E.B-M.) and RO1 DK46409 (to L.S.S.). E.U.A was supported by a Post-Doctoral Fellowship from The Hartwell Foundation and by a Career Development Award from NIDDK (K01-DK-103823). N.B was supported by the NIH Cellular and Molecular Biology Training Grant T32GM007315. The authors acknowledge support from the Morphology and Image Analysis Core, Metabolomics Core, and Phenotyping Core from the Michigan Diabetes Research Center (P30 DK020572). We thank Drs. Lynda Elghazi and Corentin Cras-Meneur for contribution in the discussion. We thank Ms. Lauren See for her assistance with islet isolation. We thank Mr. Ronald Mark Ygona for illustrating the graphical abstract.
Footnotes
Contribution statement
E.U.A. conceived of, designed and performed experiments, analyzed data and interpreted results, and wrote and edited the manuscript. N.B., S.A., D.K., H.L., and S.V., performed experiments and analyzed data. L.E., L.S. and P.A. contributed to discussions. E.B-M conceived of the project, interpreted results, reviewed and edited the manuscript.
Publisher's Disclaimer: This is a PDF file of an unedited manuscript that has been accepted for publication. As a service to our customers we are providing this early version of the manuscript. The manuscript will undergo copyediting, typesetting, and review of the resulting proof before it is published in its final citable form. Please note that during the production process errors may be discovered which could affect the content, and all legal disclaimers that apply to the journal pertain.
References
- Alejandro EU, Gregg B, Blandino-Rosano M, Cras-Meneur C, Bernal-Mizrachi E. Natural history of beta-cell adaptation and failure in type 2 diabetes. Mol Aspects Med. 2014a doi: 10.1016/j.mam.2014.12.002. [DOI] [PMC free article] [PubMed] [Google Scholar]
- Alejandro EU, Gregg B, Wallen T, Kumusoglu D, Meister D, Chen A, Merrins MJ, Satin LS, Liu M, Arvan P, et al. Maternal diet-induced microRNAs and mTOR underlie beta cell dysfunction in offspring. J Clin Invest. 2014b doi: 10.1172/JCI74237. [DOI] [PMC free article] [PubMed] [Google Scholar]
- Andrali SS, Qian Q, Ozcan S. Glucose mediates the translocation of NeuroD1 by O-linked glycosylation. The Journal of biological chemistry. 2007;282:15589–15596. doi: 10.1074/jbc.M701762200. [DOI] [PMC free article] [PubMed] [Google Scholar]
- Bernal-Mizrachi E, Wen W, Stahlhut S, Welling CM, Permutt MA. Islet beta cell expression of constitutively active Akt1/PKB alpha induces striking hypertrophy, hyperplasia, and hyperinsulinemia. J Clin Invest. 2001;108:1631–1638. doi: 10.1172/JCI13785. [DOI] [PMC free article] [PubMed] [Google Scholar]
- Cole RN, Hart GW. Glycosylation sites flank phosphorylation sites on synapsin I: O-linked N-acetylglucosamine residues are localized within domains mediating synapsin I interactions. J Neurochem. 1999;73:418–428. doi: 10.1046/j.1471-4159.1999.0730418.x. [DOI] [PubMed] [Google Scholar]
- Copeland RJ, Bullen JW, Hart GW. Cross-talk between GlcNAcylation and phosphorylation: roles in insulin resistance and glucose toxicity. Am J Physiol Endocrinol Metab. 2008;295:E17–28. doi: 10.1152/ajpendo.90281.2008. [DOI] [PMC free article] [PubMed] [Google Scholar]
- Denzel MS, Storm NJ, Gutschmidt A, Baddi R, Hinze Y, Jarosch E, Sommer T, Hoppe T, Antebi A. Hexosamine pathway metabolites enhance protein quality control and prolong life. Cell. 2014;156:1167–1178. doi: 10.1016/j.cell.2014.01.061. [DOI] [PubMed] [Google Scholar]
- Dor Y, Brown J, Martinez OI, Melton DA. Adult pancreatic beta-cells are formed by self-duplication rather than stem-cell differentiation. Nature. 2004;429:41–46. doi: 10.1038/nature02520. [DOI] [PubMed] [Google Scholar]
- Ehrenkranz JR, Lewis NG, Kahn CR, Roth J. Phlorizin: a review. Diabetes/metabolism research and reviews. 2005;21:31–38. doi: 10.1002/dmrr.532. [DOI] [PubMed] [Google Scholar]
- Eizirik DL, Cardozo AK, Cnop M. The role for endoplasmic reticulum stress in diabetes mellitus. Endocr Rev. 2008;29:42–61. doi: 10.1210/er.2007-0015. [DOI] [PubMed] [Google Scholar]
- Ferrannini E. The stunned beta cell: a brief history. Cell Metab. 2010;11:349–352. doi: 10.1016/j.cmet.2010.04.009. [DOI] [PubMed] [Google Scholar]
- Ferrer CM, Lynch TP, Sodi VL, Falcone JN, Schwab LP, Peacock DL, Vocadlo DJ, Seagroves TN, Reginato MJ. O-GlcNAcylation regulates cancer metabolism and survival stress signaling via regulation of the HIF-1 pathway. Molecular cell. 2014;54:820–831. doi: 10.1016/j.molcel.2014.04.026. [DOI] [PMC free article] [PubMed] [Google Scholar]
- Filhoulaud G, Guillemain G, Scharfmann R. The hexosamine biosynthesis pathway is essential for pancreatic beta cell development. The Journal of biological chemistry. 2009;284:24583–24594. doi: 10.1074/jbc.M109.025288. [DOI] [PMC free article] [PubMed] [Google Scholar]
- Fukuda M. Vesicle-associated membrane protein-2/synaptobrevin binding to synaptotagmin I promotes O-glycosylation of synaptotagmin I. The Journal of biological chemistry. 2002;277:30351–30358. doi: 10.1074/jbc.M204056200. [DOI] [PubMed] [Google Scholar]
- Gao Y, Miyazaki J, Hart GW. The transcription factor PDX-1 is post-translationally modified by O-linked N-acetylglucosamine and this modification is correlated with its DNA binding activity and insulin secretion in min6 beta-cells. Archives of biochemistry and biophysics. 2003;415:155–163. doi: 10.1016/s0003-9861(03)00234-0. [DOI] [PubMed] [Google Scholar]
- Haataja L, Snapp E, Wright J, Liu M, Hardy AB, Wheeler MB, Markwardt ML, Rizzo M, Arvan P. Proinsulin intermolecular interactions during secretory trafficking in pancreatic beta cells. The Journal of biological chemistry. 2013;288:1896–1906. doi: 10.1074/jbc.M112.420018. [DOI] [PMC free article] [PubMed] [Google Scholar]
- Heath JM, Sun Y, Yuan K, Bradley WE, Litovsky S, Dell’Italia LJ, Chatham JC, Wu H, Chen Y. Activation of AKT by O-linked N-acetylglucosamine induces vascular calcification in diabetes mellitus. Circulation research. 2014;114:1094–1102. doi: 10.1161/CIRCRESAHA.114.302968. [DOI] [PMC free article] [PubMed] [Google Scholar]
- Herrera PL. Adult insulin- and glucagon-producing cells differentiate from two independent cell lineages. Development. 2000;127:2317–2322. doi: 10.1242/dev.127.11.2317. [DOI] [PubMed] [Google Scholar]
- Jang I, Kim HB, Seo H, Kim JY, Choi H, Yoo JS, Kim JW, Cho JW. O-GlcNAcylation of eIF2alpha regulates the phospho-eIF2alpha-mediated ER stress response. Biochimica et biophysica acta. 2015;1853:1860–1869. doi: 10.1016/j.bbamcr.2015.04.017. [DOI] [PubMed] [Google Scholar]
- Johnsen VL, Belke DD, Hughey CC, Hittel DS, Hepple RT, Koch LG, Britton SL, Shearer J. Enhanced cardiac protein glycosylation (O-GlcNAc) of selected mitochondrial proteins in rats artificially selected for low running capacity. Physiological genomics. 2013;45:17–25. doi: 10.1152/physiolgenomics.00111.2012. [DOI] [PMC free article] [PubMed] [Google Scholar]
- Kaneto H, Xu G, Song KH, Suzuma K, Bonner-Weir S, Sharma A, Weir GC. Activation of the hexosamine pathway leads to deterioration of pancreatic beta-cell function through the induction of oxidative stress. The Journal of biological chemistry. 2001;276:31099–31104. doi: 10.1074/jbc.M104115200. [DOI] [PubMed] [Google Scholar]
- Lehman DM, Fu DJ, Freeman AB, Hunt KJ, Leach RJ, Johnson-Pais T, Hamlington J, Dyer TD, Arya R, Abboud H, et al. A single nucleotide polymorphism in MGEA5 encoding O-GlcNAc-selective N-acetyl-beta-D glucosaminidase is associated with type 2 diabetes in Mexican Americans. Diabetes. 2005;54:1214–1221. doi: 10.2337/diabetes.54.4.1214. [DOI] [PubMed] [Google Scholar]
- Marchetti P, Lupi R, Del Guerra S, Bugliani M, Marselli L, Boggi U. The beta-cell in human type 2 diabetes. Adv Exp Med Biol. 2010;654:501–514. doi: 10.1007/978-90-481-3271-3_22. [DOI] [PubMed] [Google Scholar]
- Merrins MJ, Van Dyke AR, Mapp AK, Rizzo MA, Satin LS. Direct Measurements of Oscillatory Glycolysis in Pancreatic Islet beta-cells using Novel Fluorescence Resonance Energy Transfer(FRET) Biosensors for Pyruvate Kinase M2 Activity. The Journal of biological chemistry. 2013 doi: 10.1074/jbc.M113.508127. [DOI] [PMC free article] [PubMed] [Google Scholar]
- Ngoh GA, Hamid T, Prabhu SD, Jones SP. O-GlcNAc signaling attenuates ER stress-induced cardiomyocyte death. Am J Physiol Heart Circ Physiol. 2009;297:H1711–1719. doi: 10.1152/ajpheart.00553.2009. [DOI] [PMC free article] [PubMed] [Google Scholar]
- Rengifo J, Gibson CJ, Winkler E, Collin T, Ehrlich BE. Regulation of the inositol 1,4,5-trisphosphate receptor type I by O-GlcNAc glycosylation. The Journal of neuroscience : the official journal of the Society for Neuroscience. 2007;27:13813–13821. doi: 10.1523/JNEUROSCI.2069-07.2007. [DOI] [PMC free article] [PubMed] [Google Scholar]
- Robertson RP. Chronic oxidative stress as a central mechanism for glucose toxicity in pancreatic islet beta cells in diabetes. The Journal of biological chemistry. 2004;279:42351–42354. doi: 10.1074/jbc.R400019200. [DOI] [PubMed] [Google Scholar]
- Sachdeva MM, Claiborn KC, Khoo C, Yang J, Groff DN, Mirmira RG, Stoffers DA. Pdx1 (MODY4) regulates pancreatic beta cell susceptibility to ER stress. Proc Natl Acad Sci U S A. 2009;106:19090–19095. doi: 10.1073/pnas.0904849106. [DOI] [PMC free article] [PubMed] [Google Scholar]
- Shafi R, Iyer SP, Ellies LG, O’Donnell N, Marek KW, Chui D, Hart GW, Marth JD. The O-GlcNAc transferase gene resides on the X chromosome and is essential for embryonic stem cell viability and mouse ontogeny. Proceedings of the National Academy of Sciences of the United States of America. 2000;97:5735–5739. doi: 10.1073/pnas.100471497. [DOI] [PMC free article] [PubMed] [Google Scholar]
- Soesanto Y, Luo B, Parker G, Jones D, Cooksey RC, McClain DA. Pleiotropic and age-dependent effects of decreased protein modification by O-linked N-acetylglucosamine on pancreatic beta-cell function and vascularization. The Journal of biological chemistry. 2011;286:26118–26126. doi: 10.1074/jbc.M111.249508. [DOI] [PMC free article] [PubMed] [Google Scholar]
- Song B, Scheuner D, Ron D, Pennathur S, Kaufman RJ. Chop deletion reduces oxidative stress, improves beta cell function, and promotes cell survival in multiple mouse models of diabetes. J Clin Invest. 2008a;118:3378–3389. doi: 10.1172/JCI34587. [DOI] [PMC free article] [PubMed] [Google Scholar]
- Song M, Kim HS, Park JM, Kim SH, Kim IH, Ryu SH, Suh PG. o-GlcNAc transferase is activated by CaMKIV-dependent phosphorylation under potassium chloride-induced depolarization in NG-108–15 cells. Cell Signal. 2008b;20:94–104. doi: 10.1016/j.cellsig.2007.09.002. [DOI] [PubMed] [Google Scholar]
- Sugiyama Y, Murao K, Imachi H, Sueyoshi N, Ishida T, Kameshita I. Calcium/calmodulin-dependent protein kinase IV involvement in the pathophysiology of glucotoxicity in rat pancreatic beta-cells. Metabolism. 2011;60:145–153. doi: 10.1016/j.metabol.2010.03.015. [DOI] [PubMed] [Google Scholar]
- Tang J, Neidigh JL, Cooksey RC, McClain DA. Transgenic mice with increased hexosamine flux specifically targeted to beta-cells exhibit hyperinsulinemia and peripheral insulin resistance. Diabetes. 2000;49:1492–1499. doi: 10.2337/diabetes.49.9.1492. [DOI] [PubMed] [Google Scholar]
- Teta M, Rankin MM, Long SY, Stein GM, Kushner JA. Growth and regeneration of adult beta cells does not involve specialized progenitors. Dev Cell. 2007;12:817–826. doi: 10.1016/j.devcel.2007.04.011. [DOI] [PubMed] [Google Scholar]
- Vanderford NL, Andrali SS, Ozcan S. Glucose induces MafA expression in pancreatic beta cell lines via the hexosamine biosynthetic pathway. The Journal of biological chemistry. 2007;282:1577–1584. doi: 10.1074/jbc.M605064200. [DOI] [PMC free article] [PubMed] [Google Scholar]
- Wright J, Wang X, Haataja L, Kellogg AP, Lee J, Liu M, Arvan P. Dominant protein interactions that influence the pathogenesis of conformational diseases. J Clin Invest. 2013;123:3124–3134. doi: 10.1172/JCI67260. [DOI] [PMC free article] [PubMed] [Google Scholar]
- Yang X, Ongusaha PP, Miles PD, Havstad JC, Zhang F, So WV, Kudlow JE, Michell RH, Olefsky JM, Field SJ, et al. Phosphoinositide signalling links O-GlcNAc transferase to insulin resistance. Nature. 2008;451:964–969. doi: 10.1038/nature06668. [DOI] [PubMed] [Google Scholar]
- Yoneda T, Imaizumi K, Oono K, Yui D, Gomi F, Katayama T, Tohyama M. Activation of caspase-12, an endoplastic reticulum (ER) resident caspase, through tumor necrosis factor receptor-associated factor 2-dependent mechanism in response to the ER stress. The Journal of biological chemistry. 2001;276:13935–13940. doi: 10.1074/jbc.M010677200. [DOI] [PubMed] [Google Scholar]
- Zraika S, Dunlop M, Proietto J, Andrikopoulos S. The hexosamine biosynthesis pathway regulates insulin secretion via protein glycosylation in mouse islets. Archives of biochemistry and biophysics. 2002;405:275–279. doi: 10.1016/s0003-9861(02)00397-1. [DOI] [PubMed] [Google Scholar]
Associated Data
This section collects any data citations, data availability statements, or supplementary materials included in this article.