Abstract
Fasting hyperglycemia occurs when an excessive rate of endogenous glucose production (EGP) is not accompanied by an adequate compensatory increase in the rate of glucose disappearance (Rd). The situation following food ingestion is more complex as the amount of glucose that reaches the circulation for disposal is a function of the systemic rate of appearance of the ingested glucose (referred to as the rate of meal appearance [Rameal]), the pattern and degree of suppression of EGP, and the rapidity of stimulation of the Rd. In an effort to measure these processes, Steele et al. proposed what has come to be referred to as the dual-tracer method in which the ingested glucose is labeled with one tracer while a second tracer is infused intravenously at a constant rate. Unfortunately, subsequent studies have shown that although this approach is technically simple, the marked changes in plasma specific activity or the tracer-to-tracee ratio, if stable tracers are used, introduce a substantial error in the calculation of Rameal, EGP, and Rd, thereby leading to incorrect and at times misleading results. This Perspective discusses the causes of these so-called “nonsteady-state” errors and how they can be avoided by the use of the triple-tracer approach.
Why Is It Important to Accurately Measure Postprandial Glucose Turnover?
The long-term goal in the treatment of people with diabetes is to enable them to live long, productive, and enjoyable lives free of the acute and chronic complications of diabetes. To do so, the premise is that both the pattern of metabolism and the concentration of glucose, fat, amino acids, and other substrates and hormones need to be maintained as close to normal as possible. Diabetes is characterized by fasting and postprandial hyperglycemia (1). Both become progressively more severe as the disease evolves. Glucose concentrations are determined by the balance between the amount of glucose entering and leaving the systemic circulation. Following an overnight fast, glucose is released into the systemic circulation primarily by the liver with a smaller contribution coming from the kidneys and perhaps the intestine. Glucose leaves the systemic circulation by insulin-dependent uptake in tissues such as muscle and insulin-independent uptake in tissues such as the brain.
The situation becomes more complex following food ingestion. Carbohydrate contained in a meal is absorbed by the intestine into the portal vein. A portion of the absorbed glucose is extracted by the liver (and perhaps intestines) and stored as glycogen via direct or indirect pathways or is degraded to three carbon precursors. The remainder transverses the liver and enters the systemic circulation (referred to in this Perspective as the rate of meal glucose appearance [Rameal]). In people without diabetes, the increase in glucose is accompanied by a rapid increase in insulin and suppression of glucagon secretion (1). However, insulin secretion is decreased and delayed and glucagon does not suppress appropriately in people with type 2 diabetes. The coordinated changes in glucose, insulin, and glucagon in individuals without diabetes result in a prompt reduction in endogenous glucose production (EGP), thereby further decreasing the total amount of glucose that reaches the systemic circulation (referred to as the rate of glucose appearance [Ra]) for disposal (referred to as rate of glucose disappearance [Rd]). Therefore, coordinated changes in the Rameal, EGP, and glucose disposal limit the postprandial glycemic excursion in people without diabetes. In contrast, the lack of appropriate regulation of these fluxes causes postprandial hyperglycemia in people with diabetes. Understanding how therapies, used either alone or in combination, for the treatment of people with diabetes affect these parameters presumably will enhance both their safety and effectiveness.
Why Is Measurement of Ra, Rameal, EGP, and Rd Difficult in the Postprandial State?
Following an overnight fast, the rate of glucose entering the circulation equals the rate of glucose leaving the circulation and therefore the system is at steady state. Under these conditions, glucose turnover readily can be estimated by infusing a glucose tracer at a constant rate (inf) and then measuring the specific activity (when using a radioactive tracer) or the tracer-to-tracee ratio (ttr) derivable from the enrichment when stable isotopes are used (2). For simplicity's sake, we will use ttr throughout this Perspective; however, the same principles apply when specific activity is used to calculate turnover. At steady state, Ra = Rd = inf/ttr. Following food ingestion, the estimation of Ra and Rd becomes difficult because they are no longer equal and both are changing over time, resulting in tracer/tracee nonsteady state. In addition, Ra now equals the sum of Rameal and EGP, which also are changing with time in a discordant manner.
The presence of rapid changes in the plasma ttr necessitates the postulation of a structural model of the glucose system capable of describing how the system functions under nonsteady-state conditions. This includes specifying which parameters are time-varying as well as how they change during the nonsteady state. The usual approach is to start by trying to obtain an accurate estimate of Ra(t) (i.e., Ra at a given time point) and then using the mass balance equation (i.e., the change in glucose mass equals Ra minus Rd) to calculate Rd(t). In addition, the model (and the experimental conditions, as will be discussed in the following section) also has to enable the partition of Ra(t) into Rameal(t) and EGP(t). Moreover, in the absence of tracer/tracee steady state, results are highly dependent on the model assumed (see next section). Therefore, different models yield different estimates of Ra(t), Rd(t), Rameal(t), and EGP(t). In theory, the accuracy of the estimate of these parameters can be improved by postulating increasingly complex models (e.g., those that account for differences in the rates of equilibration of glucose and onset of action of insulin in the liver, muscle, and various other tissues in people with or without diabetes). However, the increased complexity of the model has to be balanced against increased difficulty in accurately identifying model parameters. Maintenance of tracer/tracee steady state by an appropriate tracer experiment design enables model-independent measurement of Ra(t), Rameal(t), EGP(t), and Rd(t), thereby avoiding these problems.
What Nonsteady-State Models Have Been Used to Measure Postprandial Glucose Turnover?
Steele’s One-Compartment Nonsteady-State Model
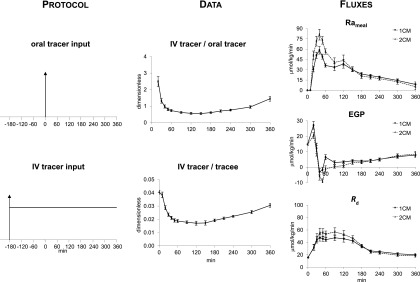
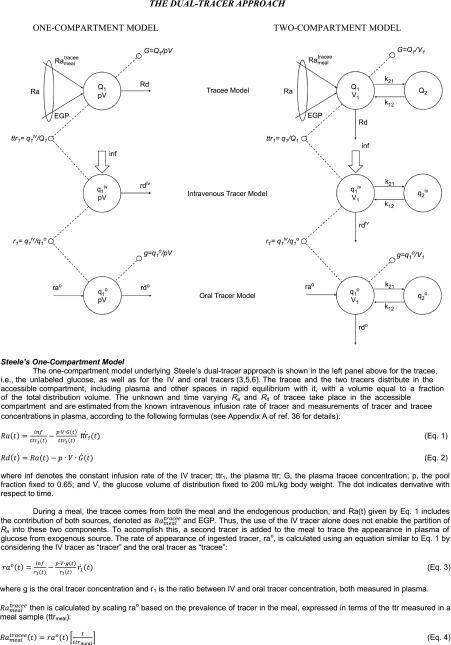
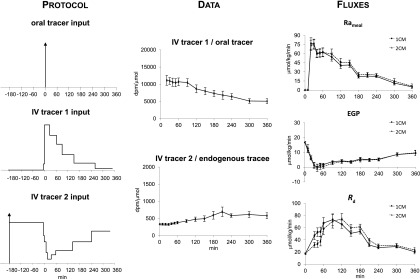
Steele et al. (3) pioneered the use of tracers to assess the pattern of postprandial glucose turnover. They did so by infusing glucose labeled with [U-14C6]glucose into the duodenum of dogs along with an intravenous infusion of [6-14C]glucose to trace the systemic Ra of both the unlabeled glucose and the intraduodenally infused [U-14C6]glucose. They then divided the Ra of [U-14C6]glucose by the specific activity of the intraduodenally infused glucose to determine Rameal in mg/kg/min. The authors calculated EGP by subtracting Rameal from Ra and calculated Rd by subtracting the change in glucose mass over a given time interval from Ra. Figure 1 shows the typical change in plasma ttr that occurs when this experimental approach is used in humans (4). In the experiments shown in Fig. 1, [1-13C]glucose was ingested at time 0 and [6,6-2H2]glucose was infused intravenously (IV tracer) at a constant rate beginning at −180 min. The vertical arrow in the top left panel of Fig. 1 indicates meal ingestion, and the vertical arrow and horizontal line in the bottom left panel of Fig. 1 indicate the prime continuous infusion of the systemic tracer. As is evident, there is a large fall in both the IV tracer–to–oral tracee ratio (used to calculate Rameal) and the IV ttr (used to calculate Ra) during the first 60–90 min, followed by a gradual rise thereafter. Steele et al. (5) astutely realized that specific activity measured in the plasma does not represent that present in the liver, interstitial fluid, and other compartments. They explored several ways to circumvent this problem, including the use of a nonhomogenous compartment model. For the sake of simplicity, they settled on the nonhomogenous single one-compartment model labeled as tracee model (Fig. 3). They did so because “it becomes necessary to make such an arbitrary selection when it is desired to calculate from the data in which rapid changes in plasma glucose concentration or specific activity are taking place as for example after insulin injection. We have chosen a value one half of the total glucose pool for this purpose…” (6). Over the succeeding years, the rapidly equilibrating pool has been expressed as pV (commonly referred to as the “effective” volume), where p is the correction factor and V is the total body volume of distribution of glucose. The size of p has been debated and, even more problematically, has been shown to change over time and to be dependent on the prevailing insulin concentration (7,8).
Figure 1.
The dual-tracer approach was used in eight healthy subjects. The ttrs (dimensionless) are shown in the middle panels and the Rameal, EGP, and Rd are shown in the left panels. Rates were calculated using either Steele’s one-compartment model (1CM) (3,5,6) or Radziuk’s two-compartment model (2CM) (10) following the ingestion of a mixed meal containing [1-13C]glucose (oral tracer) at time 0 (arrow). An intravenous infusion of [6,6-2H2]glucose (IV tracer) was started at −180 min and infused at a constant rate until 360 min. The vertical arrow in the top left panel indicates meal ingestion and the vertical arrow and horizontal line in the bottom left panel indicate the prime continuous infusion of the systemic tracer. Tracee represents unlabeled glucose (4).
Figure 3.
The dual-tracer approach.
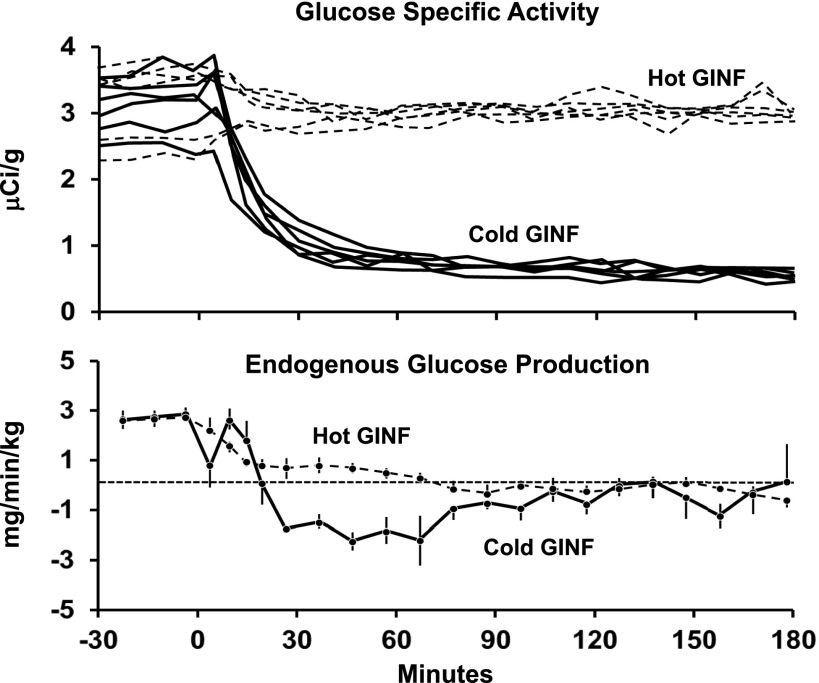
Nevertheless, Steele’s one-compartment “dual-tracer” method became widely accepted and has been used by a large number of investigators (including the authors) to assess postprandial glucose turnover. As shown in Fig. 1, this method yielded what at first appeared to be reasonable results; namely, a rapid rate of appearance of the ingested glucose, suppression of EGP, and stimulation of Rd. However, there were some troubling observations, including what was commonly referred to as a “paradoxical” increase in EGP immediately after meal ingestion. The increase in EGP was called paradoxical because it occurred at a time when glucose and insulin concentrations were rising and glucagon concentrations were falling. Even more disturbing, “negative” rates of EGP often were observed (Fig. 1). Finegood et al. (9) subsequently demonstrated that “negative” rates of EGP were observed during hyperinsulinemic-euglycemic clamps when the tracer-determined Ra was lower than the glucose infusion rate at a given time point. These were due to the inadequacy of Steele’s one-compartment method during nonsteady-state conditions (Fig. 2). These investigators established that the fall in plasma glucose specific activity that occurred during the first 90 min after the start of a clamp when unlabeled glucose was infused (Fig. 2, top panel) resulted in a marked underestimation of the actual Ra, generating biologically implausible “negative” rates of EGP (Fig. 2, bottom panel). This error resolved after the first 2 h when plasma glucose specific activity again approached steady state. This error did not occur if the infused glucose contained the tracer in amounts that approximated what was present in plasma before the start of the clamp and therefore did not perturb plasma glucose specific activity (9). This enabled glucose turnover to be measured under tracer/tracee steady-state conditions (i.e., model independent).
Figure 2.
Plasma glucose specific activity observed during a hyperinsulinemic-euglycemic clamp when unlabeled glucose alone (Cold GINF, solid line) or glucose containing [3-3H]glucose in amounts sufficient to minimize the change in plasma glucose specific activity (Hot GINF, dotted line) is shown in the upper panel. Rates of EGP observed in dogs when plasma glucose specific activity was permitted to fall (Cold GINF) or when changes in plasma specific activity were minimized (Hot GINF) are shown in the lower panel (9).
A comparison of Figs. 1 and 2 shows that the fall in plasma glucose specific activity during the first 2 h following carbohydrate ingestion are as marked as those observed by Finegood et al. (9) during a hyperinsulinemic glucose clamp when the so-called Hot GINF method (tracer is added to the glucose infusate in amounts sufficient to minimize the change in plasma ttr) is not used. Although the Hot GINF method now is universally accepted as the standard for measurement of glucose turnover during a euglycemic clamp, it has not been as widely appreciated that the same nonsteady-state errors occur when the dual-tracer method is used to measure glucose turnover following glucose ingestion. When Steele’s one-compartment model (3) is used to calculate turnover, the rapid fall in the plasma IV tracer/oral tracer ratio used to calculate Rameal that occurs during the first 2 h after food ingestion results in marked underestimation of Rameal. Similarly, the rapid fall in the IV ttr used to calculate Ra results in a marked underestimation of Ra. These errors introduce an even greater error in EGP, as it is calculated by subtracting a large incorrect number (Rameal) from an equally large incorrect number (Ra). Even worse, when EGP is calculated in this manner, it is not only inaccurate but also very imprecise as it contains the imprecision of the two large numbers (Ra and Rameal). Furthermore, Rd is incorrect as it is calculated by subtracting the change in glucose mass from an erroneous Ra. The initial “paradoxical” increase in EGP and the subsequent “negative” rates of EGP are due to unequal errors that occur during the rapid fall in the ttr used to calculate Rameal and Ra. These aberrant and biologically implausible patterns are not observed when EGP is measured with the model-independent triple-tracer approach (Fig. 5).
Figure 5.
The dual- and triple-tracer approaches were simultaneously used in eight healthy subjects (4). The ttrs, Rameal, EGP, and Rd were calculated using either Steele’s one-compartment model (1CM) or Radziuk’s two-compartment model (2CM) following the ingestion of a mixed meal containing [1-13C]glucose (oral tracer) at time 0 (arrow). In order to compare the triple- versus dual-tracer approach in the same subjects, the dual-tracer protocol shown in Fig. 1 was performed on two separate occasions and a third tracer ([6-13H]glucose) was infused at a variable rate to mimic the anticipated changes in Rameal on one occasion (as percent of the total meal tracer infused: −180 to 3 min: 0%; 3–8 min: 1%; 8–35 min: 24%; 35–70 min: 24%; 70–100 min: 15%; 100–160 min: 18%; 160–270 min: 15%; 270–360 min: 3%) and on the other occasion to mimic the anticipated changes in EGP (as percent of the baseline EGP tracer: −180 to 3 min: 100%; 3–8 min: 70%; 8–18 min: 55%; 18–25 min: 30%; 25–45 min: 15%; 45–70 min: 25%; 70–160 min: 35%; 160–260 min: 55%; 260–360 min: 80%).
Radziuk’s Two-Compartment Nonsteady-State Model
As noted above, Steele and colleagues (6) also explored the use of other models, as they recognized that a one-compartment nonhomogenous model is a compromise. Nevertheless, they rejected those models because of their complexity. However, because of the obvious problems with a one-compartment model, other investigators have explored the use of multicompartmental models. Perhaps the most commonly used one has been the two-compartment model proposed by Radziuk (10) that postulates both an accessible and a slowly exchanging nonaccessible compartment (Fig. 3).
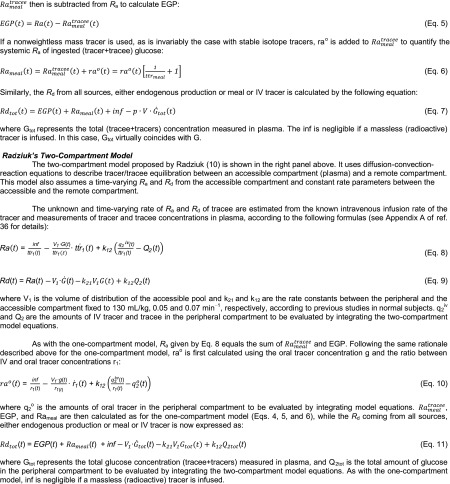
As shown in Fig. 1, the postprandial pattern of change in Rameal, EGP, and Rd calculated with Radziuk’s two-compartment model (10) are similar to those calculated with the more commonly used Steele’s one-compartment model. However, the early “paradoxical” increase in EGP is less evident, and the peak rates of Rameal and Rd are higher than when calculated with Steele’s one-compartment model. Also, EGP transiently is somewhat more “negative” when calculated with the two-compartment rather than the one-compartment model. Although data that subsequently have become available have shown that insulin-stimulated glucose uptake in peripheral tissues varies with time and differs from the rate at which insulin suppresses EGP, both of which differ in people with or without diabetes (11,12), the assumption of a single homogeneous remote compartment was a reasonable simplifying assumption at the time of the development of Radziuk’s two-compartment model (10). However, as with the one-compartment model, this assumption, as well as assumptions regarding the size of the initial volume of distribution and of the rate constants governing the exchange between compartments, is not required if turnover can be measured in the presence of tracer/tracee steady state. The structure, equations, and underlying assumptions of Steele’s one-compartment and Radziuk’s two-compartment models are summarized in Fig. 3.
Measurement of Postprandial Glucose Turnover in the Presence of Tracer/Tracee Steady State: The Triple-Tracer Method
Nonsteady-state experiments such as those performed by Finegood et al. (9) indicate that the accuracy of the estimation of glucose turnover can be enhanced if a tracer is infused in a manner that minimizes the change in the plasma ttr of the parameter of interest. As discussed above, the Hot GINF method does this during a clamp by ensuring that ttr of the infused glucose approximates what is present in the plasma before the initiation of the clamp (9). Nonsteady-state tracer theory (13,14) anticipated this experimental finding by introducing the ttr clamp technique.
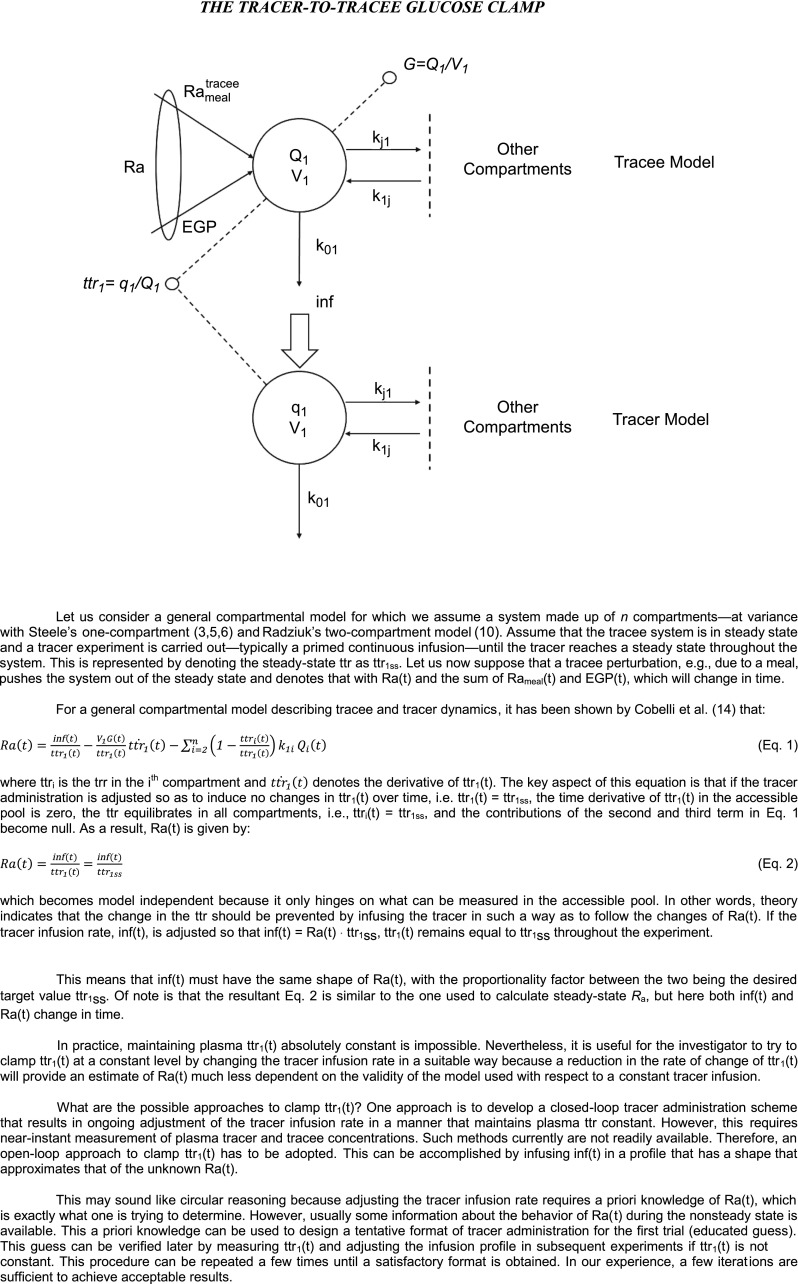
The structure and underlying assumptions of the tracer-to-tracee glucose clamp method is shown in Fig. 4. The triple-tracer method (13,14) uses the ttr clamp to keep the appropriate plasma ttrs constant following glucose ingestion. However, instead of infusing labeled glucose at a constant rate, it varies the intravenous infusion rates of two different tracers in a manner that mimics the anticipated changes in systemic rate of appearance of ingested tracer and of unlabeled glucose released by EGP (Fig. 5). As the pattern of appearance of ingested glucose differs dramatically from that of postprandial suppression of EGP, two intravenous tracers are needed: one to trace the appearance of the label contained in the ingested glucose and one to trace the rate of release of unlabeled glucose due to EGP. It is called the triple-tracer method to distinguish it from Steele’s one-compartment model and Radziuk’s two-compartment model (or dual-tracer) approach described above. In order to minimize the change in plasma ttrs, this method requires a priori general knowledge of the temporal pattern of change of Rameal and EGP. Such knowledge can be relatively easily gained by conducting a few pilot studies that start with tracer infusion profiles that are anticipated to mimic postprandial changes in Rameal and EGP and then modifying them (if necessary) so as to minimize the change in plasma ttr. Sample infusion profiles (which the authors would be delighted to provide upon request) and the resultant ttrs are shown in Fig. 5. In these early experiments, the plasma Rameal ttr drifted up and the EGP ttr drifted down (these variances can be reduced with experience); however, point-to-point changes during a given time interval were small.
Figure 4.
The tracer-to-tracee glucose clamp.
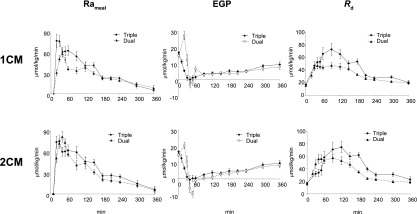
Previous theoretical (13,14) and experimental (9,15) studies have shown that changes of this magnitude introduce minimal error into the calculation of glucose turnover. This is evident by the fact that Rameal, EGP, and Rd are essentially the same when turnover measured with the triple-tracer method was calculated using either Steele’s one-compartment or Radziuk’s two-compartment model. Figure 6 shows a comparison of results measured with the triple-tracer approach, which essentially is a model-independent method to those obtained in the same individuals at the same time using the conventional dual-tracer approach calculated either by using Steele’s model of nonhomogenous one-compartment (upper panels) or Radziuk’s two-compartment model (lower panels). As is evident, the dual approach calculated with Steele’s one-compartment model underestimates the triple-tracer Rameal profile during the first 180 min, then provides concordant estimates thereafter at a time when the plasma ttr once again is approximating steady state (Fig. 6, left upper panel). The degree of over- and underestimation of Rameal is lower with the two- than with the one-compartment model (Fig. 6, left lower panel). In contrast to the paradoxical increase in EGP that is observed with the dual-tracer approach (again less with the two- than with the one-compartment model), the triple-tracer method shows that EGP smoothly falls (as would be anticipated during a time when glucose and insulin concentrations are rising) during the first 30–60 min and then slowly rises thereafter (Fig. 6, middle panels). Once again, as rate of change in the plasma ttr slows from 2 to 3 h onward during the dual-tracer method, the dual- and triple-tracer methods provide concordant estimates of EGP. Rd measured with either the one- or two-compartment dual-tracer models, whether assessed as peak or total postprandial increment, is lower than actual Rd measured with the triple-tracer approach (Fig. 6, right panels).
Figure 6.
Rameal, EGP, and Rd determined using either the dual-tracer (dual) or triple-tracer (triple) method when calculated with either Steele’s one-compartment model (1CM) or Radziuk’s two-compartment model (2CM) (4).
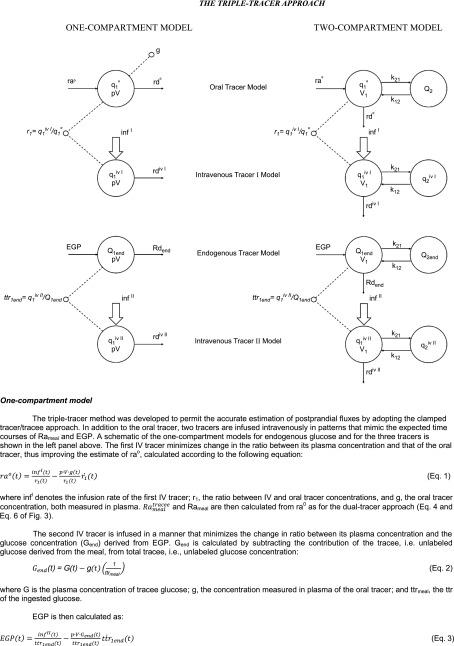
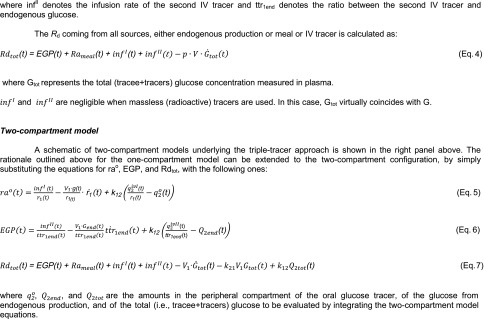
The rationale underlying the calculation of Rameal, EGP, and Rd with the triple-tracer approach when using either a one- or two-compartment model is described in Fig. 7.
Figure 7.
The triple-tracer approach.
Discussion
No method is perfect. The triple-tracer method has advantages and disadvantages when compared with the dual-tracer approach (Table 1). The triple-tracer approach is more complicated than the dual-tracer approach. Assuming the goal is to measure Rameal, EGP, and Rd, the triple-tracer method requires three tracers, whereas the dual-tracer method uses only two tracers. In addition, the IV tracer infusion rates need to be varied with the triple-tracer approach, whereas the single IV tracer infusion is kept constant with the dual-tracer approach. The need to vary the tracer infusion rates with time seems complicated, but it is not. Relatively inexpensive pumps can be readily programmed to infuse the tracers in the profiles shown in Fig. 5. However, it is essential to conduct pilot studies in order to optimize the tracer infusions so as to keep both the plasma oral and endogenous ttrs constant.
Table 1.
Advantages and disadvantages of dual- and triple-tracer methods
| Advantages | Disadvantages | |
|---|---|---|
| Dual-tracer method |
|
|
| Triple-tracer method |
|
|
As there is no “gold standard” to compare results with the oral triple-tracer approach, Haidar et al. (16) infused [U-13C]glucose plus 20% dextrose intravenously in a profile mimicking that which would be anticipated to be observed after the ingestion of a carbohydrate-containing meal and traced its rate of appearance using [U-13C;1,2,3,4,5,6,6-2H7]glucose also infused intravenously in a pattern anticipated to mimic the “meal” intravenous infusion. Unfortunately, rather than maintaining the plasma “meal” ttr constant, it increased by approximately 300% during the first 60 min (see Fig. 3B in ref. 16), resulting in an overestimate of the Rameal over that interval (see Fig. 5B in ref. 16). Although considerably less than the approximately 600% fall in the “meal” plasma ttr observed in the same interval using the dual-tracer approach, it still contrasts with the relatively flat ttr that can be achieved after conducting a few pilot experiments (Fig. 5, middle panels). However, Haidar et al. (16) did an excellent job of maintaining the plasma endogenous ttr constant by varying the intravenous infusion of [6,62H2]glucose, which enabled an accurate estimation of EGP.
Although optimizing the tracer infusions may seem daunting, in practice, it is not. Over the past 12 years, we and others have successfully conducted over 600 triple-tracer studies in more than 300 subjects, including children (17); young and older adults (18–23); subjects with prediabetes (24), type 2 diabetes (25–29), and type 1 diabetes in the presence or absence of exercise or agents that delay gastric emptying (18,30–32); and obese subjects before and after vagal blockade (33) or Roux-en-Y gastric bypass (32).
Three tracers and analyzing three specific activities or enrichments cost more than two tracers and analyzing two specific activities or enrichments. The incremental cost of tracers (∼$200 vs. ∼$100) is relatively small. The cost of analysis of a third ttr is greater, the extent of which depends on the site of analysis (e.g., commercial laboratory vs. academic center). However, the increment in cost to use the triple-tracer approach needs to be considered in light of the cost of recruiting, studying, and measuring various hormones and substrates, particularly as the dual-tracer method yields inaccurate and at times misleading information. EGP is measured directly with the triple-tracer approach rather than by subtracting a large inaccurate and imprecise number from another large inaccurate and imprecise number as is done with the dual-tracer approach. However, Ra is not measured directly with the triple-tracer approach, so it must be calculated as the sum of its component parts (Rameal and EGP). This is rarely a problem as generally Rameal and EGP are the parameters of interest. Although the triple-tracer approach minimizes the impact of tracer/tracee nonsteady state on the calculation of Rameal and EGP and therefore Ra, a model of the glucose space still is required to accurately calculate Rd. The same limitation applies to the dual-tracer method; however, in this instance additional uncertainty is introduced as Ra is incorrect. Rd measures the rate of disappearance of glucose from the glucose space. Therefore, if glucose concentration exceeds the renal threshold, as commonly occurs after food ingestion in people with type 2 diabetes, Rd is influenced by both tissue glucose uptake and urinary glucose excretion.
Care needs to be taken to be sure that the ingested carbohydrate is uniformly labeled with the tracer; otherwise, the rate of appearance of the ingested tracer will not reflect the rate of appearance of the concurrently ingested carbohydrate. The splanchnic catheterization technique, alone or in combination with a hyperglycemic clamp, can measure net splanchnic balance after the ingestion of a meal (34,35). However, these methods are invasive and must be used in combination with meal and systemic tracers to determine the relative contribution of changes in Rameal and EGP to changes in net splanchnic balance. Radioactive tracers should not be used in certain settings (e.g., when studying children) and cannot be used in some countries. Fortunately, sophisticated mass spectrometry techniques permit the use of the triple-tracer approach with three stable tracers, e.g., [6,6-2H2]glucose, [1-13C]glucose, and [U-13C]glucose (17). However, care needs to be taken to correct for carbon recycling if [6-13C]glucose or [1-13C]glucose is used as a tracer. But only two tracers are required if the goal is to measure only Rameal or only EGP.
The Path Forward
High-quality and sophisticated genotyping is most productive when combined with high-quality and sophisticated phenotyping and vice versa. In addition, as the causes of postprandial hyperglycemia in people with type 2 diabetes are complex and are likely to differ in different populations, development and validation of novel therapies require an in-depth understanding of the mechanisms responsible for altered postprandial glucose metabolism. The use of the triple-tracer approach enables simultaneous measurement of the Ra of the ingested glucose (and splanchnic glucose uptake obtained by subtracting area under the curve of Rameal from the amount of glucose ingested), EGP, and Rd. In addition, if insulin and C-peptide are measured, insulin secretion and insulin action can be concurrently assessed using the oral minimal model (22).
The triple-tracer approach builds on original insight of Steele et al. (3) that by labeling ingested glucose and by infusing a systemic tracer, postprandial Ra can be partitioned between that which is coming from the ingested glucose and that which is due to EGP. Steele and colleagues (3,5,6) also realized that the resultant tracer/tracee nonsteady state required a fudge factor (an “effective” volume of distribution) as specific activity or enrichment in the accessible (plasma) pool does not reflect that in distant metabolically active tissues. Unfortunately, subsequent data have shown that the use of an “effective” volume of distribution introduces indeterminate errors that are both time and context dependent (7,8). The use of the triple-tracer approach minimizes such errors. Although this method may seem complicated, in practice, it generally is not. As noted earlier, we and others have used the triple-tracer approach to study the pattern of postprandial glucose metabolism in a large number of subjects with a variety of metabolic conditions in diverse settings (17–33). Upon request, these authors would be pleased to provide the tracer infusion profiles used in those studies. However, we strongly recommend that a few pilot experiments still need to be performed to refine the meal and endogenous tracer infusion profiles for the particular condition being studied. Once done, subsequent experiments are relatively straightforward and become simpler with experience. Care still needs to be taken to optimize the tracer infusion profiles when new disease states are to be studied (e.g., extreme insulin resistance) or the composition of the test meals differs substantially (e.g., complex carbohydrates vs. readily absorbable mono- or disaccharides). Of note, it is essential in the latter situation that the complex carbohydrates and disaccharides are uniformly labeled; otherwise, the systemic rate of appearance of the oral tracer will not reflect the rate of degradation and absorption of the ingested carbohydrate.
The dual-tracer method requires starting an IV tracer infusion several hours before meal ingestion. The pump then infuses tracer at a constant rate throughout the experiment. The triple-tracer method also requires starting a tracer infusion several hours before meal ingestion. The pump then infuses tracer at a constant rate until time 0 (when the meal is to be ingested) and then automatically changes the infusion rate to mimic the anticipated pattern of change of EGP. A second intravenous tracer is started when the meal is ingested that infuses a second tracer in a profile (easily programmed) that is anticipated to mimic the rate of appearance of the ingested glucose. In the opinion of the authors, the value of obtaining an accurate and reproducible assessment of Rameal, the postprandial pattern of suppression of EGP, and the postprandial pattern of stimulation of Rd more than offsets the cost of a second tracer and a second pump.
Article Information
Acknowledgments. The authors would like to thank Drs. Ananda Basu, Rita Basu, and Adrian Vella, of the Mayo Clinic, and Dr. Chiara Dalla Man, of the University of Padova, for their thoughtful suggestions and support.
Funding. This work was supported by the National Institutes of Health (DK29953 and DK82396); the Ministero dell’Universitá e della Ricerca Scientifica e Tecnologica, Italy; and the Mayo Clinic.
References
- 1.Butler PC, Rizza RA. Contribution to postprandial hyperglycemia and effect on initial splanchnic glucose clearance of hepatic glucose cycling in glucose-intolerant or NIDDM patients. Diabetes 1991;40:73–81 [PubMed] [Google Scholar]
- 2.Cobelli C, Toffolo G, Foster DM. Tracer-to-tracee ratio for analysis of stable isotope tracer data: link with radioactive kinetic formalism. Am J Physiol 1992;262:E968–E975 [DOI] [PubMed] [Google Scholar]
- 3.Steele R, Bjerknes C, Rathgeb I, Altszuler N. Glucose uptake and production during the oral glucose tolerance test. Diabetes 1968;17:415–421 [DOI] [PubMed] [Google Scholar]
- 4.Toffolo G, Basu R, Dalla Man C, Rizza R, Cobelli C. Assessment of postprandial glucose metabolism: conventional dual- vs. triple-tracer method. Am J Physiol Endocrinol Metab 2006;291:E800–E806 [DOI] [PubMed] [Google Scholar]
- 5.Steele R, Wall JS, De Bodo RC, Altszuler N. Measurement of size and turnover rate of body glucose pool by the isotope dilution method. Am J Physiol 1956;187:15–24 [DOI] [PubMed] [Google Scholar]
- 6.De Bodo RC, Steele R, Altszuler N, Dunn A, Bishop JS. On the hormonal regulation of carbohydrate metabolism; studies with C14 glucose. Renal Prog Horm Res 1963;19:443–483 [PubMed] [Google Scholar]
- 7.Butler PC, Caumo A, Zerman A, O’Brien PC, Cobelli C, Rizza RA. Methods for assessment of the rate of onset and offset of insulin action during nonsteady state in humans. Am J Physiol 1993;264:E548–E560 [DOI] [PubMed] [Google Scholar]
- 8.Allsop JR, Wolfe RR, Burke JF. The realiability of rates of glucose appearance in vivo calculated from constant tracer infusions. Biochem J 1978;172:407–416 [DOI] [PMC free article] [PubMed] [Google Scholar]
- 9.Finegood DT, Bergman RN, Vranic M. Modeling error and apparent isotope discrimination confound estimation of endogenous glucose production during euglycemic glucose clamps. Diabetes 1988;37:1025–1034 [DOI] [PubMed] [Google Scholar]
- 10.Radziuk J. An integral equation approach to measuring turnover in nonsteady compartmental and distributed systems. Bull Math Biol 1976;38:679–693 [DOI] [PubMed] [Google Scholar]
- 11.Yang YJ, Hope ID, Ader M, Bergman RN. Insulin transport across capillaries is rate limiting for insulin action in dogs. J Clin Invest 1989;84:1620–1628 [DOI] [PMC free article] [PubMed] [Google Scholar]
- 12.Turk D, Alzaid A, Dinneen S, Nair KS, Rizza R. The effects of non-insulin-dependent diabetes mellitus on the kinetics of onset of insulin action in hepatic and extrahepatic tissues. J Clin Invest 1995;95:755–762 [DOI] [PMC free article] [PubMed] [Google Scholar]
- 13.Norwich KH. Measuring rates of appearance in systems which are not in steady state. Can J Physiol Pharmacol 1973;51:91–101 [DOI] [PubMed] [Google Scholar]
- 14.Cobelli C, Mari A, Ferrannini E. Non-steady state: error analysis of Steele’s model and developments for glucose kinetics. Am J Physiol 1987;252:E679–E689 [DOI] [PubMed] [Google Scholar]
- 15.Hother-Nielsen O, Henriksen JE, Staehr P, Beck-Nielsen H. Labelled glucose infusate technique in clamp studies. Is precise matching of glucose specific activity important? Endocrinol Metab (Seoul) 1995;2:275–287 [Google Scholar]
- 16.Haidar A, Elleri D, Allen JM, et al. Validity of triple- and dual-tracer techniques to estimate glucose appearance. Am J Physiol Endocrinol Metab 2012;302:E1493–E1501 [DOI] [PMC free article] [PubMed] [Google Scholar]
- 17.Toffolo G, Dalla Man C, Cobelli C, Sunehag AL. Glucose fluxes during OGTT in adolescents assessed by a stable isotope triple tracer method. J Pediatr Endocrinol Metab 2008;21:31–45 [DOI] [PubMed] [Google Scholar]
- 18.Hinshaw L, Schiavon M, Mallad A, et al. Effects of delayed gastric emptying on postprandial glucose kinetics, insulin sensitivity, and β-cell function. Am J Physiol Endocrinol Metab 2014;307:E494–E502 [DOI] [PMC free article] [PubMed] [Google Scholar]
- 19.Basu R, Dalla Man C, Campioni M, et al. Effects of age and sex on postprandial glucose metabolism: differences in glucose turnover, insulin secretion, insulin action, and hepatic insulin extraction. Diabetes 2006;55:2001–2014 [DOI] [PubMed] [Google Scholar]
- 20.Basu R, Dalla Man C, Campioni M, et al. Two years of treatment with dehydroepiandrosterone does not improve insulin secretion, insulin action, or postprandial glucose turnover in elderly men or women. Diabetes 2007;56:753–766 [DOI] [PubMed] [Google Scholar]
- 21.Basu R, Dalla Man C, Campioni M, et al. Effect of 2 years of testosterone replacement on insulin secretion, insulin action, glucose effectiveness, hepatic insulin clearance, and postprandial glucose turnover in elderly men. Diabetes Care 2007;30:1972–1978 [DOI] [PubMed] [Google Scholar]
- 22.Basu R, Breda E, Oberg AL, et al. Mechanisms of the age-associated deterioration in glucose tolerance: contribution of alterations in insulin secretion, action, and clearance. Diabetes 2003;52:1738–1748 [DOI] [PubMed] [Google Scholar]
- 23.Saad A, Dalla Man C, Nandy DK, et al. Diurnal pattern to insulin secretion and insulin action in healthy individuals. Diabetes 2012;61:2691–2700 [DOI] [PMC free article] [PubMed] [Google Scholar]
- 24.Bock G, Dalla Man C, Micheletto F, et al. The effect of DPP-4 inhibition with sitagliptin on incretin secretion and on fasting and postprandial glucose turnover in subjects with impaired fasting glucose. Clin Endocrinol (Oxf) 2010;73:189–196 [DOI] [PMC free article] [PubMed] [Google Scholar]
- 25.Basu A, Dalla Man C, Basu R, Toffolo G, Cobelli C, Rizza RA. Effects of type 2 diabetes on insulin secretion, insulin action, glucose effectiveness, and postprandial glucose metabolism. Diabetes Care 2009;32:866–872 [DOI] [PMC free article] [PubMed] [Google Scholar]
- 26.Sathananthan M, Shah M, Edens KL, et al. Six and 12 weeks of caloric restriction increases β cell function and lowers fasting and postprandial glucose concentrations in people with type 2 diabetes. J Nutr 2015;145:2046–2051 [DOI] [PMC free article] [PubMed] [Google Scholar]
- 27.Smushkin G, Sathananthan M, Piccinini F, et al. The effect of a bile acid sequestrant on glucose metabolism in subjects with type 2 diabetes. Diabetes 2013;62:1094–1101 [DOI] [PMC free article] [PubMed] [Google Scholar]
- 28.Vella A, Bock G, Giesler PD, et al. The effect of dipeptidyl peptidase-4 inhibition on gastric volume, satiation and enteroendocrine secretion in type 2 diabetes: a double-blind, placebo-controlled crossover study. Clin Endocrinol (Oxf) 2008;69:737–744 [DOI] [PMC free article] [PubMed] [Google Scholar]
- 29.Dalla Man C, Bock G, Giesler PD, et al. Dipeptidyl peptidase-4 inhibition by vildagliptin and the effect on insulin secretion and action in response to meal ingestion in type 2 diabetes. Diabetes Care 2009;32:14–18 [DOI] [PMC free article] [PubMed] [Google Scholar]
- 30.Hinshaw L, Dalla Man C, Nandy DK, et al. Diurnal pattern of insulin action in type 1 diabetes: implications for a closed-loop system. Diabetes 2013;62:2223–2229 [DOI] [PMC free article] [PubMed] [Google Scholar]
- 31.Mallad A, Hinshaw L, Schiavon M, et al. Exercise effects on postprandial glucose metabolism in type 1 diabetes: a triple-tracer approach. Am J Physiol Endocrinol Metab 2015;308:E1106–E1115 [DOI] [PMC free article] [PubMed] [Google Scholar]
- 32.Shah M, Law JH, Micheletto F, et al. Contribution of endogenous glucagon-like peptide 1 to glucose metabolism after Roux-en-Y gastric bypass. Diabetes 2014;63:483–493 [DOI] [PMC free article] [PubMed] [Google Scholar]
- 33.Sathananthan M, Ikramuddin S, Swain JM, et al. The effect of vagal nerve blockade using electrical impulses on glucose metabolism in nondiabetic subjects. Diabetes Metab Syndr Obes 2014;7:305–312 [DOI] [PMC free article] [PubMed] [Google Scholar]
- 34.Felig P, Wahren J, Hendler R. Influence of maturity-onset diabetes on splanchnic glucose balance after oral glucose ingestion. Diabetes 1978;27:121–126 [DOI] [PubMed] [Google Scholar]
- 35.Ludvik B, Nolan JJ, Roberts A, et al. Evidence for decreased splanchnic glucose uptake after oral glucose administration in non-insulin-dependent diabetes mellitus. J Clin Invest 1997;100:2354–2361 [DOI] [PMC free article] [PubMed] [Google Scholar]
- 36.Basu R, Di Camillo B, Toffolo G, et al. Use of a novel triple-tracer approach to assess postprandial glucose metabolism. Am J Physiol Endocrinol Metab 2003;284:E55–E69 [DOI] [PubMed] [Google Scholar]


