

Abstract
Developmental gene networks implement the dynamic regulatory mechanisms that pattern and shape the organism. Over evolutionary time, the wiring of these networks changes, yet the patterning outcome is often preserved, a phenomenon known as “system drift.” System drift is illustrated by the gap gene network—involved in segmental patterning—in dipteran insects. In the classic model organism Drosophila melanogaster and the nonmodel scuttle fly Megaselia abdita, early activation and placement of gap gene expression domains show significant quantitative differences, yet the final patterning output of the system is essentially identical in both species. In this detailed modeling analysis of system drift, we use gene circuits which are fit to quantitative gap gene expression data in M. abdita and compare them with an equivalent set of models from D. melanogaster. The results of this comparative analysis show precisely how compensatory regulatory mechanisms achieve equivalent final patterns in both species. We discuss the larger implications of the work in terms of “genotype networks” and the ways in which the structure of regulatory networks can influence patterns of evolutionary change (evolvability).
Keywords: evolutionary developmental biology, evolutionary systems biology, network evolution, system drift, reverse engineering, gap gene network.
Introduction
The evolution of biological form involves changes in the gene regulatory networks (GRNs) that underlie organismal development (Maynard Smith et al. 1985; Arthur 2002; Wilkins 2007a; Pavlicev and Wagner 2012; Salazar-Ciudad and Marín-Riera 2013; Jaeger and Sharpe 2014). Correspondingly, understanding morphological evolution requires thorough knowledge of the structure of GRNs, the “developmental mechanisms” they encode, and the possible evolutionary transitions between them (terms in quotation marks are defined in Box 1). Over the past 60 years, numerous theoretical and computational studies have led to significant conceptual advances regarding this problem of network evolution (see, e.g., Waddington 1957; Britten and Davidson 1969; Kauffman 1969, 1994; Thom 1976; Goodwin 1982; Maynard Smith et al. 1985; Alberch 1991; Webster and Goodwin 1996; Wilkins 2005, 2007a, 2007b; Davidson and Erwin 2006; Wilke 2006; Crombach and Hogeweg 2008; Stern and Orgogozo 2008, 2009; Wagner 2008, 2011, 2014; Erwin and Davidson 2009; Cotterell and Sharpe 2010; Draghi et al. 2010; Hoyos et al. 2011; Peter and Davidson 2011, 2015; Salazar-Ciudad and Marín-Riera 2013; Jiménez et al. 2015; Sorrells and Johnson 2015). Yet much remains unknown about network structure and dynamics. On the one hand, subtle alterations in genetic interactions can lead to unexpectedly different regulatory dynamics and hence significant phenotypic changes. On the other hand, major network changes may have no effect on phenotypic output at all. Unfortunately, we do not yet understand the complex and nonlinear chain of events that links evolutionary changes in regulatory network structure to changes in developmental mechanisms in any experimentally accessible system (Jaeger and Sharpe 2014). In other words, we know very little—in general terms or in any specific instance—about how the structure of a GRN influences its possible paths of change, its “evolvability” (Wagner and Altenberg 1996; Hendrikse et al. 2007; Pigliucci 2008; Wagner 2011). Here, we address these issues and supply a first example of a quantitative comparative analysis of developmental GRN structure and dynamics in an experimentally tractable model system: The gap gene network of dipteran insects (Jaeger 2011).
Gap genes are involved in pattern formation and segment determination during the blastoderm stage of early insect development (Jaeger 2011). In dipterans (flies, midges, and mosquitoes; see fig. 1A), they comprise the top-most zygotic layer of the segmentation hierarchy, interpreting maternal gradients to subdivide the embryo into broad overlapping domains of gene expression. We focus on the four key gap genes that operate in the trunk region of the embryo: hunchback (hb), Krüppel (Kr), knirps (kni), and giant (gt).
Fig. 1.
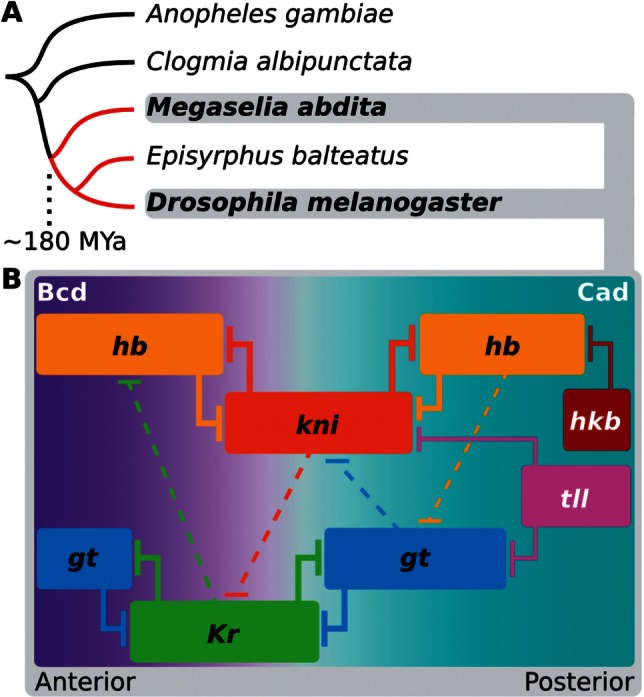
Dipteran phylogeny and structure of the gap gene network. (A) Phylogenetic position of Megaselia abdita compared with other dipteran species in which gap genes have been studied. Cyclorrhaphan lineage marked in red. (B) The gap gene networks of Drosophila melanogaster and M. abdita share the same qualitative structure. Colored boxes indicate position of gap gene expression domains along the anterior–posterior axis; only the trunk region of the embryo is shown; anterior is to the left, posterior to the right. Trunk gap genes: hb, Kr, gt, kni; terminal gap genes: tll, hkb. Background color represents main activating inputs by maternal morphogen gradients: Bcd and Cad. T-bars represent repression; dashed lines indicate net repressive interactions between overlapping domains.
The developmental mechanisms governing gap gene expression were first worked out in the model organism, Drosophila melanogaster. Evidence from genetic, molecular, and data-driven modeling approaches have shown that it implements five basic regulatory principles (fig. 1B) (Jaeger 2011): 1) Activation of gap genes by maternal gradients of Bicoid (Bcd) and Caudal (Cad), 2) gap gene autoactivation, 3) strong repression between mutually exclusive pairs hb/kni and Kr/gt, 4) weak repression with posterior bias between overlapping gap genes causing domain shifts toward the anterior over time, and 5) repression by terminal gap genes tailless (tll) and huckebein (hkb) in the posterior pole region. In addition to evidence from D. melanogaster, gap gene expression and regulation has been studied in a range of nondrosophilid dipteran species (Sommer and Tautz 1991; Rohr et al. 1999; Stauber et al. 2000; McGregor et al. 2001; Goltsev et al. 2004; Hare et al. 2008; Lemke and Schmidt-Ott 2009; García-Solache et al. 2010; Lemke et al. 2010; Crombach et al. 2014; Klomp et al. 2015; Wotton, Jiménez-Guri, and Jaeger 2015; Wotton, Jiménez-Guri, Crombach, Janssens, et al. 2015). This work indicates that the gap gene network is highly conserved within the cyclorrhaphan dipteran lineage of the higher flies (fig. 1B).
In this report, we present a data-driven dynamical modeling approach to analyze and compare regulation of the trunk gap genes between D. melanogaster and the nondrosophilid scuttle fly Megaselia abdita, a member of the basally branching cyclorrhaphan family Phoridae (fig. 1A; Wotton, Jiménez-Guri, and Jaeger 2015; Wotton, Jiménez-Guri, Crombach, Janssens, et al. 2015). We chose M. abdita as our system of study because it is experimentally tractable (Rafiqi et al. 2011) and features a conserved set of gap genes (and upstream regulators) identical to D. melanogaster (Wotton, Jiménez-Guri, Crombach, Janssens, et al. 2015).
Previous work has established the basic qualitative similarities of the gap gene networks in these two organisms (Wotton, Jiménez-Guri, Crombach, Janssens, et al. 2015). Yet, it was also shown that the precise temporal and spatial dynamics of gene expression differ between them (Wotton, Jiménez-Guri, Crombach, Janssens, et al. 2015). Specifically, in M. abdita, it is thought that a broadened Bcd gradient (Stauber et al. 1999, 2000; Wotton, Jiménez-Guri, and Jaeger 2015) and absence of maternal Cad (Stauber et al. 2008; Wotton, Jiménez-Guri, and Jaeger 2015) lead to gap domains appearing more posteriorly, and retracting from the pole later, than in D. melanogaster. Strikingly, however, the system compensates those differences to restore expression boundaries to comparable positions at the onset of gastrulation. And in similar fashion, the embryos of both species have identical patterning when segments appear.
The process leading to such compensatory evolution is called “developmental system drift” (Weiss and Fullerton 2000; True and Haag 2001; Weiss 2005; Haag 2007; Pavlicev and Wagner 2012). System drift preserves the outcome of a regulatory process (the “phenotype”), whereas interactions within the network (its “genotype”) are altered. Our work shows how such developmental system drift is achieved through regulatory changes in the dipteran gap gene system. We discuss our results within the context of the idea of a “genotype network” (Wagner 2008, 2011). Genotype networks consist of related GRNs—connected to each other through single mutations—that all produce the same phenotypic outcome. They provide a powerful explanatory framework to account for the evolvability of the gap gene network through developmental system drift.
Results
Modeling the Comparative Dynamics of Gap Gene Expression
We previously used gene knock-down by RNA interference (RNAi) to identify conserved and divergent aspects of gap gene network structure between M. abdita and D. melanogaster. This experimental analysis reveals that the qualitative aspects of the network are highly conserved (fig. 1B); only the strength of specific interactions has changed during evolution (Wotton, Jiménez-Guri, Crombach, Janssens, et al. 2015). In particular, we identified interspecies differences in sensitivity to RNAi for repressive interactions between overlapping gap genes. These interactions are involved in regulating gap domain shifts in D. melanogaster (Jaeger, Surkova, et al. 2004). Based on our evidence, we proposed that the gap gene network is evolving through “quantitative system drift” (Wotton, Jiménez-Guri, Crombach, Janssens, et al. 2015). This hypothesis provides the starting point for our current investigation into the evolution of expression dynamics governed by gap gene regulation.
At first sight, it may be straightforward and reasonable to assume that the quantitative regulatory changes reported in our previous study (Wotton, Jiménez-Guri, Crombach, Janssens, et al. 2015) can account for the compensatory differences in domain shifts between species. However, genetic analysis using RNAi knockdowns has an important limitation: It remains at the level of correlation, and correlation does not imply causation. For example, an RNAi experiment may reveal an interaction that is particularly sensitive to gene knockdown. But it cannot directly reveal the precise causes and effects of this sensitivity in the context of the dynamic interactions between multiple regulators that constitute a developmental mechanism. Using experimental evidence alone, we cannot establish that the postulated regulatory changes are indeed necessary and sufficient to explain the observed interspecies differences in the dynamics of gap domains.
The aim of our study is to transcend this limitation. We use data-driven mathematical modeling to investigate the complex causal connections between altered network structure and changes in developmental mechanisms that drive the observed differences in expression dynamics between M. abdita and D. melanogaster. Detailed and accurate models of the gap gene network allow us to simulate and analyze the flow of cause and effect through many simultaneous regulatory interactions. To obtain such models we used a reverse-engineering approach, the gene circuit method; gene circuits are well established and have been successfully applied to the study of gap gene regulation in D. melanogaster (Reinitz and Sharp 1995; Reinitz et al. 1995; Jaeger, Blagov, et al. 2004; Jaeger, Surkova, et al. 2004; Jaeger et al. 2007; Perkins et al. 2006; Ashyraliyev et al. 2009; Manu et al. 2009a, 2009b; Crombach, Wotton, et al. 2012). The approach is based on fitting dynamical network models (gene circuits) to quantitative spatiotemporal gap gene expression data from wild-type blastoderm embryos. Importantly, the parameters of a gene circuit not only yield the structure of the network but also enable detailed analysis of the “dynamic regulatory mechanisms” governing pattern formation by the gap gene system. As gene circuits do not rely on data derived from genetic perturbations, they yield regulatory evidence which is complementary and independent of that provided by RNAi knock-downs.
Megaselia abdita and D. melanogaster Gap Gene Circuits
We created an integrated quantitative data set of gap gene mRNA expression patterns—with high spatial and temporal resolution—for the blastoderm-stage embryo of M. abdita (fig. 2A). Our data set is based on previously quantified and characterized positions of gap gene expression boundaries in this species (Wotton, Jiménez-Guri, Crombach, Janssens, et al. 2015). We used these data to fit gene circuits in order to reverse-engineer the gap gene network of M. abdita (fig. 2B). We have previously shown for D. melanogaster that both mRNA and protein expression data yield gene circuits with equivalent regulatory mechanisms (Crombach, Wotton, et al. 2012), and that posttranscriptional regulation is not necessary for gap boundary positioning (Becker et al. 2013). As a reference for comparison, we used published gap gene mRNA expression data (Crombach, Wotton, et al. 2012) to obtain a set of equivalent gene circuits for D. melanogaster. For each species, we selected 20 fitting solutions that capture expression dynamics correctly (fig. 2C and E). See Materials and Methods for details on data processing, model fitting, and analysis.
Fig. 2.

The gene circuit approach and resulting gap gene network models. (A) Data acquisition/processing. Top: Megaselia abdita whole-mount in situ hybridization showing kni mRNA expression at mid-blastoderm (C14-T3). Middle: Embryo mask showing dorsoventral midline (black) and 10%-strip used for extraction of expression profiles (bounded by red lines). In both panels, anterior is to the left, dorsal is up. Bottom: Extracted kni expression profile (gray) in arbitrary units (au); manually fitted spline curves used to extract boundary positions shown in black (arrows); gray background indicates the trunk region included in our models. (B) The gene circuit approach: A dynamical model—consisting of a row of dividing nuclei with gap gene regulation, diffusion, and decay—is fit to integrated expression data using a global optimization strategy. (C–E) mRNA expression data and gene circuit model output for M. abdita (left) and Drosophila melanogaster (right) during blastoderm cycle 14A (C14A; time classes T1–8); we show 20 selected gene circuits for each species. (C, D) Space–time plots show gap gene expression data (solid areas), overlaid with gene circuit model output (each independent model fit represented by a separate line). Areas/lines demarcate regions with relative mRNA concentrations above half-maximum value. Star indicates dynamic versus stationary behavior of the posterior hb boundary; diamond highlights differing shift dynamics of the posterior gt domain. (E) Gene expression data (dashed) and gene circuit model output (solid lines) at time class T5 (horizontal dashed line in [C] and [D]). A–P position in percent, where 0% is the anterior pole. (F) Comparison of interaction strengths for gap gene cross-regulation between species. Scatter plots show distributions of estimated parameter values from fitted and selected circuits in M. abdita (colored dots), and D. melanogaster (gray); target genes separated by panel where columns represent regulators. Stars/diamonds indicate interactions involved in corresponding features of expression dynamics highlighted in (C) and (D).
The resulting models accurately reproduce the observed differences in domain shifts between M. abdita and D. melanogaster (fig. 2C and D) (Wotton, Jiménez-Guri, Crombach, Janssens, et al. 2015). This enables us to study the mechanistic basis for these differences through a comparative analysis of gap gene circuits from each species.
Quantitative Changes in Conserved Gap Gene Network Structure
Gene circuits encode network structure in an interconnectivity matrix of regulatory parameters (see Materials and Methods). We obtain the qualitative structure of the network by classifying the estimated parameter values into categories (activation, no interaction, and repression) (supplementary figs. S2 and S3, Supplementary Material online). Our analysis confirms that this qualitative network structure is conserved between M. abdita and D. melanogaster (fig. 1B), which is fully consistent with evidence from RNAi knockdown experiments (Wotton, Jiménez-Guri, Crombach, Janssens, et al. 2015). Model analysis reveals that the five basic regulatory principles governing gap gene expression are also conserved: M. abdita gene circuits show gap gene activation by maternal Bcd and zygotic Cad, autoactivation, strong repression between hb/kni and Kr/gt, weaker repression with posterior bias between overlapping gap genes, and repression by terminal gap genes, as in equivalent models for D. melanogaster (supplementary table S4, Supplementary Material online).
Examining the distribution of estimated parameter values more closely, however, we observe marked quantitative differences in interaction strength between the two species (fig. 2F and supplementary fig. S6, Supplementary Material online). Many of the altered interactions affect repression between overlapping gap genes, which governs domain shifts in D. melanogaster (Jaeger, Surkova, et al. 2004; Jaeger 2011; Crombach, Wotton, et al. 2012). Intriguingly, our models predict that these regulatory interactions are often weaker in M. abdita, a result which stands in apparent contradiction to previous experimental work (Wotton, Jiménez-Guri, Crombach, Janssens, et al. 2015). Gene circuit analysis allows us to identify and characterize the precise causal effects of these quantitative changes in interaction strength on the dynamics of gene expression in the complex regulatory context of the whole gap gene network. This enables us to resolve the apparent contradictions between evidence from modeling versus genetic approaches.
A key point to note in this context is that regulatory input to a gap gene not only depends on the values of regulatory parameters. We also need to take into account the local concentration of the corresponding regulators. From the mathematical formulation of the gene circuit model (see Materials and Methods, eq. 3), we see that the regulatory contribution of regulator X on target Y equals the regulatory weight for the corresponding interaction multiplied by the local concentration of regulator X. These regulatory contributions are shown in the graphical analysis of our gene circuit models described in the following sections.
Dynamic hb Boundary Positioned by Ratchet-Like Mechanism
The most salient change in expression dynamics between M. abdita and D. melanogaster involves the posterior boundary of the anterior hb domain (fig. 2C, marked by a star). In D. melanogaster, this boundary remains static around 45% A–P position, a fact which is considered crucial for the robustness of gap gene patterning (Gregor et al. 2007; Liu and Ma 2013; Liu et al. 2013). In M. abdita, on the other hand, it shifts from 52% to 41% A–P position over time (Wotton, Jiménez-Guri, Crombach, Janssens, et al. 2015). Regulatory analysis reveals that this qualitative change in dynamical behavior is caused by a combination of altered initial placement of expression domains and changes in relative repression strength.
Compared with D. melanogaster, the early anterior hb domain extends further posterior in M. abdita—due to the broader distribution of maternal Bcd (Stauber et al. 1999, 2000; Wotton, Jiménez-Guri, Crombach, Janssens, et al. 2015). This results in considerable initial domain overlap between hb and Kr in M. abdita, which is not present in D. melanogaster (fig. 2C and D). The observed shift of the posterior hb boundary occurs within this extended zone of overlap in M. abdita. Our analysis reveals the specific dynamic regulatory mechanisms responsible for this shift. To achieve this, we identify the specific regulatory contributions to hb in the relevant nuclei across time and space, and compare them between M. abdita and D. melanogaster (fig. 3A–D; see also supplementary fig. S8 and supplementary data, Supplementary Material online). We observe in both species that Kr is the main inhibitor of hb in the region spanning the hb boundary. In M. abdita, gradual disappearance of hb due to weak repression by Kr eventually allows kni to become expressed (fig. 3A and C). Kni in turn strongly inhibits hb (figs. 2F and 3C). In contrast, repression of hb by Kr is much stronger in D. melanogaster (fig. 2F). This keeps the overlap between the hb and the Kr domains limited and leads to a stable mutual repression between these two gap genes (fig. 3B and D).
Fig. 3.

Graphical analysis of regulatory interactions involved in positioning the hb boundary. The left column of graphs shows Megaselia abdita, the right column Drosophila melanogaster. (A–D) Plots showing cumulative regulatory contributions of gap genes and external inputs to anterior hb in the region of its posterior boundary. Contributions are shown at time class T1 (A, B) and T8 (C, D). Each colored area corresponds to an individual regulatory term ( or ) in equation (3). Activating contributions are >0.0 and inhibiting contributions <0.0. (E, F) Plots show ratios of activating versus repressive regulatory input on hb, plotted over time for three equidistant nuclei at 40% (solid), 45% (dashed), and 50% (dotted) A–P position (gray lines exclude the additional repressor Kni, which is only active in the posterior-most nucleus at 50%). Light yellow areas indicate activation of hb (>1.0), white areas inhibition (<1.0). Comparing curves in E versus F reveals that Kr is sufficient to trigger hb downregulation in M. abdita, but not in D. melanogaster. (G) Embryos of wild-type (WT) and RNAi-treated M. abdita embryos stained for hb mRNA at time class T5. Embryos are shown in lateral view: Anterior is to the left, dorsal is up. Embryos represent illustrative examples drawn from a quantitative and systematic data set of M. abdita RNAi knockdowns (Wotton, Jiménez-Guri, Crombach, Janssens, et al. 2015).
Temporally regulated repression by Kr (and Kni) is countered by activation of Bcd and Hb. Interspecies differences in the dynamics of the hb boundary are therefore due to differing temporal dynamics in the ratio between overall activation and inhibition. This can be shown explicitly by following this ratio in specific nuclei within the hb boundary over time. The shifting boundary in M. abdita requires a switch from activating to repressing hb, that is, the ratio between activation and inhibition decreases over time (fig. 3E). This is mainly due to gradual repression of hb by Kr, whereas only posterior nuclei show a later repressive contribution by Kni (fig. 3E, compare yellow and gray lines). In contrast, nuclei within the static hb boundary in D. melanogaster maintain their level of activation and/or inhibition, due to stable repression by Kr across the boundary zone, and by Kni further posterior (fig. 3F). Each of these interactions is sufficiently strong to position the hb boundary on its own.
In summary, the extended early overlap of the hb and Kr domains together with a subtle change in the relative strength of hb repression by Kr explains the dynamic positioning of the hb boundary in M. abdita versus its static counterpart in D. melanogaster. The dynamic regulatory mechanism in M. abdita can be described as ratchet-like: Initial repression by Kr primes successive nuclei in the region of the boundary shift to switch irreversibly from hb to kni expression. In contrast, much stronger mutual repression between hb and Kr—similar in magnitude to that between hb and kni—prevents extended domain overlap in D. melanogaster (compare differing vertical scales in fig. 3A and C versus fig. 3B and D; see also supplementary fig. S9 and supplementary data, Supplementary Material online).
Our modeling results suggest that the position of the hb boundary depends on both Kr and Kni in M. abdita, whereas these factors act in a redundant manner in D. melanogaster. These predictions are confirmed by experimental evidence: hb expands posteriorly upon either Kr or kni knockdown in M. abdita (fig. 3G) (Wotton, Jiménez-Guri, Crombach, Janssens, et al. 2015). In contrast, the absence of both factors is necessary to perturb the position of the hb boundary in D. melanogaster (Houchmandzadeh et al. 2002; Clyde et al. 2003; Manu et al. 2009a; Perry et al. 2012; Surkova et al. 2013).
Conserved Mechanisms Regulate the Kr–Kni and kni–Gt Boundary Interfaces
In contrast to the hb boundary described above, the borders of the abdominal kni domain and its overlapping companions—the posterior boundary of central Kr as well as the anterior boundary of posterior gt—exhibit anterior shifts that are conserved between M. abdita and D. melanogaster (fig. 2C and D) (Jaeger, Surkova, et al. 2004; Surkova et al. 2008; Crombach, Wotton, et al. 2012; Wotton, Jiménez-Guri, Crombach, Janssens, et al. 2015). Accordingly, gene circuit analysis reveals that the regulatory mechanisms underlying these shifts are also largely conserved.
For the Kr–kni boundary interface, the anterior shift in border position is caused by a simple asymmetry in repressive interactions: M. abdita gene circuits show strong and increasing inhibition of Kr by Kni, whereas there is little repression of kni by Kr (figs. 2F, 4A, and 4C; see also supplementary fig. S10, Supplementary Material online). The repressive asymmetry is less pronounced in models for D. melanogaster, which employ additional Kr autorepression and kni autoactivation to create the regulatory imbalance between the two genes (figs. 2F, 4B, and 4D; supplementary fig. S11, Supplementary Material online). Such autoregulatory contributions are unlikely to be biologically significant. We do not see these interactions in D. melanogaster gap gene circuits fitted to protein data (Jaeger, Blagov, et al. 2004; Jaeger, Surkova, et al. 2004; Ashyraliyev et al. 2009) and there is no experimental evidence to support their existence (Jaeger 2011). In contrast, repressive imbalance between Kr and kni is strongly supported by experimental evidence in both species. Although Kr expression expands posteriorly in M. abdita embryos treated with kni RNAi, no effect on kni is observed in Kr knockdown embryos (fig. 4E) (Wotton, Jiménez-Guri, Crombach, Janssens, et al. 2015). Similarly, Kr has been reported to expand posteriorly in kni mutants of D. melanogaster (Jäckle et al. 1986; Gaul et al. 1987; Harding and Levine 1988) (although a recent quantitative study failed to detect this effect [Surkova et al. 2013]) whereas kni expression is not affected in Kr mutants (Capovilla et al. 1992; Surkova et al. 2013).
Fig. 4.

Graphical analysis of regulatory interactions involved in positioning the Kr–kni boundary interface. (A–D) Plots show ratios of activating versus repressive regulatory input on Kr (A, B) and kni (C, D) over time in Megaselia abdita (A, C) and Drosophila melanogaster (B, D). Lines indicate equidistant nuclei at 53% (solid), 55% (dashed), and 59% (dotted) A–P position (A, C), and 54% (solid), 56% (dashed), and 58% (dotted) A–P position, respectively (B, D). Green/red colored areas indicate activation of Kr/kni (>1.0), white areas indicate inhibition (<1.0). Despite subtle differences in shift mechanism and dynamics, both M. abdita and D. melanogaster show increasing Kr repression and kni activation over time due to repressive asymmetry between the two genes. See main text for details. (E) Embryos of wild-type (WT) and RNAi-treated M. abdita embryos stained for Kr and kni mRNA at time class T3. Embryos are shown in lateral view: Anterior is to the left, dorsal is up. Embryos represent illustrative examples drawn from a quantitative and systematic data set of M. abdita RNAi knockdowns (Wotton, Jiménez-Guri, Crombach, Janssens, et al. 2015).
In summary, regulation of the kni–gt boundary interface relies on an analogous repressive asymmetry and is also conserved between the two species, despite some differences in strength and timing of interactions: Repression of kni by Gt is stronger than repression of gt by Kni in both species (figs. 2F and 5A–D; supplementary figs. S12 and S13, Supplementary Material online). Experimental evidence supports these modeling predictions. The abdominal kni domain expands posteriorly in M. abdita embryos treated with gt RNAi, whereas posterior gt is not affected in hb RNAi knockdown embryos (fig. 5E) (Wotton, Jiménez-Guri, Crombach, Janssens, et al. 2015). Similarly, the abdominal kni domain expands posteriorly in gt mutants of D. melanogaster (Eldon and Pirrotta 1991). In contrast, no effect on the anterior boundary of the posterior gt domain has been observed in D. melanogaster kni mutants (Mohler et al. 1989; Eldon and Pirrotta 1991; Kraut and Levine 1991; Surkova et al. 2013).
Fig. 5.

Graphical analysis of regulatory interactions involved in positioning the kni–gt boundary interface. (A–D) Plots show ratios of activating versus repressive regulatory input on kni (A, B) and gt (C, D) over time in Megaselia abdita (A, C) and Drosophila melanogaster (B, D). Lines indicate equidistant nuclei at 66% (solid), 68% (dashed), and 70% (dotted) A–P position (A, C), and 65% (solid), 67% (dashed), and 69% (dotted) A–P position, respectively (B, D). Red/blue colored areas indicate activation of kni/gt (>1.0), white areas indicate inhibition (<1.0). Despite subtle differences in shift mechanism and dynamics, both M. abdita and D. melanogaster show increasing kni repression and gt activation over time due to repressive asymmetry between the two genes. See main text for details. (E) Embryos of wild-type (WT) and RNAi-treated M. abdita embryos stained for kni and gt mRNA at time class T5. Embryos are shown in lateral view: Anterior is to the left, dorsal is up. Embryos represent illustrative examples drawn from a quantitative and systematic data set of M. abdita RNAi knockdowns (Wotton, Jiménez-Guri, Crombach, Janssens, et al. 2015).
Altered Two-Phase Mechanism of Posterior Gap Gene Expression
Expression dynamics at the interface of the posterior gt and hb domains differs markedly between M. abdita and D. melanogaster (fig. 2C and D, marked by a diamond). In D. melanogaster, the posterior boundary of the posterior gt domain shifts at a constant rate over time. In contrast, this shift is delayed in M. abdita—due to the absence of maternal Cad (Stauber et al. 2008; Wotton, Jiménez-Guri, and Jaeger 2015; Wotton, Jiménez-Guri, Crombach, Janssens, et al. 2015)—until mid cleavage cycle 14A when it suddenly initiates and then proceeds much faster than in D. melanogaster (fig. 2D). Our models show that this behavior is governed through downregulation of gt by Hb, whose posterior domain appears abruptly in M. abdita (Wotton, Jiménez-Guri, Crombach, Janssens, et al. 2015), whereas it accumulates gradually in D. melanogaster (fig. 6A–F). This dynamic discontinuity is caused by two distinct phases of hb regulation in M. abdita (fig. 6E and supplementary fig. S14, Supplementary Material online; see also summary in fig. 7 and supplementary data, Supplementary Material online). In the first phase, a prolonged, subtle activation by Gt (fig. 2F) boosts hb expression within an extended zone of domain overlap, until a threshold is reached which leads to a sudden increase in hb autoactivation. This initiates the second phase, in which hb acts to maintain its own expression, tilting the regulatory balance toward repression of gt by Hb. This “pull-and-trigger” temporal switch in activating contributions is not observed in D. melanogaster, where Gt represses hb and strong hb autoactivation is already active at earlier stages (fig. 6F and supplementary fig. S15, Supplementary Material online).
Fig. 6.
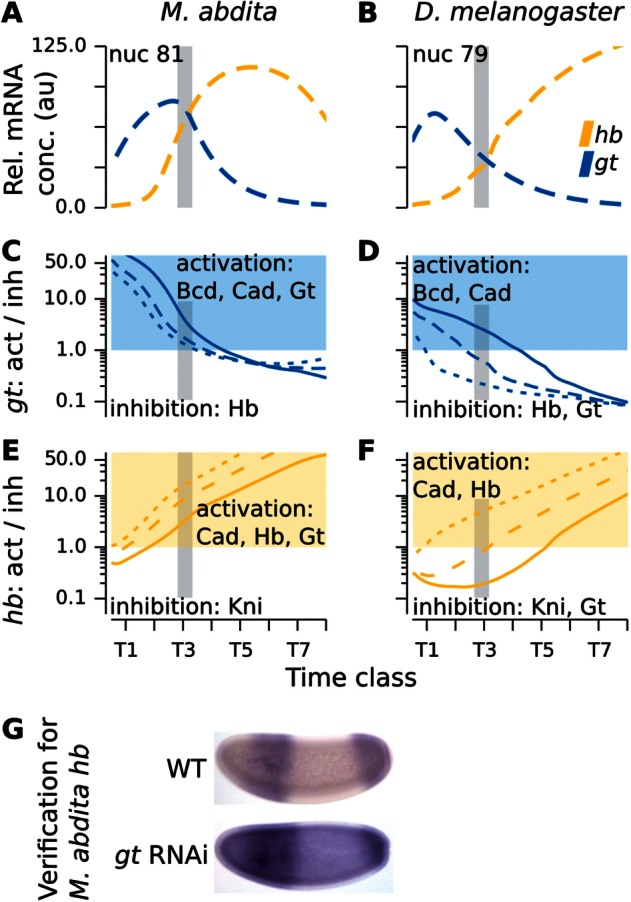
Graphical analysis of regulatory interactions involved in positioning the posterior gt–hb boundary interface. The left column of graphs shows Megaselia abdita, the right column Drosophila melanogaster. (A, B) Plots show relative mRNA concentrations of gt (blue) and hb (yellow) in nuclei at 81% (A) and 79% (B) A–P position. (C–F) Plots show ratios of activating versus repressive regulatory input on gt (C, D) and hb (E, F) over time. Lines indicate equidistant nuclei at 79% (solid), 81% (dashed), and 83% (dotted) A–P position (C, E), and 77% (solid), 79% (dashed), and 81% (dotted) A–P position, respectively (D, F). Blue/yellow colored areas indicate activation of gt/hb (>1.0), white areas indicate inhibition (<1.0). In M. abdita, downregulation of gt and concomitant upregulation of hb occur suddenly around mid cleavage cycle C14A (gray bar), whereas this process is much more gradual in D. melanogaster. (G) Embryos of wild-type (WT) and RNAi-treated M. abdita embryos stained for hb mRNA at time class T3. Embryos are shown in lateral view: Anterior is to the left, dorsal is up. Embryos represent illustrative examples drawn from a quantitative and systematic data set of M. abdita RNAi knockdowns (Wotton, Jiménez-Guri, Crombach, Janssens, et al. 2015).
Fig. 7.

Divergent regulatory mechanisms for dynamic gap boundary placement. The gap gene networks of Megaselia abdita and Drosophila melanogaster exhibit quantitative differences in genetic interactions, which lead to qualitative differences in expression dynamics (shown as comparative 3D space–time plots in the middle). Cartoons on both sides illustrate the regulatory mechanisms underlying these differences: Gray landscapes represent change in cell state; nuclei are shown as circles (color indicating the gap genes they express; see Legend). The posterior boundary of the anterior hb domain (left) is positioned by a “ratchet” mechanism in M. abdita: Repression by Kr primes nuclei for a switch to strong repression by Kni resulting in an anterior shift of the hb boundary over time. In contrast, this boundary is set by a bistable switch mechanism based on mutual repression between hb and Kr/kni in D. melanogaster, resulting in a stationary boundary position. The posterior boundary of the posterior gt domain (right) is positioned through repression by Hb. In M. abdita, posterior hb is upregulated in two phases, by a “pull-and-trigger” mechanism: Initially hb is activated by Gt (the “pull”); later, autoactivation is “triggered” and becomes more dominant. In contrast, hb accumulates gradually in D. melanogaster due to stronger autoactivation at early stages. Yellow arrow indicates differences in the strength of hb autoactivation.
These predictions are confirmed by experimental evidence: Although the posterior hb domain is reduced in M. abdita gt knockdown embryos (fig. 3G) (Wotton, Jiménez-Guri, Crombach, Janssens, et al. 2015), no such effect can be seen in gt mutants of D. melanogaster (Eldon and Pirrotta 1991; Strunk et al. 2001). In addition, our models clarify an ambiguous result from our experimental analysis (Wotton, Jiménez-Guri, Crombach, Janssens, et al. 2015), by establishing that the activation of hb by Gt is likely to be direct and functionally important.
The Role of Domain Overlaps and Regulatory Strength in Cross-Repression
Previous experimental evidence suggests that cross-repression between overlapping gap genes is stronger in M. abdita, as RNAi knockdowns show less ambiguous effects on posterior neighboring domains than the corresponding gap gene mutants in D. melanogaster (Wotton, Jiménez-Guri, Crombach, Janssens, et al. 2015). In the case of Kr and kni, gene circuits confirm that this is caused by stronger asymmetry in the strength of regulatory interactions between these genes. In other cases, however, our models predict weaker gap–gap cross-repression. How can these apparently contradictory conclusions be reconciled?
The problem lies in the assumption that there is a direct and simple connection between sensitivity to RNAi knockdown and network interaction strength as represented by regulatory parameters. Our models, however, reveal a more intricate picture. For both Kr’s role in regulating hb and the posterior gt–hb boundary interface, the relevant regulatory parameter values are smaller in M. abdita than in D. melanogaster. At first sight, this is puzzling. However, the problem is resolved if we consider that weaker repression allows for co-expression of gap genes across larger regions of the embryo. This is reflected in the expression data, which show that gap gene mRNA domains overlap much more extensively in M. abdita than in D. melanogaster, especially during the early stages of expression (Wotton, Jiménez-Guri, Crombach, Janssens, et al. 2015).
The proposed ratchet mechanism for placing the hb boundary as well as the pull-and-trigger mechanism governing two-phase gt–hb dynamics in the posterior in M. abdita both explicitly rely on extensive domain overlaps to function (see previous sections and summary in fig. 7). In contrast, the corresponding mechanisms in D. melanogaster, which are driven by positive feedback, prevent such overlap. In this way, our models reveal that sensitivity to genetic perturbations corresponds to the product of network interaction strength and the spatial extent to which regulators coexist in the embryo.
Gap Domain Shifts Are Sufficient to Account for Compensatory Evolution
We have previously shown that differences in gene expression dynamics—specifically, in the dynamics of gap domain shifts—enable the gap gene network to compensate for differences in upstream regulatory input from altered maternal gradients (Wotton, Jiménez-Guri, Crombach, Janssens, et al. 2015). This leads to gap gene expression patterns that are almost equivalent in both M. abdita and D. melanogaster by the onset of gastrulation (fig. 2C and D). Our experimental work suggested that quantitative changes in gap–gap cross-repression are responsible for the observed differences in shift dynamics. Megaselia abdita gap gene circuits allow us to go beyond such hypotheses in two important ways.
First, gap gene circuits provide explicit regulatory mechanisms for altered domain shifts. They give us causal rather than correlative explanations. Dynamic modeling allows us to explicitly track all simultaneous regulatory interactions across space and time. This cannot be achieved by experimental approaches alone.
Second, our models allow us to test whether the suggested changes in regulatory structure are necessary and sufficient to explain the observed changes in expression dynamics between M. abdita and D. melanogaster. Our analysis clearly demonstrates that this is indeed the case. They reveal that the most important contributions to compensatory regulation come from distinct mechanisms for the placement of the posterior boundary of anterior hb and the dynamic placement of the posterior gt–hb interface (fig. 7).
Discussion
In this article, we have provided a detailed comparative analysis of the regulatory mechanisms for compensatory evolution in the gap gene system of cyclorrhaphan flies. The reverse-engineering method that we used—known as the gene circuit approach—is based on a connectionist formalism, which allows us to extract specific regulatory network structures from spatiotemporal expression data (Reinitz and Sharp 1995; Jaeger, Blagov, et al. 2004; Jaeger, Surkova, et al. 2004; Perkins et al. 2006; Ashyraliyev et al. 2009; Crombach, Wotton, et al. 2012). These gene circuits have been validated through experimental evidence from RNAi knockdowns in M. abdita (Wotton, Jiménez-Guri, Crombach, Janssens, et al. 2015) and genetic mutants in D. melanogaster (see Jaeger 2011, and references therein). Our regulatory analysis of these models provides causal–mechanistic explanations, in terms of dynamic regulatory mechanisms, for the observed differences in gap gene expression dynamics between M. abdita and D. melanogaster.
At first glance, the interspecies differences may appear subtle. However, the fact that we can capture and analyze such subtle changes demonstrates the sensitivity and accuracy of our quantitative approach. Moreover, small expression changes can be as important as large ones. In the case of the hb boundary, the change from stationary to moving boundary implies a qualitatively different dynamic regime for the underlying regulatory mechanism (fig. 7). Similarly, the dynamics of the posterior gt–hb interface involves two qualitatively different phases of dynamic regulation (fig. 7). We have shown that these altered mechanisms are sufficient to explain the observed compensatory dynamics. This kind of compensatory evolution leads to system drift (Weiss and Fullerton 2000; True and Haag 2001; Weiss 2005; Haag 2007; Pavlicev and Wagner 2012). It enables the gap gene networks of both species to produce equivalent patterning outputs despite differing maternal inputs (Wotton, Jiménez-Guri, and Jaeger 2015; Wotton, Jiménez-Guri, Crombach, Janssens, et al. 2015).
In order for system drift to occur, there must be many different network “genotypes” (i.e., regulatory structures or GRNs) that produce the same “phenotype” (patterning outcome). Computer simulations of large ensembles of GRNs show that this is indeed the case (Kauffman 1969; Borenstein and Krakauer 2008; Munteanu and Solé 2008). Not only do such invariant sets of genotypes exist, but theoretical studies also show that most of the regulatory structures contained within them are connected by small mutational steps, forming what are called genotype networks (Ciliberti et al. 2007a, 2007b; Wagner 2008, 2011). A genotype network is a meta-network (a network of distinct GRNs producing the same phenotype) where each genotype is connected to another through the alteration of a single network interaction. Genotype networks provide the substrate for system drift: Evolving regulatory networks can explore a genotype network, modifying and rewiring their structure as they go along, while maintaining a constant patterning output (see Box 1). As the reverse-engineering approach takes into account time-series data representing the entire dynamics of gap gene expression in the blastoderm, our models realize species-specific network structures. These species-specific network structures generate equivalent gap gene expression patterns at gastrulation through different developmental mechanisms, and thereby demonstrate that slight changes to the strength of repressive interactions are sufficient to enable system drift. It is reasonable to assume that such changes can be achieved in relatively few mutational steps. In this way, our results indicate the presence of a genotype network underlying compensatory evolution of gap gene interactions.
System drift based on underlying genotype networks is not only an important mechanism for phenotypically neutral evolution but also an essential prerequisite for evolutionary innovation (and hence evolvability used in the narrow sense of the term, see Box 1) (Wagner and Altenberg 1996; Hendrikse et al. 2007; Pigliucci 2008; Wagner 2008, 2011). The reason for this is that different genotypes have different mutational neighborhoods. Only a subset of structural changes will maintain the output pattern and keep the system on its genotype network. Other mutations will lead to an altered (and potentially adaptive) novel phenotype. Network structures at different positions within a genotype network provide access to different phenotypes in their mutational neighborhood (Wagner 2008, 2011; Jiménez et al. 2015). In this way, drift across a genotype network increases the diversity of accessible novel phenotypes, enabling the evolving system to explore new avenues of evolutionary change.
There is another way in which the regulatory structure of the gap gene network affects its evolvability. Our analysis reveals that some aspects of gap gene expression and regulation are more sensitive to parameter changes than others. The dynamics of domain shifts respond to subtle alterations in regulatory interaction strength. In contrast, the five main principles of gap gene regulation (shown in fig. 1B) are faithfully conserved among cyclorrhaphan flies despite considerable interspecies differences in the strength of regulatory interactions (fig. 2F) (Wotton, Jiménez-Guri, Crombach, Janssens, et al. 2015). These results demonstrate how the regulatory structure of the gap gene network channels the direction of evolutionary change toward drift along the underlying genotype network. More generally, they show how random mutational changes lead to nonrandom changes in the patterning output of the system.
Developmental system drift provides a mechanistic explanation for the developmental hourglass model (Seidel 1960; Sander 1983; Slack et al. 1993; Duboule 1994; Raff 1996). This developmental hourglass implies large variability in regulatory mechanisms at early (and late) embryonic stages, whereas intermediate stages are more constrained (Cruickshank and Wade 2008; Domazet-Lošo and Tautz 2010; Kalinka et al. 2010; Yassin et al. 2010; Quint et al. 2012; Schep and Adryan 2013). Our comparative analysis reveals many differences in maternal inputs and gap gene expression dynamics, whereas the patterning output of the gap gene system at gastrulation time is strongly conserved between M. abdita and D. melanogaster (Wotton, Jiménez-Guri, and Jaeger 2015; Wotton, Jiménez-Guri, Crombach, Cicin-Sain, et al. 2015). The gap gene circuits presented in this article suggest detailed and explicit regulatory mechanisms for these compensatory dynamics. In this sense, our models provide a causal–mechanistic view on the developmental hourglass in early dipteran development.
Our findings highlight the importance of dynamical systems theory for understanding regulatory evolution (Thom 1976; Goodwin 1982; Webster and Goodwin 1996; Manu et al. 2009b; François and Siggia 2012; Jaeger et al. 2012; Jaeger and Monk 2014; Jiménez et al. 2015), in particular how a combination of differences in initial conditions (domain placement) and transient trajectories (expression dynamics) can explain compensatory changes in gene expression. More importantly, they show how subtle quantitative changes in the strength of regulatory interactions can give rise to qualitatively different regimes of expression dynamics (stationary vs. shifting boundary; gradual vs. two-phase shift). The next step will be to understand how such transitions—and hence the evolutionary potential and evolvability of the system—can be explained by the geometry of the underlying configuration space of the models, that is to say by the arrangement of the system’s attractor states, their associated basins, and their bifurcations (Thom 1976; Crombach and Hogeweg 2008; Manu et al. 2009b; François and Siggia 2012; Jaeger et al. 2012; Jaeger and Monk 2014; Jiménez et al. 2015).
Understanding such aspects of regulatory networks, in a quantitative and mechanistic manner, is essential if we are to move beyond the investigation of the role of individual genes toward elucidation of the dynamic principles governing regulatory evolution at the systems level (Jaeger et al. 2015). The integrative approach we have presented here—based on data-driven modeling in nonmodel organisms (Jaeger and Crombach 2012)—provides a prototype for this kind of investigation.
Materials and Methods
We infer the regulatory structure and dynamics of the gap gene network by means of gene circuits, dynamical network models that are fit to quantitative spatiotemporal expression data (Reinitz and Sharp 1995; Reinitz et al. 1995; Jaeger, Blagov, et al. 2004; Jaeger, Surkova, et al. 2004; Perkins et al. 2006; Ashyraliyev et al. 2009; Crombach, Wotton, et al. 2012). Here, we use the gene circuit approach with mRNA data—acquired and processed using efficient, robust protocols and pipelines that work reliably in nonmodel species (Crombach, Cicin-Sain, et al. 2012). We have previously established that these kind of mRNA expression data are sufficient to successfully infer the gap gene network in D. melanogaster (Crombach, Wotton, et al. 2012).
Data Acquisition and Processing
Trunk Gap Genes
Gap gene circuits simulate expression and regulation of the four trunk gap genes hb, Kr, gt, and kni. Integrated mRNA expression data for these genes in D. melanogaster were published previously (Crombach, Wotton, et al. 2012). We constructed an equivalent integrated data set for M. abdita as follows.
Using a compound wide-field microscope, we took brightfield and DIC images of laterally oriented embryos stained for one or two gap genes using an enzymatic (colorimetric) in situ hybridization protocol (Crombach, Wotton, et al. 2012). These images were then processed in three steps (Crombach, Cicin-Sain, et al. 2012): 1) We constructed binary whole-embryo masks by an edge-detection approach; using this mask, we rotated, cropped, and flipped the embryo images such that the A–P axis is horizontal, the anterior pole lies to the left, and dorsal is up; we then extracted raw gene expression intensities from a band along the lateral midline of the embryo covering 10% of the maximum dorsoventral height; 2) we determined the position of gene expression domain boundaries by manually fitting clamped splines to the raw data; and 3) finally, embryos were assigned to cleavage cycles C1–C14A based on the number of nuclei; cleavage cycle C14A was further subdivided into eight time classes (T1–T8, each about 7 min long) based on membrane morphology as described in Wotton et al. (2014). Manual steps, such as spline fitting and time classification, are carried out by two researchers independently to detect and avoid bias. A detailed quantitative description and analysis of the resulting set of M. abdita gap gene expression boundaries is provided elsewhere (Wotton, Jiménez-Guri, Crombach, Cicin-Sain, et al. 2015; Wotton, Jiménez-Guri, Crombach, Janssens, et al. 2015).
We used the extracted domain boundaries to create an integrated spatiotemporal expression data set. We achieved this by computing median expression boundary positions for each gene and time class for which we have data (Crombach, Wotton, et al. 2012). During data processing, gap gene mRNA expression levels are normalized to the range [0.0, 1.0]. Because the gradual buildup and subsequent degradation of gap gene products is an important aspect of gap gene expression dynamics (Jaeger et al. 2007; Surkova et al. 2008; Becker et al. 2013), we rescale these levels over space and time to create an expression data set that is comparable to previous mRNA data sets from D. melanogaster (Crombach, Wotton, et al. 2012).
Embryo images, raw profiles, extracted boundaries, and integrated expression profiles for both fly species are available from the SuperFly database (http://superfly.crg.eu, last accessed February 8, 2016) (Cicin-Sain et al. 2015).
External Inputs
Gap gene circuits require expression data for maternal coordinate genes bcd and cad, and the terminal gap genes tll and hkb, as external regulatory inputs. Drosophila melanogaster data for these factors were described previously (Crombach, Wotton, et al. 2012). For M. abdita, see supplementary figure S1 and supplementary data, Supplementary Material online. In brief, the profile of M. abdita Cad protein is derived from immunostainings. Because we were unable to raise an antibody against M. abdita Bcd, we inferred its graded distribution through a simple model of protein diffusion from its localized mRNA source. We used mRNA data for M. abdita tll and hkb as we did for previous mRNA-based models for D. melanogaster (Crombach, Wotton, et al. 2012).
Gene Circuit Models
Gene circuits are mathematical models for simulating the regulatory dynamics of gene networks (Mjolsness et al. 1991; Reinitz and Sharp 1995; Reinitz et al. 1995; Jaeger, Blagov, et al. 2004; Jaeger, Surkova, et al. 2004; Perkins et al. 2006; Ashyraliyev et al. 2009; Crombach, Wotton, et al. 2012). Gene circuits are hybrid models: Continuous gene expression dynamics during interphase are complemented by discrete nuclear divisions between cleavage cycles.
Continuous gene regulatory dynamics are encoded by sets of ordinary differential equations (ODEs), each of which describes the change in concentration for a specific gene product g over time t in a particular nucleus i along the A–P axis (fig. 2B):
| (1) |
with , G = {hb, Kr, gt, kni}; regulated mRNA synthesis at maximum rate R; diffusion of gap gene products between neighboring nuclei (diffusion rate D(n) depends on nuclear density and hence the number of preceding mitoses n); and gene product degradation at rate λ. The saturating nature of gene regulation is captured by the sigmoid response function :
| (2) |
where
| (3) |
with the trunk gap genes G defined as above; the external inputs as M = {Bcd, Cad, Tll, Hkb}; and ubiquitous maternal activating or repressing factors represented by threshold parameter h. Interconnectivity matrices W and E define genetic interactions between the gap genes, and between external inputs and the gap genes, respectively.
Gene circuits cover the time from the initiation of gap gene expression to the onset of gastrulation: From C12 to the end of C14A (at t = 98.667 min) in M. abdita, from C13 to the end of C14A (at t = 71.100 min) in D. melanogaster. Mitotic division schedules are based on Wotton et al. (2014) for M. abdita and Crombach, Wotton, et al. (2012) for D. melanogaster (supplementary table S2, Supplementary Material online). At each division, the number of nuclei, and hence the number of ODEs, doubles, whereas the distance between nuclei is halved. Nuclei are represented as a one-dimensional array along the A–P axis, covering the trunk region of the embryo (30–91% A–P position for M. abdita; 35–87% for D. melanogaster, 0% is at the anterior pole). Spatial ranges were chosen in accordance with earlier D. melanogaster models (Ashyraliyev et al. 2009; Crombach, Wotton, et al. 2012) to represent an equivalent set of a gap domains in each species.
Box 1.
Glossary/Definitions.
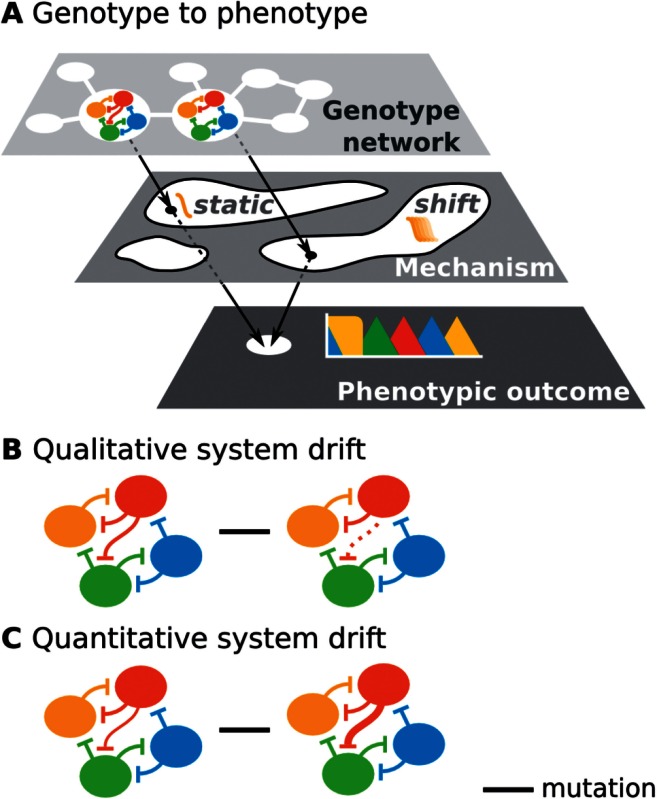
Evolvability can be defined in different ways (Pigliucci 2008). In its narrow sense, it describes an evolving system’s propensity for phenotypic innovation; therefore, it has also been called “innovability” in this context (Wagner 2011). Here, we use it in a more general sense, indicating the capacity of a developmental system to evolve (Hendrikse et al. 2007). More specifically, the evolvability of a system reflects the fact that its underlying regulatory network implements a specific set or range of developmental mechanisms, and determines the probability of mutational transitions between them. By a developmental mechanism, we mean a collection of regulators and their interactions that generate a reproducible transition from given initial conditions to a specific final state (Machamer et al. 2000; Jaeger and Sharpe 2014). Developmental mechanisms are therefore dynamic regulatory mechanisms. They provide causal explanations of how a genotype produces a phenotype (fig. A, Box 1). In this context, genotype represents the regulatory structure of network: Its components and their interactions; phenotype represents the patterning output of the system.
The evolution of developmental mechanisms involves changes in the set of regulators, or changes in their interactions. Such mutational changes can either affect the phenotype of the system or leave it unchanged. System drift denotes a mode of network evolution whereby the structure of the network is altered, whereas the phenotypic output remains constant (Weiss and Fullerton 2000; True and Haag 2001; Weiss 2005; Haag 2007; Pavlicev and Wagner 2012). We distinguish between quantitative system drift, which affects the strength of regulatory interactions, and qualitative drift, which involves recruitment, loss, or exchange of network components as well as rewiring of network structure, either by adding or subtracting interactions, or by changing their signs (activation to repression, or vice versa) (see fig. B and C, Box 1, and Weiss and Fullerton 2000; True and Haag 2001; Weiss 2005; Wotton, Jiménez-Guri, Crombach, Janssens, et al. 2015). It is enabled by the presence of genotype networks (Wagner 2011; Jaeger and Monk 2014), consisting of a set of regulatory network structures that produce the same phenotype, and are connected through small mutational steps (see fig. A, Box 1). In this article, we examine what kind of regulatory changes produce such a genotype network for the gap gene system in dipteran insects.
Model Fitting
We fit gene circuit models to quantitative expression data from both M. abdita and D. melanogaster as described previously (Crombach, Wotton, et al. 2012). In brief, the values of gene circuit parameters are estimated by means of a robust global optimization algorithm called parallel Lam Simulated Annealing (pLSA) (Chu et al. 1999). pLSA iteratively approximates the minimum of a cost function which represents the difference between model output and expression profiles in the data (fig. 2B). We have previously established that a Weighted Least Squares cost function—with artificial weights that are inversely proportional to expression levels, thus strongly penalizing ectopic expression—is effective at fitting gene circuits to mRNA gap gene expression data in D. melanogaster (Ashyraliyev et al. 2009; Crombach, Wotton, et al. 2012). Further details on the optimization procedure can be found in supplementary data, Supplementary Material online.
Model fitting was performed on the Mare Nostrum supercomputer at the Barcelona Supercomputing Centre (http://www.bsc.es, last accessed February 8, 2016). The average duration of a pLSA run on 64 cores is approximately 45 min. For M. abdita, we performed series of global optimization runs—comprising 1,650 independent model fits in total—that cover a number of different scenarios: Estimated Bcd gradients with different scales, circuits with and without diffusion or autoregulation, and circuits fitted while not fixing threshold parameters h (see supplementary table S3, Supplementary Material online). We also obtained a reference set of 225 D. melanogaster gap gene circuits. These models differ slightly from those published previously (Crombach, Wotton, et al. 2012) as they use an approximation for the Bcd gradient equivalent to that used in gene circuits for M. abdita.
Selection of Gene Circuits for Analysis
All 225 D. melanogater circuits, and the best-fitting scenario for M. abdita (400 circuits; see supplementary data, Supplementary Material online), were chosen for further analysis. These circuits were then subjected to the following quality tests. Numerically unstable circuits were discarded, as were all fits with a root-mean-square score larger than 30.0 (Crombach, Wotton, et al. 2012). The remaining gene circuits were visually inspected for defects in gene expression profiles (see supplementary data, Supplementary Material online for details). This selection process resulted in 20 solutions in each species. Their expression dynamics are shown in supplementary figure S5, Supplementary Material online.
Computational Tools
Image processing and extraction/measurement of expression domain boundary positions was performed with the Java application FlyGUI (https://subversion.assembla.com/svn/flygui, last accessed February 8, 2016) (Crombach, Cicin-Sain, et al. 2012). Our gene expression data sets are available from the SuperFly website (http://superfly.crg.eu) (Cicin-Sain et al. 2015), and from Figshare (Wotton, Jiménez-Guri, Crombach, Cicin-Sain, et al. 2015). Simulation and optimization code is implemented in C, using MPI for parallelization, SUNDIALS (http://computation.llnl.gov/casc/sundials) for numerical solvers (Hindmarsh et al. 2005), and the GNU Scientific Library (GSL, http://www.gnu.org/software/gsl) for data interpolation (https://subversion.assembla.com/svn/flysa).
Supplementary Material
Supplementary material, figures S1–S15, and tables S1–S4 are available at Molecular Biology and Evolution online (http://www.mbe.oxfordjournals.org/).
Acknowledgments
The authors thank Urs Schmidt-Ott and Steffen Lemke for crucial help and support to get them off the ground with M. abdita; Brenda Gavilán and Núria Bosch Guiteras for help with maintaining the M. abdita culture; and Damjan Cicin-Sain, Toni Hermoso Pulido, and the CRG Bioinformatics Core for computational support. John Reinitz, James Sharpe, Ben Lehner, Erik Clark, Hilde Janssens, Berta Verd, and Simone Reber provided useful feedback on the manuscript. Adam Wilkins provided essential editing and intellectual arguments to improve the presentation of our argument. The authors thankfully acknowledge the computer resources, technical expertise and assistance provided by the Barcelona Supercomputing Center—Centro Nacional de Supercomputación. This work was supported by the MEC-EMBL agreement for the EMBL/CRG Research Unit in Systems Biology, European Commission grant FP7-KBBE-2011-5/289434 (BioPreDyn), Grant 153 (MOPDEV) of the ERANet: ComplexityNET program, AGAUR SGR Grant 406, as well as grants BFU2009-10184 and BFU2012-33775 from MINECO. The Centre for Genomic Regulation (CRG) acknowledges support from MINECO, “Centro de Excelencia Severo Ochoa 2013-2017,” SEV-2012-0208.
References
- Alberch P. 1991. From genes to phenotype: dynamical systems and evolvability. Genetica 84:5–11. [DOI] [PubMed] [Google Scholar]
- Arthur W. 2002. The emerging conceptual framework of evolutionary developmental biology. Nature 415:757–764. [DOI] [PubMed] [Google Scholar]
- Ashyraliyev M, Siggens K, Janssens H, Blom J, Akam M, Jaeger J. 2009. Gene circuit analysis of the terminal gap gene huckebein. PLoS Comput Biol. 5:e1000548. [DOI] [PMC free article] [PubMed] [Google Scholar]
- Becker K, Balsa-Canto E, Cicin-Sain D, Hoermann A, Janssens H, Banga JR, Jaeger J. 2013. Reverse-engineering post-transcriptional regulation of gap genes in Drosophila melanogaster. PLoS Comput Biol. 9:e1003281. [DOI] [PMC free article] [PubMed] [Google Scholar]
- Borenstein E, Krakauer DC. 2008. An end to endless forms: epistasis, phenotype distribution bias, and nonuniform evolution. PLoS Comput Biol. 4:e1000202. [DOI] [PMC free article] [PubMed] [Google Scholar]
- Britten RJ, Davidson EH. 1969. Gene regulation for higher cells: a theory. Science 165:349–357. [DOI] [PubMed] [Google Scholar]
- Capovilla M, Eldon ED, Pirrotta V. 1992. The giant gene of Drosophila encodes a b-ZIP DNA-binding protein that regulates the expression of other segmentation gap genes. Development 114:99–112. [DOI] [PubMed] [Google Scholar]
- Chu K-W, Deng Y, Reinitz J. 1999. Parallel simulated annealing by mixing of states. J Comput Phys. 148:646–662. [Google Scholar]
- Cicin-Sain D, Pulido AH, Crombach A, Wotton KR, Jiménez-Guri E, Taly J-F, Roma G, Jaeger J. 2015. SuperFly: a comparative database for quantified spatio-temporal gene expression patterns in early dipteran embryos. Nucleic Acids Res. 43:D751–D755. [DOI] [PMC free article] [PubMed] [Google Scholar]
- Ciliberti S, Martin OC, Wagner A. 2007a. Innovation and robustness in complex regulatory gene networks. Proc Natl Acad Sci U S A. 104:13591–13596. [DOI] [PMC free article] [PubMed] [Google Scholar]
- Ciliberti S, Martin OC, Wagner A. 2007b. Robustness can evolve gradually in complex regulatory gene networks with varying topology. PLoS Comput Biol. 3:0164–0173. [DOI] [PMC free article] [PubMed] [Google Scholar]
- Clyde DE, Corado MSG, Wu X, Paré A, Papatsenko D, Small S. 2003. A self-organizing system of repressor gradients establishes segmental complexity in Drosophila. Nature 426:849–853. [DOI] [PubMed] [Google Scholar]
- Cotterell J, Sharpe J. 2010. An atlas of gene regulatory networks reveals multiple three-gene mechanisms for interpreting morphogen gradients. Mol Syst Biol. 6:425. [DOI] [PMC free article] [PubMed] [Google Scholar]
- Crombach A, Cicin-Sain D, Wotton KR, Jaeger J. 2012. Medium-throughput processing of whole mount in situ hybridisation experiments into gene expression domains. PLoS One 7:e46658. [DOI] [PMC free article] [PubMed] [Google Scholar]
- Crombach A, García-Solache MA, Jaeger J. 2014. Evolution of early development in dipterans: reverse-engineering the gap gene network in the moth midge Clogmia albipunctata (Psychodidae). BioSystems 123:74–85. [DOI] [PubMed] [Google Scholar]
- Crombach A, Hogeweg P. 2008. Evolution of evolvability in gene regulatory networks. PLoS Comput Biol. 4:e1000112. [DOI] [PMC free article] [PubMed] [Google Scholar]
- Crombach A, Wotton KR, Cicin-Sain D, Ashyraliyev M, Jaeger J. 2012. Efficient reverse-engineering of a developmental gene regulatory network. PLoS Comput Biol. 8:e1002589. [DOI] [PMC free article] [PubMed] [Google Scholar]
- Cruickshank T, Wade MJ. 2008. Microevolutionary support for a developmental hourglass: gene expression patterns shape sequence variation and divergence in Drosophila. Evol Dev. 10:583–590. [DOI] [PubMed] [Google Scholar]
- Davidson EH, Erwin DH. 2006. Gene regulatory networks and the evolution of animal body plans. Science 311:796–800. [DOI] [PubMed] [Google Scholar]
- Domazet-Lošo T, Tautz D. 2010. A phylogenetically based transcriptome age index mirrors ontogenetic divergence patterns. Nature 468:815–818. [DOI] [PubMed] [Google Scholar]
- Draghi JA, Parsons TL, Wagner GP, Plotkin JB. 2010. Mutational robustness can facilitate adaptation. Nature 463:353–355. [DOI] [PMC free article] [PubMed] [Google Scholar]
- Duboule D. 1994. Temporal colinearity and the phylotypic progression: a basis for the stability of a vertebrate Bauplan and the evolution of morphologies through heterochrony. Dev Suppl. 42:135–142. [PubMed] [Google Scholar]
- Eldon ED, Pirrotta V. 1991. Interactions of the Drosophila gap gene giant with maternal and zygotic pattern-forming genes. Development 111:367–378. [DOI] [PubMed] [Google Scholar]
- Erwin DH, Davidson EH. 2009. The evolution of hierarchical gene regulatory networks. Nat Rev Genet. 10:141–148. [DOI] [PubMed] [Google Scholar]
- François P, Siggia ED. 2012. Phenotypic models of evolution and development: geometry as destiny. Curr Opin Genet Dev. 22:627–633. [DOI] [PMC free article] [PubMed] [Google Scholar]
- García-Solache M, Jaeger J, Akam M. 2010. A systematic analysis of the gap gene system in the moth midge Clogmia albipunctata. Dev Biol. 344:306–318. [DOI] [PubMed] [Google Scholar]
- Gaul U, Seifert E, Schuh R, Jäckle H. 1987. Analysis of Krüppel protein distribution during early Drosophila development reveals posttranscriptional regulation. Cell 50:639–647. [DOI] [PubMed] [Google Scholar]
- Goltsev Y, Hsiong W, Lanzaro G, Levine M. 2004. Different combinations of gap repressors for common stripes in Anopheles and Drosophila embryos. Dev Biol. 275:435–446. [DOI] [PubMed] [Google Scholar]
- Goodwin BC. 1982. Development and evolution. J Theor Biol. 97:43–55. [DOI] [PubMed] [Google Scholar]
- Gregor T, Tank DW, Wieschaus EF, Bialek W. 2007. Probing the limits to positional information. Cell 130:153–164. [DOI] [PMC free article] [PubMed] [Google Scholar]
- Haag ES. 2007. Compensatory vs. pseudocompensatory evolution in molecular and developmental interactions. Genetica 129:45–55. [DOI] [PubMed] [Google Scholar]
- Harding K, Levine M. 1988. Gap genes define the limits of antennapedia and bithorax gene expression during early development in Drosophila. Embo J. 7:205–214. [DOI] [PMC free article] [PubMed] [Google Scholar]
- Hare EE, Peterson BK, Iyer VN, Meier R, Eisen MB. 2008. Sepsid even-skipped enhancers are functionally conserved in Drosophila despite lack of sequence conservation. PLoS Genet. 4:e1000106. [DOI] [PMC free article] [PubMed] [Google Scholar]
- Hendrikse JL, Parsons TE, Hallgrímsson B. 2007. Evolvability as the proper focus of evolutionary developmental biology. Evol Dev. 9:393–401. [DOI] [PubMed] [Google Scholar]
- Hindmarsh AC, Brown PN, Grant KE, Lee SL, Serban R, Shumaker DE, Woodward CS. 2005. SUNDIALS: suite of nonlinear and differential/algebraic equation solvers. ACM Trans Math Softw. 31:363–396. [Google Scholar]
- Houchmandzadeh B, Wieschaus E, Leibler S. 2002. Establishment of developmental precision and proportions in the early Drosophila embryo. Nature 415:798–802. [DOI] [PubMed] [Google Scholar]
- Hoyos E, Kim K, Milloz J, Barkoulas M, Pénigault JB, Munro E, Félix MA. 2011. Quantitative variation in autocrine signaling and pathway crosstalk in the Caenorhabditis vulval network. Curr Biol. 21:527–538. [DOI] [PMC free article] [PubMed] [Google Scholar]
- Jäckle H, Tautz D, Schuh R, Seifert E, Lehmann R. 1986. Cross-regulatory interactions among the gap genes of Drosophila. Nature 324:668–670. [Google Scholar]
- Jaeger J. 2011. The gap gene network. Cell Mol Life Sci. 68:243–274. [DOI] [PMC free article] [PubMed] [Google Scholar]
- Jaeger J, Blagov M, Kosman D, Kozlov KN, Manu, Myasnikova E, Surkova S, Vanario-Alonso CE, Samsonova M, Sharp DH, et al. 2004. Dynamical analysis of regulatory interactions in the gap gene system of Drosophila melanogaster. Genetics 167:1721–1737. [DOI] [PMC free article] [PubMed] [Google Scholar]
- Jaeger J, Crombach A. 2012. Life’s attractors In: Soyer OS, editor. Evolutionary systems biology. New York: Springer; p. 93–119. [Google Scholar]
- Jaeger J, Irons D, Monk N. 2012. The inheritance of process: a dynamical systems approach. J Exp Zool B Mol Dev Evol. 318:591–612. [DOI] [PubMed] [Google Scholar]
- Jaeger J, Laubichler M, Callebaut W. 2015. The comet cometh: evolving developmental systems. Biol Theory. 10:36–49. [DOI] [PMC free article] [PubMed] [Google Scholar]
- Jaeger J, Monk N. 2014. Bioattractors: dynamical systems theory and the evolution of regulatory processes. J Physiol. 592:2267–2281. [DOI] [PMC free article] [PubMed] [Google Scholar]
- Jaeger J, Sharp DH, Reinitz J. 2007. Known maternal gradients are not sufficient for the establishment of gap domains in Drosophila melanogaster. Mech Dev. 124:108–128. [DOI] [PMC free article] [PubMed] [Google Scholar]
- Jaeger J, Sharpe J. 2014. On the concept of mechanism in development In: Minelli A, Pradeu T, editors. Towards a theory of development. Oxford: Oxford University Press; p. 56. [Google Scholar]
- Jaeger J, Surkova S, Blagov M, Janssens H, Kosman D, Kozlov KN, Manu, Myasnikova E, Vanario-Alonso CE, Samsonova M, et al. 2004. Dynamic control of positional information in the early Drosophila embryo. Nature 430:368–371. [DOI] [PubMed] [Google Scholar]
- Jiménez A, Munteanu A, Sharpe J. 2015. Dynamics of gene circuits shapes evolvability. Proc Natl Acad Sci U S A 112(7):2103–2108. [DOI] [PMC free article] [PubMed] [Google Scholar]
- Kalinka AT, Varga KM, Gerrard DT, Preibisch S, Corcoran DL, Jarrells J, Ohler U, Bergman CM, Tomancak P. 2010. Gene expression divergence recapitulates the developmental hourglass model. Nature 468:811–814. [DOI] [PubMed] [Google Scholar]
- Kauffman SA. 1969. Metabolic stability and epigenesis in randomly constructed genetic nets. J Theor Biol. 22:437–467. [DOI] [PubMed] [Google Scholar]
- Kauffman SA. 1994. The origins of order; self organization and selection in evolution. Oxford: Oxford University Press. [Google Scholar]
- Klomp J, Athy D, Kwan CW, Bloch NI, Sandmann T, Lemke S, Schmidt-Ott U. 2015. A cysteine-clamp gene drives embryo polarity in the midge Chironomus. Science 348:1040–1042. [DOI] [PMC free article] [PubMed] [Google Scholar]
- Kraut R, Levine M. 1991. Spatial regulation of the gap gene giant during Drosophila development. Development 111:601–609. [DOI] [PubMed] [Google Scholar]
- Lemke S, Busch SE, Antonopoulos DA, Meyer F, Domanus MH, Schmidt-Ott U. 2010. Maternal activation of gap genes in the hover fly Episyrphus. Development 137:1709–1719. [DOI] [PubMed] [Google Scholar]
- Lemke S, Schmidt-Ott U. 2009. Evidence for a composite anterior determinant in the hover fly Episyrphus balteatus (Syrphidae), a cyclorrhaphan fly with an anterodorsal serosa anlage. Development 136:117–127. [DOI] [PubMed] [Google Scholar]
- Liu F, Morrison AH, Gregor T. 2013. Dynamic interpretation of maternal inputs by the Drosophila segmentation gene network. Proc Natl Acad Sci U S A. 110:6724–6729. [DOI] [PMC free article] [PubMed] [Google Scholar]
- Liu J, Ma J. 2013. Uncovering a dynamic feature of the transcriptional regulatory network for anterior-posterior patterning in the Drosophila embryo. PLoS One 8:e62641. [DOI] [PMC free article] [PubMed] [Google Scholar]
- Machamer P, Darden L, Craver CF. 2000. Thinking about mechanisms. Philos Sci. 67:1. [Google Scholar]
- Manu, Surkova S, Spirov AV, Gursky VV, Janssens H, Kim AR, Radulescu O, Vanario-Alonso CE, Sharp DH, Samsonova M, et al. 2009a. Canalization of gene expression in the Drosophila blastoderm by gap gene cross regulation. PLoS Biol. 7:0591–0603. [DOI] [PMC free article] [PubMed] [Google Scholar]
- Manu, Surkova S, Spirov AV, Gursky VV, Janssens H, Kim AR, Radulescu O, Vanario-Alonso CE, Sharp DH, Samsonova M, et al. 2009b. Canalization of gene expression and domain shifts in the Drosophila blastoderm by dynamical attractors. PLoS Comput Biol. 5:e1000303. [DOI] [PMC free article] [PubMed] [Google Scholar]
- McGregor AP, Shaw PJ, Dover GA. 2001. Sequence and expression of the hunchback gene in Lucilia sericata: a comparison with other Dipterans. Dev Genes Evol. 211:315–318. [DOI] [PubMed] [Google Scholar]
- Mjolsness E, Sharp DH, Reinitz J. 1991. A connectionist model of development. J Theor Biol. 152:429–453. [DOI] [PubMed] [Google Scholar]
- Mohler J, Eldon ED, Pirrotta V. 1989. A novel spatial transcription pattern associated with the segmentation gene, giant, of Drosophila. Embo J. 8:1539–1548. [DOI] [PMC free article] [PubMed] [Google Scholar]
- Munteanu A, Solé RV. 2008. Neutrality and robustness in evo-devo: emergence of lateral inhibition. PLoS Comput Biol. 4:e1000226. [DOI] [PMC free article] [PubMed] [Google Scholar]
- Pavlicev M, Wagner GP. 2012. A model of developmental evolution: selection, pleiotropy and compensation. Trends Ecol Evol. 27:316–322. [DOI] [PubMed] [Google Scholar]
- Perkins TJ, Jaeger J, Reinitz J, Glass L. 2006. Reverse engineering the gap gene network of Drosophila melanogaster. PLoS Comput Biol. 2:e51. [DOI] [PMC free article] [PubMed] [Google Scholar]
- Perry MW, Bothma JP, Luu RD, Levine M. 2012. Precision of hunchback expression in the Drosophila embryo. Curr Biol. 22:2247–2252. [DOI] [PMC free article] [PubMed] [Google Scholar]
- Peter I, Davidson E. 2011. Evolution of gene regulatory networks that control embryonic development of the body plan. Cell 144:970–985. [DOI] [PMC free article] [PubMed] [Google Scholar]
- Peter I, Davidson EH. 2015. Genomic control process. Oxford: Academic Press. [Google Scholar]
- Pigliucci M. 2008. Is evolvability evolvable? Nat Rev Genet. 9:75–82. [DOI] [PubMed] [Google Scholar]
- Quint M, Drost H-G, Gabel A, Ullrich KK, Bönn M, Grosse I. 2012. A transcriptomic hourglass in plant embryogenesis. Nature 490:98–101. [DOI] [PubMed] [Google Scholar]
- Raff RAV. 1996. The shape of life: genes, development, and the evolution of animal form. Chicago (IL: ): University of Chicago Press. [Google Scholar]
- Rafiqi AM, Lemke S, Schmidt-Ott U. 2011. The scuttle fly Megaselia abdita (Phoridae): a link between Drosophila and mosquito development. Cold Spring Harb Protoc. 6:pdb.emo143. [DOI] [PubMed] [Google Scholar]
- Reinitz J, Mjolsness E, Sharp DH. 1995. Model for cooperative control of positional information in Drosophila by bicoid and maternal hunchback. J Exp Zool. 271:47–56. [DOI] [PubMed] [Google Scholar]
- Reinitz J, Sharp DH. 1995. Mechanism of eve stripe formation. Mech Dev. 49:133–158. [DOI] [PubMed] [Google Scholar]
- Rohr KB, Tautz D, Sander K. 1999. Segmentation gene expression in the mothmidge Clogmia albipunctata (Diptera, Psychodidae) and other primitive dipterans. Dev Genes Evol. 209:145–154. [DOI] [PubMed] [Google Scholar]
- Salazar-Ciudad I, Marín-Riera M. 2013. Adaptive dynamics under development-based genotype-phenotype maps. Nature 497:361–364. [DOI] [PubMed] [Google Scholar]
- Sander K. 1983. Development and evolution. Cambridge: Cambridge University Press. [Google Scholar]
- Schep AN, Adryan B. 2013. A comparative analysis of transcription factor expression during metazoan embryonic development. PLoS One 8:e66826. [DOI] [PMC free article] [PubMed] [Google Scholar]
- Seidel F. 1960. Körpergrundgestalt und Keimstruktur. Eine Erörterung über die Grundlagen der vergleichenden und experimentellen Embryologie und deren Gültigkeit bei phylogenetischen Berlegungen. Zool Anz. 164:245–305. [Google Scholar]
- Slack JM, Holland PW, Graham CF. 1993. The zootype and the phylotypic stage. Nature 361:490–492. [DOI] [PubMed] [Google Scholar]
- Smith JM, Burian R, Kauffman S, Alberch P, Campbell J, Goodwin B, Lande R, Raup D, Wolpert L. 1985. Developmental constraints and evolution: a perspective from the mountain lake conference on development and evolution. Q Rev Biol. 60:265. [Google Scholar]
- Sommer R, Tautz D. 1991. Segmentation gene expression in the housefly Musca domestica. Development 113:419–430. [DOI] [PubMed] [Google Scholar]
- Sorrells TR, Johnson AD. 2015. Making sense of transcription networks. Cell 161:714–723. [DOI] [PMC free article] [PubMed] [Google Scholar]
- Stauber M, Jäckle H, Schmidt-Ott U. 1999. The anterior determinant bicoid of Drosophila is a derived Hox class 3 gene. Proc Natl Acad Sci U S A. 96:3786–3789. [DOI] [PMC free article] [PubMed] [Google Scholar]
- Stauber M, Lemke S, Schmidt-Ott U. 2008. Expression and regulation of caudal in the lower cyclorrhaphan fly Megaselia. Dev Genes Evol. 218:81–87. [DOI] [PMC free article] [PubMed] [Google Scholar]
- Stauber M, Taubert H, Schmidt-Ott U. 2000. Function of bicoid and hunchback homologs in the basal cyclorrhaphan fly Megaselia (Phoridae). Proc Natl Acad Sci U S A. 97:10844–10849. [DOI] [PMC free article] [PubMed] [Google Scholar]
- Stern DL, Orgogozo V. 2008. The loci of evolution: how predictable is genetic evolution? Evolution (NY) 62:2155–2177. [DOI] [PMC free article] [PubMed] [Google Scholar]
- Stern DL, Orgogozo V. 2009. Is genetic evolution predictable? Science 323:746–751. [DOI] [PMC free article] [PubMed] [Google Scholar]
- Strunk B, Struffi P, Wright K, Pabst B, Thomas J, Qin L, Arnosti DN. 2001. Role of CtBP in transcriptional repression by the Drosophila giant protein. Dev Biol. 239:229–240. [DOI] [PubMed] [Google Scholar]
- Surkova S, Golubkova E, Manu, Panok L, Mamon L, Reinitz J, Samsonova M. 2013. Quantitative dynamics and increased variability of segmentation gene expression in the Drosophila Kruppel and knirps mutants. Dev Biol. 376:99–112. [DOI] [PubMed] [Google Scholar]
- Surkova S, Kosman D, Kozlov K, Manu, Myasnikova E, Samsonova AA, Spirov A, Vanario-Alonso CE, Samsonova M, Reinitz J. 2008. Characterization of the Drosophila segment determination morphome. Dev Biol. 313:844–862. [DOI] [PMC free article] [PubMed] [Google Scholar]
- Thom R. 1976. Structural stability and morphogenesis. Perseus Books Group; Boulder (CO): Westview Press. [Google Scholar]
- True JR, Haag ES. 2001. Developmental system drift and flexibility in evolutionary trajectories. Evol Dev. 3:109–119. [DOI] [PubMed] [Google Scholar]
- Waddington CH. 1957. The strategy of the genes. London: George Allen & Unwin. [Google Scholar]
- Wagner A. 2008. Robustness and evolvability: a paradox resolved. Proc Biol Sci. 275:91–100. [DOI] [PMC free article] [PubMed] [Google Scholar]
- Wagner A. 2011. The origins of evolutionary innovations: a theory of transformative change in living systems. Oxford: Oxford University Press [Google Scholar]
- Wagner GP. 2014. Homology, genes, and evolutionary innovation. Princeton (NJ: ): Princeton University Press. [Google Scholar]
- Wagner GP, Altenberg L. 1996. Perspective: complex adaptations and the evolution of evolvability. Evolution (NY) 50:967–976. [DOI] [PubMed] [Google Scholar]
- Webster G, Goodwin BC. 1996. Form and transformation: generative and relational principles in biology. Cambridge: Cambridge University Press. [Google Scholar]
- Weiss KM. 2005. The phenogenetic logic of life. Nat Rev Genet. 6:36–45. [DOI] [PubMed] [Google Scholar]
- Weiss KM, Fullerton SM. 2000. Phenogenetic drift and the evolution of genotype-phenotype relationships. Theor Popul Biol. 57:187–195. [DOI] [PubMed] [Google Scholar]
- Wilke CO. 2006. Robustness and evolvability in living systems. Princeton (NJ: ): Princeton University Press. [Google Scholar]
- Wilkins AS. 2005. Recasting developmental evolution in terms of genetic pathway and network evolution … and the implications for comparative biology. Brain Res Bull. 66:495–509. [DOI] [PubMed] [Google Scholar]
- Wilkins AS. 2007a. Between “design” and “bricolage”: genetic networks, levels of selection, and adaptive evolution. Proc Natl Acad Sci U S A. 104(Suppl):8590–8596. [DOI] [PMC free article] [PubMed] [Google Scholar]
- Wilkins AS. 2007b. Genetic networks as transmitting and amplifying devices for natural genetic tinkering. Novartis Found Symp. 284:71–86; discussion: 86–89, 110–115. [DOI] [PubMed] [Google Scholar]
- Wotton KR, Jiménez-Guri E, Crombach A, Cicin-Sain D, Jaeger J. 2015. High-resolution gene expression data from blastoderm embryos of the scuttle fly Megaselia abdita. Sci Data. 2:150005. [DOI] [PMC free article] [PubMed] [Google Scholar]
- Wotton KR, Jiménez-Guri E, Crombach A, Janssens H, Alcaine-Colet A, Lemke S, Schmidt-Ott U, Jaeger J. 2015. Quantitative system drift compensates for altered maternal inputs to the gap gene network of the scuttle fly Megaselia abdita. Elife 4. [DOI] [PMC free article] [PubMed] [Google Scholar]
- Wotton KR, Jiménez-Guri E, García Matheu B, Jaeger J. 2014. A staging scheme for the development of the scuttle fly Megaselia abdita. PLoS One 9:e84421. [DOI] [PMC free article] [PubMed] [Google Scholar]
- Wotton KR, Jiménez-Guri E, Jaeger J. 2015. Maternal co-ordinate gene regulation and axis polarity in the scuttle fly Megaselia abdita. PLoS Genet. 11:e1005042. [DOI] [PMC free article] [PubMed] [Google Scholar]
- Yassin A, Lienau EK, Narechania A, DeSalle R. 2010. Catching the phylogenic history through the ontogenic hourglass: a phylogenomic analysis of Drosophila body segmentation genes. Evol Dev. 12:288–295. [DOI] [PubMed] [Google Scholar]
Associated Data
This section collects any data citations, data availability statements, or supplementary materials included in this article.