

Abstract
The level of hydration in the human body is carefully adjusted to control the electrolyte balance that governs the biochemical processes that sustain life. An electrolyte deficiency caused by de- or overhydration will not only limit human performance, but can also lead to serious health problems and death if left untreated. Because humans can withstand a change in hydration of only  , frequent monitoring should be performed in risk groups. This paper presents an osmotic hydration sensor that can record the level of hydration as a function of osmotic pressure in phosphate buffered saline or sodium-chloride solutions that simulate the interstitial fluid in the body. The osmotic pressure is recorded with the aid of an ion-exchange membrane that facilitates the migration of water and cations, in favor of reverse osmosis or gas separation membranes. The hydration sensor is designed to be coupled to an inductively powered readout circuit designed for integration in a micro-implant that has previously been shown to consume only 76
  of power. The dynamic range spans a state of serious overhydration (220
  ) to a serious state of dehydration (340
  ) with a response time of
  (for a variation of hydration of 20%).
Keywords: Osmotic sensor, Osmotic strength, Dehydration, Overhydration, Semipermeable membrane
I. Introduction
Dehydration and overhydration entail a deficiency of the fluid and salt balance within an organism due to the loss or excess intake of water. The symptoms are manifested asthirst, discomfort and fatigue (headaches, nausea), and even a mild onset of dehydration of only 2% fluid loss may result in a reduced physical performance of 30% [1]. If left untreated it may cause delirium, unconsciousness and death if the fluid imbalance goes beyond  from the normal. Although the loss of water is the predominant condition studied, it is important to remember that an excessive water intake can be as dangerous, especially when associated with an intense physical activity in hot environments. A large intake of water containing no additional electrolytes will decrease the salt (sodium) concentration resulting in physiological malfunctions of cells known as hyponatremia (a condition triggered at 15% overhydration) [2]. The risk of dehydration can occur in both normal and cold environments, especially at high altitudes (thin air) due to the increased perspiration at lower air pressures. Other known factors are a result of infectious diseases that trigger an excess loss of water (diarrhea, vomiting), and the exposure to physical traumas associated with blood loss and hyperthermia. It is therefore important to monitor the hydration level in risk groups in which the detrimental effects of dehydration bear the greatest significance and where an early warning system is essential.
Besides measuring the fluid and salt balance in a clinical setting, the hydration sensor could also be used to detect minor internal bleeding following a surgical procedure, as well as organ failure that can be traced from waste products accumulating in and changing the osmotic pressure of the interstitial fluid. Dehydration is also a signature of dementia [in elderly at-risk patients]. In contrast, premature babies are also a risk group since they do not feed well and have a higher body surface to mass ratio that permits dehydration through the skin.
Professionals that could benefit from a hydration sensor would in the first instance be army personnel, pilots and athletes who work or exercise under extreme conditions. During the years of 2000–2004 there were 11 reported heat stroke fatalities among American football players during the month of August (beginning of preseason practices for the colleges) [3]. It was found that the football players experienced an average decrease in body mass due to dehydration of about 1.2% after each training session, and further studies later revealed that an athlete's heart rate (HR) increases by approx. 10 beats/min after exercise for every 1% of body mass that is lost [4].
The estimation of the hydration level is currently based on the analysis of body fluids such as saliva flow (viscosity) [5], urine conductivity or color [6] and chromatography [7]. Alternative technology seeks to measure the skin impedance [8], [9] or the thickness of the dermis layer by mechanical (ultrasound) waves [10] or electromagnetic radiation [11]. The total amount of body water could also be measured using tracers such as Deuterium oxide  , but has the disadvantage of being invasive (it increases unwanted biochemical reactions that could lead to cell dysfunctions) as well as suffering from a response time of 3–4 hours after oral intake [12]. However, most of these methods require instrumentation of a stationary nature that is confined to a hospital or doctor's office, and which comes at a significant cost as well as the need of a professional operator.
The proposed osmotic hydration sensor that is presented in this paper has the potential for miniaturization into an implantable device that can provide real time measurements of the hydration level in the body without disturbing the patient or professional due to its small and unobtrusive nature. This work on the design, fabrication and early validation of the sensor demonstrates that hydration levels can be recorded based on a changing concentration of chiefly salts present in the human body. The different states of hydration have been simulated by using two different solutions: (i) phosphate buffered saline (PBS) and (ii) sodium-chloride (NaCl), both with a variation in water content of  . This permits the relationship between the salt concentration in each of the test solutions and the corresponding osmotic pressure to be identified.
A core element of an osmotic sensor is the semi-permeable membrane that creates a diffusive barrier between an integrated sensor cavity that contains a reference solution of constant osmotic strength, and the variable osmotic strength of the body fluids. Hence, this article will focus on:
-
•
investigation of different semi-permeable membranes with respect to water permeability and salt retention,
-
•
integration of the membrane in a hydration sensor,
-
•
demonstration of the proof-of-concept by recording extreme states of hydration, and
-
•
evaluation of the translational nature of the sensor for implementation in a clinical setting.
The different hydration levels (and the concentration of salts) should be proportional to the osmotic pressure that is generated within the sensor. Although the pressure should follow an ideal linear relationship between the concentration of dissolved molecular and ionic components, the real pressure is dependent on the semi-permeable properties of the membranes such as salt retention and water permeability. This work will permit us to identify the membrane that gives the best sensitivity and shortest response time for the given sensor configuration.
II. Methods and Materials
A. Implementation
1. Osmotic Sensor
The osmotic sensor consists of two main parts as shown in Fig. 1. The lid is machined in acetal and contains physical holes that permit solution entry as well as a support structure that holds a 15 mm circular semi-permeable membrane (permeable to water but which selectively blocks dissolved molecules) in place from the inside by an O-ring. The lid is attached to the sensor base by a M14 screw connection and is assembled while immersed in a reference solution of a fixed osmotic strength (subsection A.c) that permits filling the reference chamber. The reference chamber is defined between the membrane, the inner diameter of the O-ring and the top surface of the sensor base. Its volume is measured by the height of the O-ring  when compressed with the sensor lid mounted (approx. 0.5 mm).
Fig. 1.
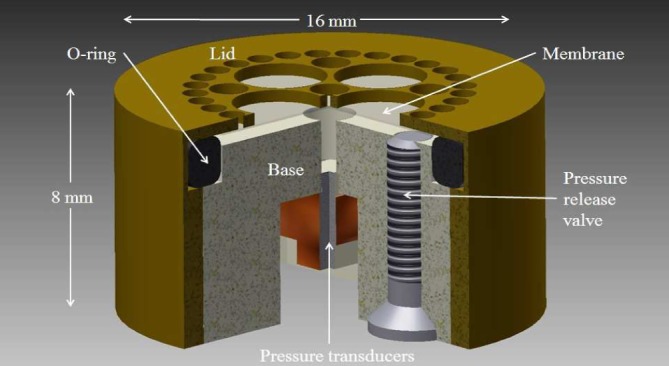
CAD image of the osmotic hydration sensor. The sensor consists of a lid, membrane, O-ring, base, pressure transducers (2 pcs) and a pressure release valve. Both the lid and base are threaded (M14) to allow these two parts to connect together. The colors used are for illustration purposes only. The bulk sensor housing has been made from an acetal copolymer.
The sensor base contains one central access channel that permits direct communication between the reference chamber and the pressure transducer (SW415, Sensonor, Norway). This access channel is filled with liquid paraffin that is immiscible with water and serves to reduce the amount of dead volume occupied by the channel. A second pressure transducer mounted back-to-back with the first one cancels the environmental pressure perturbations away from the measurement. The threaded hole mounted offset in the base serves as a pressure release valve that permits bleeding of the reference cavity when the O-ring is compressed during assembly. The external media (the interstitial fluid) is in direct contact with the membrane and any variation in the external salt concentration will prompt water to diffuse through the semi-permeable membrane and thereby increase or decrease the osmotic pressure that is generated in the reference chamber respectively. This osmotic pressure will in turn be directly proportional to the change in the level of hydration of a subject.
The relationship between the salt concentration and the osmotic pressure is expressed by Henry's law (1) [13]:
 |
where  represents the osmotic pressure,
  is the sum of the concentration of all dissolved ions that are osmotically active
  , R is the universal gas constant (0.08314 L bar
  ) and T is the thermodynamic (absolute) temperature (K).
2. Pressure Transducer
The SW415 (Sensonor, Norway) is an absolute pressure transducer that is capable of measuring 2 bar and consists of a membrane and a vacuumed reference chamber packaged into a silicon die with a footprint of 2×2  . The membrane integrates two piezoresistors and two reference resistors arranged in a Wheatstone bridge configuration (bridge resistance of 12
  ). The hydration sensor prototype described in this paper amplifies the output signal from the dual pressure transducer configuration through an instrumentation amplifier made from discrete components and sampled by a multifunction DAQ card (USB-6009, National Instruments, USA). The card is controlled by a LabVIEW routine permitting the user to define the sampling interval and the data acquisition time.
3. Test and Reference Solutions
The reference solution reflects the saline concentration of the tissue fluids found in the body and the osmotic pressure it generates depends on the amount of osmotically active molecules (solute) per litre of solution (osmotic strength). The osmolarity is measured in  (milliosmoles per litre of solution) while osmolality is measured in
  (milliosmoles per kilogram of solvent). The normal osmolarity level in a healthy subject ranges from 280 to 300
  [13]. The salts that govern the osmolarity are the most abundant ones in the human body and contain chiefly sodium-chloride (NaCl) which, when dissolved in an aqueous solution, dissociates into two ions:
  and
and  . Since both ions contribute to the osmotic pressure, a NaClconcentration
  of 0.14 M results in an osmolarity of
  . Detecting this salt concentration relies on the Gibbs-Donnan membrane equilibrium [14] where the molecules that are not able to diffuse across a membrane create an osmotic pressure due to the movement of water toward the region with a higher salt concentration (Osmosis). Although a reference solution of NaCl dissolved in deionized (DI) water was initially used to characterize the sensor, this was later replaced with a PBS solution (P5368, Sigma-Aldrich, US) that better reflects the interstitial fluids of the human body as well as maintaining a correct pH of 7.4 throughout the measurement. The solutions were made with an osmotic strength of 220, 280 and 340
  in order to simulate the extreme range of de- and overhydration around the mean value of 280
  .
.
B. Experimental Tests
Since a  deviation in hydration from the normal value is enough to induce serious illness and death, the dynamic range of the sensor was set to reflect this value (220–340
  ). Thus, the objective of the experimental work was to investigate the performance of the selected membrane candidates over this range. The membranes should permit the migration of water yet retain salt ions to such an extent that a stable osmotic pressure signature is recorded.
1. Methodology
The sensor base containing the pressure transducers was integrated in the bottom of a test vessel containing the reference solution. The lid containing the membrane and O-ring was immersed inside the test vessel and attached to the sensor base—avoiding the entrapment of air bubbles in the process. Any excess pressure was released through the pressure release valve and the signal permitted to reach the equilibrium (zero bar). The sensor was then kept at rest for 5–10 hours in order to investigate potential signals arising from temperature changes in the room while recording the zero pressure baseline. The reference solution enclosed inside the sensor reference cavity was initially identical to the solution resting outside the sensor. Two experimental protocols were conducted for the NaCl and PBS solutions. (i) The sensor was first assembled with a reference solution of 340  that represents the maximum dehydration state as well as offering a positive osmotic pressure over the dynamic range. By maintaining an overpressure in the reference chamber at any given time, the evolution of gas-bubbles from the reference solution can be prevented. After permitting the signal to reach its equilibrium baseline, the external test solution was then changed to a normal state of hydration
  before changing to a second solution representing overhydration
  . (ii) The second protocol required the sensor to be assembled in a normal hydrated solution of 280
  to represent a state where the sensor is equilibrated with the body fluids at the normal value prior to a hydration change of
  (changing to a test solution of 220 and 340
  respectively). This represents a realistic long term scenario in which a “leaky” membrane has equilibrated with the body fluids prior to any change in osmolarity and subsequently osmotic pressure.
The experiments were conducted 3 times to permit statistical analysis of the distribution around the mean. The semipermeable membrane was replaced between each experiment in order to eliminate potential variations due to mishandling, damage or contamination of the membrane. The different membranes that were investigated are presented in Table I. The membranes were purchased in a sheet form and treated according to the manufacturer's recommendations. The ion exchange membranes had to be hydrated prior to cutting to the correct dimension in order to account for the 5% volume increase in the hydrated state. All measurements were performed at a temperature of 20°C.
Table I. Commercial Available Membranes Used in This Project.
| Description | Thickness 
|
Material | Supplier | Filtration type | Classification |
|---|---|---|---|---|---|
| Polyamide | 177 | Polyamide thin film | Sterlitech, US | RO, Nano- porous | Composite |
| Nafion N115 | 127 | PTFE co- polymer in acid (1–1+) form | Dupont (Ion- Power) | Ion- exchange | Dense |
| Nation NR-211 | 27 | PTFE co- polymer in acid (HP) form | Dupont (Ion- Power) | Ion- exchange | Dense |
| Teflon | 175 | Pure PTFE | Sterlitech, US | Gas- permeable | Dense |
| ePTFE | 130 | ePTFE (expanded PTFE) membrane laminate | GE Energy Seal & Design INC., US | Gas- permeable | Dense |
C. Membranes
The structural characteristics of semipermeable membranes play an important role in determining the permeability of water, the retention capability of salts and the biocompatible nature of its surface. Nanoporous membranes have been instrumental in the development of separation sciences over the last two decades with focus on the purification and selective filtration of biomolecules [15]. Commercial nanoporous membranes are classified into the field of ultrafiltration, microfiltration, virus filtration (nanofiltration) and reverse osmosis (RO) to reflect the size of the component that the filter retains. Although filtration and separation is commonly achieved by physical exclusion by nanopores of a finite size, alternative methods include charge separation, chemical identification and gas permeability [15]. The membranes used in this study all belong to the group of nanoporous, ion exchange and gas permeable (Table I).
1. RO Membranes
RO membranes were initially developed in the early 60's by Loeb and Sourirajan [16] and have a pore diameter that should retain most solutes (e.g., salt ions), while permitting the passage of water. Most of these have asymmetric pores that narrow down to the diameter that denotes the molecular weight cut off (MWCO). Asymmetric membranes are normally composed of a thin top layer containing the nanopores with a macroporous support that maintains mechanical stability.
2. Ion-Exchange Membranes
Ion-exchange membranes can be classified as cation-exchange or anion-exchange depending on the type of ionic groups fixed to the membrane backbone. Cation-exchange membranes present negatively charged groups ( ,
,  ,
,  ,
,  ,
,  , etc.) allowing the passage of cations and rejecting anions. The opposite can be achieved with anion-exchange membranes containing positively charged groups (
 ,
,  ,
,  ,
,  ,
,  ,
,  , etc.). Ion-exchange membranes can also be classified as homogenous or heterogeneous according to their chemical structure [17].
3. Gas Separation Membranes
Transport through this type of membrane occurs by materials in their gaseous phase governed by Fick's first law of diffusion. The flux in the direction of flow is proportional to the transmembrane concentration gradient of the vapor pressure inside or outside the sensor [18].
III. Results
The response characteristics of the membranes were first investigated by changing the osmotic strength of the test solution by 20% (60  ) from 280 to 220
  . The corresponding osmotic pressures generated are presented in Fig. 2. It is clear that only the Nafion membranes are able to generate an observable pressure signal due to the influx of water. The permeability of the RO polyamide membrane did not permit a recordable signal to be observed over the time frame of the measurement. Neither was the vapour pressure of water high enough to permeate the dense film of the Teflon membrane, or the porous film of the ePTFE membrane. The Nafion N115 and NR-211 membranes were able to generate a maximum pressure of 720 and 890 mbar respectively above ambient. The response times were comparable with a steady signal reached within 7–8 hours corresponding to a time factor of 2.5 hours (63% of full signal).
Fig. 2.

Absolute osmotic pressure as a function of changing the osmotic strength of the external test solution from 280 to 220  at
at  while maintaining 280
  inside the reference chamber. The sensor was equipped with the Nafion 115, Nafion NR-211, Teflon, Polyamide and the ePTFE membranes. The plots are shifted vertically for clarity. The pressure ticks (y-axis) correspond to 500 mbar.
Hence, the sensor response over the dynamic measurement range was performed with the sensor equipped with the Nafion N115 membrane. Maintaining 280  in the reference chamber, the osmotic strength of the test solutions was changed by
  from 340 to 220
  and the results are presented in Fig. 3. Since Nafion is permeable to cations
  , the osmotic pressure signature from the
  concentration should be recorded. The results of 439 mBar at 220
  and
and  at 340
  suggest a sensitivity that is lower than the theoretical calculation of the osmotic pressure from
  corresponding to
  . There is also a small deviation from the linear relationship between the pressure and the observed concentration change from the middle value of 280
  .
.
Fig. 3.
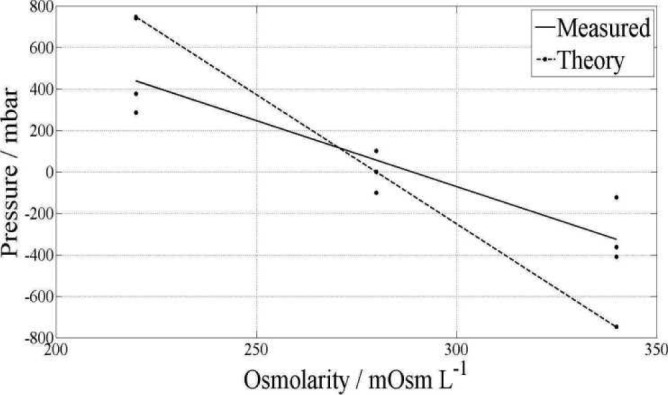
Osmotic pressure as function of the transmembrane concentration gradient in NaCl that simulates dehydration (340  ), normal (280
  ) marked as the zero pressure point and overhydration (220
  ). The theoretical line represents the osmotic pressure from
  only. The sensor was equipped with the Nafion N115 membrane. The measured slope is a linear approximation of the experimental data.
Maintaining a solution with an osmotic strength of 340  in the reference chamber, the protocol was changed to investigate the pressure changes that would be measured as the external test solution (media) was decreased to 280 and 220
  respectively to simulate a transition from extreme dehydration via the normal state to extreme overhydration. The NaCl solution was replaced with PBS and the results are presented in Fig. 4.
Fig. 4.
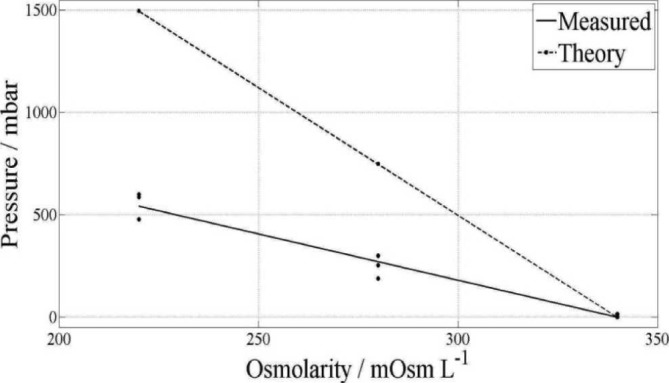
Osmotic pressure as function of the transmembrane concentration gradient in PBS that simulates dehydration (340  ) marked as the zero pressure point, normal (280
  ) and overhydration (220
  ). The theoretical line represents the osmotic pressure from
  only. The sensor was equipped with the Nafion N115 membrane. The measured slope is a linear approximation of the experimental data.
Despite maintaining a positive overpressure in the sensor, the absolute pressure change of 271 mBar at 280  and 543 mBar at 220
  was below that observed by keeping the reference solution at 280
  . However, the linear trend was maintained as compared to the theoretical trend line plotted in the graph. Repeating the measurements without replacing the Nafion membrane resulted in a performance degradation in which the osmotic pressure decreased with time, Fig. 5.
Fig. 5.

Repetitive measurements with the sensor equipped with the Nafion N115 membrane for a dehydration scenario in PBS from 340 to 280  . All 3 experiments were conducted with the same membrane.
Although the experiments were conducted under the same conditions as before the maximum osmotic pressure was found to decrease from 250 mBar in the 1st experiment, to 85 mBar in the 2nd experiment and to 40 mBar in the 3rd experiment. Each experiment took approximately 60 hours and as such this performance degradation was observed over a time frame of 180 hours. Hence, the capability of the membrane to generate a recordable osmotic pressure change in the sensor was estimated to be approximately 180–300 hours.
The performance degradation of the Nafion membranes was examined by investigating the potential for stoichiometric changes in the material composition during its exposure to the physiological PBS solution. Hence, the membranes were subject to energy-dispersive X-ray spectroscopy analysis (EDS) with the results presented in Fig. 6. The membranes were rinsed with DI water and dehydrated before examination under the scanning electron microscope (SEM, Philips XL30) and with the EDS scan compared with new and unused membranes.
Fig. 6.

EDS analysis showing the composition of the Nafion N115 membrane before and after immersion in PBS for 60 hours (counts vs KeV).
The EDS results suggest that the composition of the Nafion membrane is modified after exposure to PBS as observed with the clear presence of sodium (Na) and potassium (K) content after exposure. The Na peak indicates a concentration of 6.54 wt% already after 60 hours of exposure to PBS, and the amount of sodium was found to increase with time as shown in Table II.
Table II. Nafion N115 Contamination by  .
.
| Exposure to PBS (hours) | Experiment Fig. 5 | Na (wt %) |
|---|---|---|
| 0 | - | 0 |
| 60 | - | 6.5 |
| 140 | 1 | 9.8 |
| 200 | 2 | 9.9 |
| 260 | 3 | 10.4 |
Although there is a clear increase in the sodium concentration as indicated by the weight percent ratio, there is not a direct linear dependency with time, i.e., one cannot clearly differentiate between the quantity of Na between 140 and 260 hours, suggesting that the membrane becomes saturated.
IV. Discussion
A. Membranes for Liquid or Vapour Diffusion
The experimental results showed that the polyamide RO, Teflon and ePTFE venting membranes were not able to generate an observable change in the osmotic pressure. Although the RO membrane per definition should retain salts, it was found that a glucose sensor equipped with this membrane [19] demonstrated that the retention of particles below the molecular size of glucose (180 Da  ) became increasingly poor. In comparison, the hydrodynamic diameter of
  and
and  (0.36 nm and 0.24 nm respectively) suggests that these ions most probably were not retained by the RO membrane. In contrast, the Teflon and ePTFE membranesproved to be too dense and hence the Teflon, ePTFE and RO membranes were rendered unsuitable for use.
B. Ion Exchange Membranes
The charge selective nature of the ion-exchange membrane blocked the passage of the  ions which resulted in the observed pressure. The mismatch between the experimental and theoretical data can be explained by the membrane not being totally impermeable to
  ions, or that some of the pressure is channelled out through the sensor by leakage (e.g., through the O-ring or pressure release valve). Since the Nafion membrane is known for its properties as a proton exchange membrane (PEM) and, besides being a cation exchange membrane, the potential leakage rate of
  through the membrane raised concerns about the membrane integrity. Upon reaching the maximum pressure (which does not match entirely with the theoretical values calculated with (1)), the pressure starts to drop until it finally reaches the baseline. This suggests that the
  ions are able to diffuse through the membrane until an equilibrium is reached according to Fig. 5. The fact that an equilibrium is reached is not a problem if the membrane is able to provide a new maximum pressure every time there is change in salt concentration due to de- or overhydration. However, after approx. 300 hours in a PBS solution, the membrane is not able to generate any transmembrane pressure gradients. One potential explanation for this observation (as supported by the EDS studies), suggests that the negatively charged ionic groups on the membrane's backbone are replaced with positively charged
  (and
(and  ) ions. Such contamination of the ion exchange membrane has been reported in literature [20], [21]
which results in the loss of proton conductance as well as the charged retention of
) ions. Such contamination of the ion exchange membrane has been reported in literature [20], [21]
which results in the loss of proton conductance as well as the charged retention of  ions. With both
  and
and  free to move across the membrane, the initial concentration difference between the test solution outside and the reference solution inside the sensor (which would have given rise to an osmotic pressure) is now cancelled out.
The concentration of 10 wt% Na in the membrane after 260 hours of exposure is larger than the 0.3 wt% of Na present in the PBS solution (138 mM). Considering a 35% weight increase of the membrane in the hydrated state, the Na concentration still counts for 6.8 wt%. This can be explained by  successively accumulating in the Nafionmembrane as it replaces protons and is permanently attached to the negatively charged sulfonic acid backbone.
Although the decreased performance of the Nafion membrane can be compensated for by calibration, the finite lifetime will limit practical operation of the sensor to below 300 hours (12 days). One way of preventing or attenuating the sorption of  from the membrane could be solved by using Nafion membranes with a PTFE co-polymer in the
  form, instead of the
  . These would need to be custom made from dispersions since solid Nafion membranes in the
  form are currently not commercially available.
C. Response Time
Previous studies have shown that a 70 kg athlete who undergoes intensive physical exercise could reach a state of 2% dehydration during the first hour of training [12]. Although this rate may depend on the athlete's level of perspiration, it shows that the presented hydration sensor would have a time lag of 7 hours until the full signal change has been reached. However, considering the time factor of 2.5 hours (63% of full signal), one alternative detection scheme would be to measure the rate of change in the osmotic pressure as a function of the change in osmolarityin the body fluids. A complementary software code that combines a certain rate of change with a % change in osmolarity could be used as an early warning regimenof impending hydration/dehydration events.
Replacing the Nafion membrane with a more time responsive version could be another option. The use of a thinner Nafion membrane (NR-211) was thought to improve the response time but the results suggest that this impact was minimal compared to the thicker N115 version. In contrast, a response time of 5 hours was recorded with the thicker version during the contamination studies (Fig. 5) but this could be due to a promoted leakage of  ions from the presence of
  after 60 hours of PBS exposure.
As discussed in Section IV-B, a Nafion membrane in the form of a  backbone could prove to be the solution for the
  leakage and provide the ideal membrane for this sensor. Such a custom made membrane would require a thorough evaluation of the response characteristics.
A further miniaturized sensor such as an integrated MEMS device with shorter diffusion barriers (height of reference chamber and enlarged surface area of the membrane) would further help to improve the response time.
D. Application-Specific Integrated Circuit (ASIC)
The current sensor runs from a direct wired communication link to the DAQ system. However, the planned transition to an ambulatory (wearable) system would prompt the replacement of the discrete components with an application specific integrated circuit (ASIC). The pressure transducer and its reference will be mounted back to back with the electrical connections wire bonded to a common component (chip) carrier that offers a shared platform to the ASIC. The carrier will include SMD (surface mounted) capacitors that form part of a tuned antenna circuit as well as increasing the stability of the regulated inductivecoupled power supply. The carrier will be located in the recess of the sensor [Fig. 1] and a circular coil antenna will be located at the rear of the sensor enclosure to facilitate inductive powering and communication by load modulation [22]. The final ASIC will measure 1×1 mm and be fabricated using the TSMC 90 nm CMOS process. The ASIC will be an improvement of a current prototype that has a power consumption of 76  [13], and a self-rectified inductive coupled supply voltage of approx. 1 V (973 mV to 987 mV). The ASIC incorporates the sensor front end circuitry that provides a supply voltage to the sensors, acquires the sensor signals, and converts the sensor signal into a pulse density modulated signal, which is transmitted wirelessly through the inductive link by load modulation. The offset cancellation and 1/f noise reduction is achieved by the use of a so called chopping and auto-zeroing technique [23]. The new ASIC will offer an improved signal-to-noise ratio (SNR) and reduce its dependency on the unregulated supply. This will also reduce the dependency of the output frequency on the unregulated supply. At this stage, the new ASIC has been designed and submitted for production.
E. Ex-Vivo Body Use
The sensor could also be implemented in a skin patch or a wrist watch but this involves other challenges such as: induced pressure signals (noise) from skin movement, accumulation of salt on the skin surface/membrane due to evaporating water, skin irritation, impact resistance such as pressure applied to the skin, fluid sampling etc. Designing the sensor as a skin patch, or implementing it in the base of a wrist watch, would require additional pressure sensors in order to differentiate noisy signals due to skin movement or applied skin pressure. However, the most important challenge from a non-invasive sensor configuration would need to be the ability to sample sweat at fixed time intervals in order to record a corresponding osmotic pressure from the salt concentration in the sweat. People sweat at different rates according to their weight, metabolism, age and environmental conditions (temperature, humidity, etc.). One may consider adding an interface based on micro-needles to sample tissue fluids, but this would need to be accommodated with a flow system that is able to continuously supply fresh fluid to the sensor.
F. Implementation of the Sensor in a Clinical Setting
The discovery of measuring the hydration level by means of osmotic pressure has in this paper been demonstrated at the proof-of-concept level through a working prototype. The translational nature of this technology should permit a fast-track implementation of the sensor in a clinical setting. The wireless communication protocol adheres to the ISO Standard 14,443 for proximity or contactless smart card communication and our application provides radiation levels that are well below the limits set by the International Council on Non-Ionizing Radiation Protection (ICNIRP). The sensor will be miniaturized by the aid of micro- and nanofabrication methodologies previously adapted for biomedical microsystems [13], [24] and use materials that offer biocompatible properties [25]–[27]. The investigation of the tissue response will adhere to the ISO 10,993 Standard for biological evaluation of medical devices.
In vivo clinical trials will be performed on voluntary groups (army, pilot and athletes) as well as patients with a chronic disease susceptible to electrolyte imbalances. Healthy individuals will act as controls in which the level of hydration is changed by ingestion of salt/water or in combination with physical activities. The state of hydration on trial patients/individuals could be controlled using the methods described by Yeargin et al. [3], and Casa et al. [4], by monitoring the heart rate and weight of the test subjects. The information from the in vivo trials would not only validate the sensor's function but also provide useful information about the use of the sensor, and its tradeoffs as an external skin patch or implantable device.
V. Conclusion
We have shown that the osmotic strength of NaCl and PBS solutions as a function of hydration and dehydration can be recorded by an osmotic sensor equipped with a Nafion membrane. This suggests the potential use of ion-exchange membranes in retaining charged molecular components that are too small for separation by traditional porous RO membranes. The size and power consumption of the sensor components make this technology suitable for miniaturization into an implantable device that will target continuous measurements in vivo. The chemical inertness of the sensor material will aid introduction into a corrosive biological environment, although functional aspects of the interaction with living tissue remain to be explored.
The short lifetimes from cation contamination of the Nafion membrane in the  form render the present sensor as more suitable for use in a disposable skin patch. Detecting the rate of change in pressure in contrast to an absolute value may offer a means of alleviating the slow time response of the current prototype. However, alternative types of Nafion membranes (such as co-polymer in
  or other cation form) could eventually prove to extend the lifetime of the membrane considerably as well as improving its response time. Miniaturizing the sensor using MEMS technology will further help reduce the diffusion distances governing the response time. A factor that could also contribute to a reduction in the response time is to increase the temperature, since the diffusion coefficient of water increases with the temperature as long as there is a steady-state water transport across the membrane [28]. This is particularly important if one considers an implantable sensor which would operate at the body core temperature of 37°C instead of room temperature.
Acknowledgment
The authors would like to thank the laboratory engineers from the Department of Micro- and Nano Technology at Vestfold University College for their assistance in the experimental protocol.
Biographies

Luís André L. Fernandes received the B.Sc. (Hons.) degree in physical engineering from the University of Lisbon, Lisbon, Portugal, in 2005. He wrote his final year project with the Institute National de la Santé et de la Recherche Médicale and the Laboratoire de Spectrométrie Physique, Grenoble, France, where he investigated glucose uptake of the rat Vagus nerve. He received the M.Sc. degree from the University of Lisbon in 2009 in collaboration with the Clinical Engineering Department, Royal Brompton Hospital, and the International Centre for Circulatory Health, Imperial College, St Mary's Hospital, London, U.K., where he has developed a computer controlled valve to deliver  gas mixtures for the investigation of novel therapies for periodic breathing. He is currently a Ph.D. Student with Vestfold University College, Borre, Norway, focusing on the development of biosensors and their nanoelectronic interface.

Philipp Häfliger (SM'10) received the Ph.D. degree from the Institute of Neuroinformatics, ETH, Zurich, Switzerland, in 2000. He then moved for a postdoctoral position with the Nanoelectronics Group, Institute of Informatics, University of Oslo, Oslo, Norway, where he is currently an Associate Professor. His research has focused on neuromorphic electronics and ultra-low-power ASIC design for biomedical devices and wireless microimplants. He has been the Chairman of the Biomedical and Life Science CAS (BioCAS) Technical Committee of the IEEE Circuits and Systems (CAS) Society, has contributed to the organisation of the IEEE ISCAS and BioCAS conferences, and has been a Guest Associate Editor for the IEEE TRANSACTIONS ON BioCAS.

Mehdi Azadmehr received the Ph.D. degree in nanoelectronics from the University of Oslo, Oslo, Norway, in 2009. His Ph.D. project was funded by Vestfold University College, Horten, Norway. The Ph.D. work aimed at designing bi-directional circuit for use as interface for resonating sensors. He was an Assistant Professor with Vestfold University College, Borre, Norway, where he is currently an Associate Professor. His main research areas are within the field of analog electronic with focus on interface circuits and organic electronics.

Erik A. Johannessen received the Ph.D. degree in bioelectronics from the University of Liverpool, Liverpool, U.K., in 2002. He was a Post-Doctoral Research Fellow with the Department of Electronic and Electrical Engineering, University of Glasgow, Glasgow, U.K, before working as the Project Manager with Lifecare, Horten, Norway. He is currently a Professor with Vestfold University College, Borre, Norway, with the aim to establish world class research activities within BioMEMS, with focus on bio and nanoelectronics, mobile analytical devices and in-vivo powered microsystems.
References
- [1].Armstrong L. E., Costill D. L., and Fink W. J., “Influence of diuretic-induced dehydration on competitive running performance,” in Med. Sci. Sports Exercise, vol. 17, pp. 456–461, Aug. 1985. [DOI] [PubMed] [Google Scholar]
- [2].Wizemann V., Wabel P., Chamney P., Zaluska W., Moissl U., Rode C., Malecka-Masalska T., and Marcelli D., “The mortality risk of overhydration in haemodialysis patients,” in Nephrol. Dial. Transplant., vol. 24, pp. 1574–1579, May 2009. [DOI] [PMC free article] [PubMed] [Google Scholar]
- [3].Yeargin S. W., Susan W., Casa D. J., Armstrong L. E., Watson G., Judelson D. A., Psathas E., and Sparrow S. L., “Heat acclimatization and hydration status of american football players during initial summer workouts,” in J. Strength Condition. Res., vol. 20, pp. 463–470, Aug. 2006. [DOI] [PubMed] [Google Scholar]
- [4].Casa D. J., Stearns R. L., Lopez R. M., Ganio M. S., McDermott B. P., Yeargin S. W., and Maresh C. M., “Influence of hydration on physiological function and performance during trail running in the heat,” in J. Athl. Train., vol. 45, pp. 147–156, Mar-Apr 2010. [DOI] [PMC free article] [PubMed] [Google Scholar]
- [5].Hadiwidjaja A., Howell T., Thomas C., Tong P., Method and apparatus to sense hydration level of a person, U.S. 0 048 224, Mar. 1 2007.
- [6].Gelfand M., Levin H. R., Rudko R. I., Tauscher M. R., Patient hydration system with hydration state detection U. S. Patent 7 736 354, Jun. 15 2010.
- [7].Xuedong X., Three-dimensional vertical hydration/dehydration sensor, U.S. 0 064 153, Sep. 23 2010.
- [8].Beck J. C., Sattiraju V. R., Niknejad A. M., Yun L. C., Lee R., Magar S., Fisher L. M., An integrated wireless patch for physiological monitoring, U.S. 0 317 958, Dec. 16 2010.
- [9].Laubscher M., Shi Y., Uzunbajakava N., Vollmer T., Wu R., Methods and apparatuses for measuring skin properties WO Patent 0 027 898, Mar. 5 2009.
- [10].Cohen-Solal E., Shi Y. S., Method and apparatus for determining hydration levels WO Patent 113 758, Oct. 11 2007.
- [11].Baker C. R., Method and apparatus for estimating water reserves, U.S. 8 357 090, Jan. 22 2013.
- [12].Shirreffs S. M., “Markers of hydration status,” in Eur. J. Clin. Nutrit., vol. 57, pp. 6–9, Dec. 2003. [DOI] [PubMed] [Google Scholar]
- [13].Johannessen E., Krushinitskaya O., Sokolov A., Philipp H., Hoogerwerf A., Hinderling C., Kautio K., Lenkkeri J., Strömmer E., Kondratyev V., Tønnessen T. I., Mollnes T. E., Jakobsen H., Zimmer E., and Akselsen B., “Toward an injectable continuous osmotic glucose sensor,” in J. Diabetes Sci. Technol., vol. 4, pp. 882–892, Jul. 2010. [DOI] [PMC free article] [PubMed] [Google Scholar]
- [14].Leveen H. H., Leveen E. G., Leveen R. F., Osmolarity sensor, U.S. 5 388 449, Feb. 14 1995.
- [15].Reis R. V. and Zydney A., “Bioprocess membrane technology,” in J. Membrane Sci., vol. 297, pp. 16–50, Sep. 2007. [Google Scholar]
- [16].Loeb S. and Sourirajan S., “Sea water demineralization by means of an osmotic membrane,” in Adv. Chem., vol. 38, pp. 117–132, Jan. 1963. [Google Scholar]
- [17].Xu T. W., “Ion exchange membranes: State of their development and perspective,” in J. Membrane Sci., vol. 263, pp. 1–29, Oct. 2005. [Google Scholar]
- [18].Tremblay P., Savard M. M., Vermettea J., and Paquin R., “Gas permeability, diffusivity and solubility of nitrogen, helium, methane, carbon dioxide and formaldehyde in dense polymeric membranes using a new on-line permeation apparatus,” in J. Membrane Sci., vol. 282, pp. 245–256, Oct. 2006. [Google Scholar]
- [19].Krushinitskaya O., Tønnessen T. I., Jakobsen H., and Johannessen E., “The assessment of potentially interfering metabolites and dietary components in blood using an osmotic glucose sensor based on the concanavalin A–dextran affinity assay,” in Biosensors Bioelectron., vol. 28, no. 1, pp. 195–203, 2011. [DOI] [PubMed] [Google Scholar]
- [20].Chae K. J., Choi M., Ajayi F. F., Park W., Chang I. S., and Kim I. S., “Mass transport through a proton exchange membrane (nafion) in microbial fuel cells,” in Energy Fuels, vol. 22, no. 1, pp. 169–176, 2008. [Google Scholar]
-
[21].Okada T., Møller-Holst S., Gorseth O., and Kjelstrupb S., “Transport and equilibrium properties of Nafion membranes with
 and
and  ions,” in J. Electroanal. Chem., vol. 442, no. 1–2, pp. 137–145, 1998. [Google Scholar]
 - [22].Johannessen E. and Häfliger P., “Analog to interval encoder with active use of gate leakage for an implanted blood-sugar sensor,” in IEEE Biomedical Circuits and Systems, Baltimore, MD USA, 2008. [Google Scholar]
- [23].Enz C. C. and Temes G. C., “Circuit techniques for reducing the effects of op-amp imperfections: Autozeroing, correlated double sampling, and chopper stabilization,” in Proc. IEEE, vol. 84, pp. 1584–1614, Nov. 1996. [Google Scholar]
- [24].Johannessen E. A., Wang L., Cui L., Tang T. B., Astaras A., Ahmadian M., and Cooper J. M., “Implementation of multichannel sensors for remote biomedical measurements in a microsystems format,” in IEEE Trans. Biomed. Eng., vol. 51, pp. 525–535, Mar. 2004. [DOI] [PubMed] [Google Scholar]
- [25].Sokolov A., Hellerud B. C., Johannessen E. A., and Mollnes T. E., “Inflammatory response induced by candidate biomaterials of an implantable microfabricated sensor,” in J. Biomed. Mater. Res. A, vol. 100, pp. 1142–1150, May 2012. [DOI] [PubMed] [Google Scholar]
- [26].Kim G., Kim H., Kim I. J., Kim J. R., Lee J. I., and Ree M., “Bacterial adhesion, cell adhesion and biocompatibility of Nafion films,” in J. Biomater. Sci., Polymer Ed., vol. 20, no. 12, pp. 1687–1707, 2009. [DOI] [PubMed] [Google Scholar]
- [27].Falco E., Patel M., and Fisher J. P., “Recent developments in cyclic acetal biomaterials for tissue engineering applications,” in Pharmaceutical Res., vol. 25, pp. 2348–2356, Oct. 2008. [DOI] [PubMed] [Google Scholar]
- [28].Zhao Q., Majsztrik P., and Benziger J., “Diffusion and interfacial transport of water in Nafion,” in J. Phys. Chem. B, vol. 115, no. 12, pp. 2717–2727, 2011. [DOI] [PubMed] [Google Scholar]