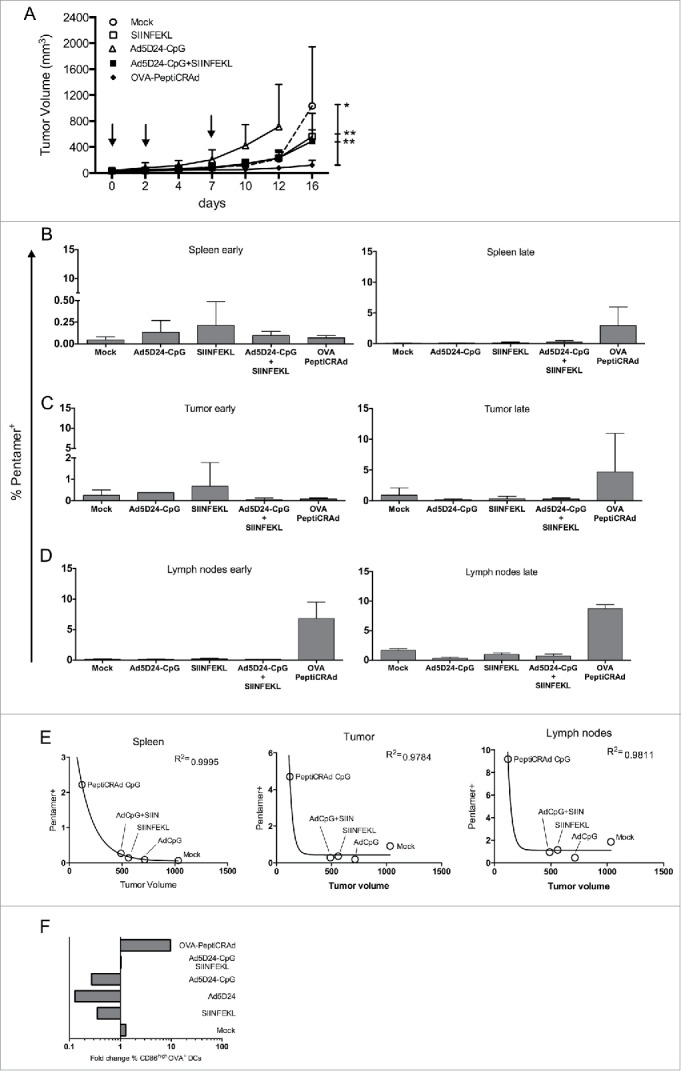
Figure 5.

Antitumor efficacy of PeptiCRAd and immunological analysis of antigen-specific CD8+ T cells and DCs. C57BL/6 mice (n=8–9) received 3×10⁵ B16-OVA cells in both flanks. Treatment was initiated nine days later and included saline solution (mock), peptide alone (SIINFEKL), virus alone (Ad5D24-CpG), a mixture of virus and SIINFEKL peptide (Ad5D24-CpG+SIINFEKL), and Ad5D24-polyK-SIINFEKL complex (OVA-PeptiCRAd). Mice were treated three times (on days 0, 2, and 7; black arrows). At day 7, before the third injection, mice from each group were sacrificed for early immunological analysis (n = 2–3). The late immunological analysis was performed on samples collected at the end of the experiment (tumors and spleens n = 3–4; lymph nodes n = 2–3). (A) Average tumor volume is represented excluding mice sacrificed at day 7. The percentage of SIINFEKL-Pentamer+ cells among CD19−CD8+ T-cells is reported for spleens (B), tumors (C) and draining lymph nodes (D) at early (left panels) and late (right panels) time points. Samples from Ad5D24-CpG group were collected at day 12. Data are presented as the mean ± SD. (E) The average tumor size at the end of the experiment was plotted against the average percentage of SIINFEKL-Pentamer+ CD8+ T cells at late time point. A correlation analysis was performed using a non-linear exponential model and the R square value is reported for each set of data. (E) Dendritic cells (CD19−CD3−CD11c+) showing a mature profile (CD86high) and cross-presenting SIINFEKL on their H2-Kb was determined in the spleens 7 and 16 d after the start of the treatment. The fold change between the two time points is presented. Statistical analysis was done using unpaired Mann–Whitney test; *p < 0.05, **p < 0.01.
