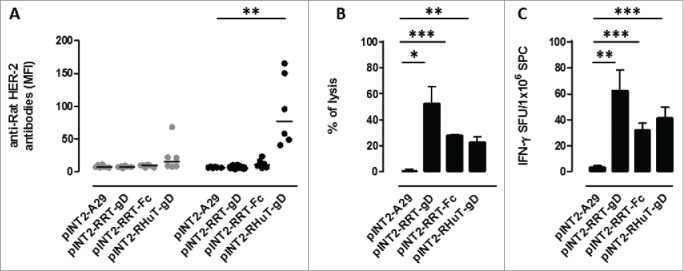
Figure 2.

Anti-rat-Her-2 immune responses induced by DNA vaccination with the different pINT2 expression plasmids. (A) Sera from BALB/c mice collected two weeks after the first (gray dots; n=6) and the second (black dots; n=6) vaccination were analyzed (at a dilution of 1:100) for the presence of specific anti-rat-Her-2 antibodies by flow cytometry. Results are expressed as MFI values for each serum. Horizontal lines represent median values (**: p = 0.003, Student's t test). (B) In vivo cytotoxic responses against the H2d dominant, rat Her-2 TYVPANASL peptide measured two weeks after the second vaccination in mice (n=3) immunized with the indicated pINT2 plasmids; data are mean values ± SEM. (*: p = 0.02; **: p = 0.005; ***: p <0.0001; Student's t-test). (C) T-cell responses against the H2d dominant, rat Her-2 TYVPANASL peptide measured in vitro, two weeks after the second vaccination, in mice (n=3) immunized with the indicated pINT2 plasmids, using an IFNγ-based ELISPOT assay. Data, expressed as SFU/1×106 SPC, are presented as mean ± SEM values (**: p = 0.001, ***: p = 0.0008; Student's t-test).
