Significance
Rotavirus is the most common cause of diarrhea among infants and children worldwide, and is still responsible for over 400,000 deaths per year, affecting mainly developing countries. This study investigates its transmission dynamics and their response to climate forcing, specifically flooding, in the megacity of Dhaka, Bangladesh, with an extensive surveillance record that spans over two decades and is spatially resolved. With a transmission model informed by these data, we show that consideration of different parts of the city, core and periphery, is critical to uncover important differences in seasonal outbreaks and in the effect of the monsoons. Infectious diseases not typically considered climate-sensitive can become so under demographic and environmental conditions of large urban centers of the developing world.
Keywords: monsoon flooding, diarrheal disease, rotavirus transmission, epidemiological model, urban health
Abstract
The role of climate forcing in the population dynamics of infectious diseases has typically been revealed via retrospective analyses of incidence records aggregated across space and, in particular, over whole cities. Here, we focus on the transmission dynamics of rotavirus, the main diarrheal disease in infants and young children, within the megacity of Dhaka, Bangladesh. We identify two zones, the densely urbanized core and the more rural periphery, that respond differentially to flooding. Moreover, disease seasonality differs substantially between these regions, spanning variation comparable to the variation from tropical to temperate regions. By combining process-based models with an extensive disease surveillance record, we show that the response to climate forcing is mainly seasonal in the core, where a more endemic transmission resulting from an asymptomatic reservoir facilitates the response to the monsoons. The force of infection in this monsoon peak can be an order of magnitude larger than the force of infection in the more epidemic periphery, which exhibits little or no postmonsoon outbreak in a pattern typical of nearby rural areas. A typically smaller peak during the monsoon season nevertheless shows sensitivity to interannual variability in flooding. High human density in the core is one explanation for enhanced transmission during troughs and an associated seasonal monsoon response in this diarrheal disease, which unlike cholera, has not been widely viewed as climate-sensitive. Spatial demographic, socioeconomic, and environmental heterogeneity can create reservoirs of infection and enhance the sensitivity of disease systems to climate forcing, especially in the populated cities of the developing world.
Many infectious diseases, especially those infectious diseases that are water-borne and vector-borne, have been shown to exhibit significant interannual variability in the size of seasonal outbreaks (e.g., 1–6). Identification of climate factors shaping interannual and seasonal variability is prerequisite to an understanding of the basic transmission biology of these environmentally driven diseases, and of their response to climate change. The impact of climate factors on the population dynamics of infectious diseases has typically been addressed at large spatial scales by aggregating surveillance data over whole countries, regions, and cities (e.g., 3, 4, 6–8). Global climate drivers, such as the El Niño Southern Oscillation (ENSO), are expected to operate over large spatial scales, synchronizing fluctuations of disease incidence across space [i.e., the Moran effect in population dynamics (9, 10)]. A recent study has shown, however, that the spatiotemporal dynamics of cholera in Dhaka, Bangladesh, are not homogeneous at intraurban scales (11). Two regions or clusters were identified, corresponding, respectively, to the highly populated core and the more rural periphery. The urban core was shown to be more climate-sensitive, acting to propagate climate perturbations in cholera infection risk to the rest of the city. Our study addresses whether such spatial heterogeneity is also visible in the response to climate forcing at seasonal and interannual time scales in another major diarrheal infection, rotavirus. Because, unlike cholera, rotavirus does not appear to possess an environmental transmission pathway, it has not been viewed as a climate-sensitive infection. Here, we examine the role of the monsoons, and particularly flooding, in modulating the transmission of rotavirus. We inquire into whether such an effect might vary across local scales within a large urban environment.
Rotavirus is the most common cause of diarrhea among infants and young children worldwide, responsible for 40% of childhood gastroenteritis hospitalizations and 37% of diarrhea-related deaths in children younger than 5 y (12, 13). This disease was recently reported to be the second most commonly isolated pathogen after Vibrio cholerae among adults attending urban and rural treatment facilities in Bangladesh (14). Rotavirus is transmitted primarily via the fecal-oral route, and two main seasonal patterns have been described. In temperate regions, incidence tends to peak during winter months (15–20). In the tropics, incidence exhibits less pronounced seasonal variation (16, 21), with year-round incidence and peaks during summer or fall following monsoon rains, as in Bangladesh (22, 23). Despite these contrasting patterns, few correlational studies have statistically associated environmental variables with rotavirus incidence (24, 25). We focus here on the monsoon season, and on flooding in particular, which is both a major environmental disturbance in Bangladesh and one of the more prominent local manifestations of the ENSO in this region (26). Specifically, we implement stochastic transmission models to explore the effects of climate forcing within and between years, and across regions of the city. More specifically, they allow us to estimate and compare seasonal transmission intensity in the core and periphery of the city.
Our analyses show that the risk of rotavirus is far higher within the urban core, and aggregation of cases reveals distinct seasonal patterns in the core and periphery, with two peaks per year in the former (in the winter and monsoon seasons) and a single winter peak, with the second one usually absent, in the latter. Pronounced differences are further identified in the force of infection throughout the year and in its response to the monsoons, with distinct effects at the seasonal and interannual time scales for the core and periphery of the city, respectively. These findings underscore the importance of spatial heterogeneity when addressing the role of climate forcing in urban environments. An infection that is not typically considered climate-sensitive can be seen to be so within the highly populated core of the city. We discuss implications for the sensitivity of infectious diseases to changes in climate in the context of the accelerating growth of cities in decades to come.
Results
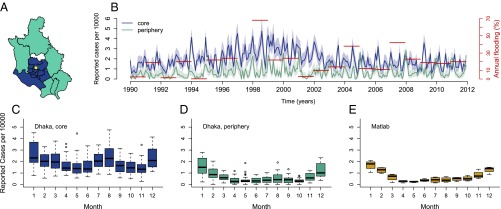
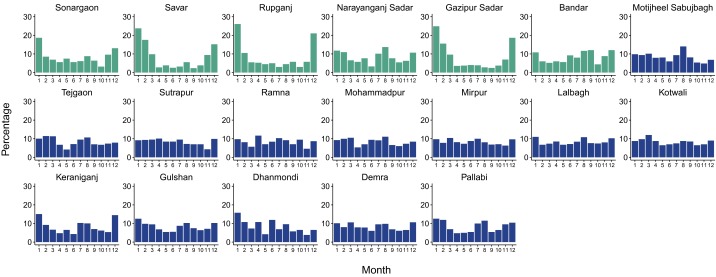
The aggregation of the 22 y of data by core and periphery (Fig. 1A) reveals that the incidence rate in the core is almost threefold the incidence rate in the periphery (Fig. 1B). The two zones display distinct, hitherto unremarked, patterns of seasonality, which are also representative of variation at the thana level (Fig. S1). Specifically, rotavirus cases in the core exhibit a temporal pattern similar to the pattern described previously for tropical countries, with one peak during winter months and another during the monsoon season (Fig. 1C). The average number of reported cases cumulating from June to September for the monsoon season is comparable to the number of reported cases obtained from November to February for the winter season (6% smaller). However, the second peak in cases is less pronounced in the periphery, and less than half the size of the winter peak (57% smaller; Fig. 1D). A similar seasonal pattern is found in Matlab, a rural area 55 km southeast of Dhaka (Fig. 1E). These seasonal patterns suggest important differences in disease transmission within the city. In terms of climate fluctuations, severity of flooding shows year-to-year variation, with the most severe floods recorded for the years 1998, 2004, and 2007 (Fig. 1B).
Fig. 1.
Data. (A) Administrative subdivisions or thanas of Dhaka are divided into two groups: the core region (blue) and the periphery region (cyan), according to the grouping proposed by Reiner et al. (11). The thana in white was excluded from the analyses because of a lack of data before 2001, when it was created. The yellow dot indicates the location of the Dhaka Hospital. (B) Monthly cases of rotavirus from 1990 to 2011 aggregated by region and normalized by population size and annual flooding index (in red); the 95% confidence intervals of a binomial distribution test are shaded in light colors. (C–E) Box plot of the normalized rotavirus cases by month per region. Matlab is a rural area of Bangladesh located 55 km southeast of Dhaka.
Fig. S1.
Percentage of reported cases per month for each thana. Each plot corresponds to a given thana. Thanas that are part of the core are depicted in dark blue, and thanas that belong to the periphery are depicted in cyan. Cases were first added for all years (1990–2011), and the percentage corresponding to each month was then computed. Thanas in the core exhibit a more endemic behavior with less pronounced troughs between seasons; thanas in the periphery typically show a higher peak in the winter and deeper troughs following this outbreak, with low levels of cases during the monsoons. Two thanas to the southeast of the city, Narayanganj Sadar and Bandar (map in Fig. S5) exhibit an intermediate pattern between the two average seasonalities described in the main text. Interestingly, population densities reach high values in a nonnegligible area of these thanas, especially for Narayanganj Sadar (Fig. S5).
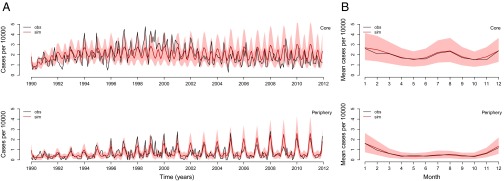
Using a stochastic transmission model (Fig. 2), we tested two different hypotheses. The best model includes flooding as a covariate and performs significantly better than the model without this interannual effect, based on a likelihood ratio test (P = 0.01; Table 1). Fig. 3 illustrates simulations of the monthly cases from estimated initial conditions from 1990 to 2012 for the best model compared with the observed cases. The best-fitting model captures the interannual variation (Fig. 3A) and the main seasonal pattern of the reported cases in both regions (Fig. 3B). Moreover, this model reveals a striking difference in the force of infection (the instantaneous infection risk to each susceptible individual) between both regions, with larger values in the core than in the periphery (Fig. 4 A and B). This difference is of an order of magnitude for the monsoon season, suggesting a higher intensity of transmission during this period. Interestingly, the estimated seasonality of the force of infection for the core of the city is similar to the estimated seasonality of the force of infection for cases in tropical countries, with one peak during winter and another during the monsoon season, and sustained transmission throughout the year. In contrast, the force of infection in the periphery shows one dominant peak during winter and a typically much weaker peak during the monsoon season, with a more epidemic pattern with deeper troughs between those seasons. The second peak is apparent here only in years with large flooding events (Fig. S2): In the periphery, the transmission rate during the monsoon season has a much lower average, yet a more pronounced interannual response to large floods (Fig. 4C).
Fig. 2.
Diagram of the transmission model of rotavirus. The arrows indicate rates of flow among compartments. Each population, for the core and periphery, respectively, is divided into the following classes: newborn (M), susceptible (, , ), and infected (, , ). The three levels of susceptible and infected individuals are meant to represent the recurrent exposure of individuals to the pathogen, as they acquire increasing protection and eventually become asymptomatic (after the second infection). The effect of movement between populations is incorporated within the force of infection (Eq. 2).
Table 1.
Likelihood-based comparison of the different models
| Model | Log-likelihood | SE | No. of parameters | AIC | Likelihood ratio test |
| With flooding effect | −1577.6 | 0.33 | 25 | 3205.2 | |
| Without flooding effect | −1582.2 | 0.35 | 23 | 3210.4 | P = 0.01 |
Fig. 3.
Comparison of simulated cases with those cases reported for the core and periphery of Dhaka. Time series (A) and seasonal pattern (B) for the observed cases (obs; black) and the mean of 1,000 model simulations (sim; red). The 10% and 90% percentiles of the simulated data are shaded in light red. The model simulations are not next step predictions, but numerical simulations of the model forward for the whole time period of the study starting with estimated initial conditions.
Fig. 4.
Force of infection and transmission rate from one simulation for the period 1997–2011. (A and B) Box plot of the force of infection by month per region. The force of infection is defined as the per capita rate at which susceptible individuals become infected. (C) Transmission rate by month per region. The maximum peak value relative to the mean for the monsoon season equals 1.05 and 1.36 for the core and periphery (Periph), respectively. Corresponding estimates of are provided in Supporting Information.
Fig. S2.
Percentage of the total cases falling in a given month on average (in gray) and for years with anomalous flooding (in cyan) for the periphery. Values of the flooding index for 1998, 2007, and 2004 are 68%, 42%, and 38%, respectively (percentages are calculated as in Fig. S1).
The maximum likelihood estimates of the parameters reveal additional features of the dynamics (Table 2 and Figs. S3 and S4): The coupling between the core and periphery appears weak ( = 0.96 and = 0.87), maternal immunity of newborn individuals () wanes rapidly, the duration of infection () is between 7 and 15 d, and individuals in the class have an infection that is long-lasting (, about 16-fold longer). As we discuss below, we interpret the value of this duration as indicating the presence of a transmission reservoir.
Table 2.
Parameter estimates and confidence intervals
| Description | Value | Confidence interval |
| Average lifespan, y | 50 | Fixed |
| Duration of infection, d | 10 | 7–15 |
| Duration of maternal immunity, d | 1 | 0–110 |
| ρ Reporting rate | 2.3 | 1.8–3.6 |
| Coupling core | 0.96 | 0.90–0.98 |
| Coupling periphery | 0.87 | 0.31–1.00 |
| σ Susceptibility reduction | 0.19 | 0.12–0.24 |
| η Additional duration of infection | 0.06 | 0.04–0.09 |
Fig. S3.
Log-likelihood profiles for epidemiological parameters. The intersection between the red dashed line and the vertical dashed lines indicates the 95% CI of each parameter.
Fig. S4.
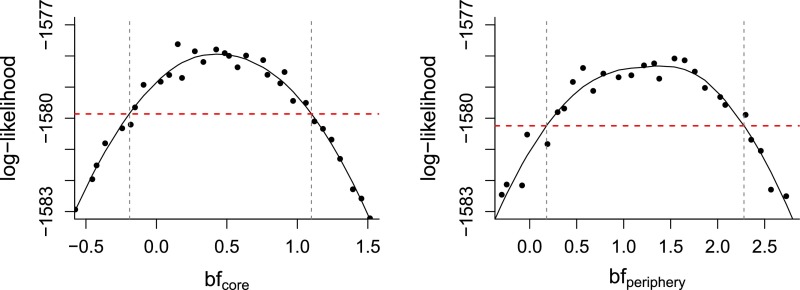
Coefficient representing the interannual effect of flooding for the core and periphery. The likelihood profile curves are shown, with the intersection between the solid and dashed lines indicating the 95% CI for each region.
Finally, an alternative explanation for the higher overall number of cases in the core than in the periphery, and for their differential seasonality, might be that access to the hospital, which is located in the former region (Fig. 1), is limited and especially impaired during the monsoons. Differences in hospital attendance rather than in the force of infection would explain the empirical patterns. To test this alternative hypothesis, an additional model was considered in which the transmission rate is the same for both regions but their reporting rate differs. Four reporting rates are estimated to allow for different values outside and inside the monsoon season (June through September) for the core and periphery, respectively. The log-likelihood of this model was 29 units lower than our best model [log-likelihood = −1,606.9 and Akaike information criterion (AIC) = 3,256 vs. log-likelihood = −1,577.6 and AIC = 3,205]. Additional arguments against this alternative explanation are presented below.
Discussion
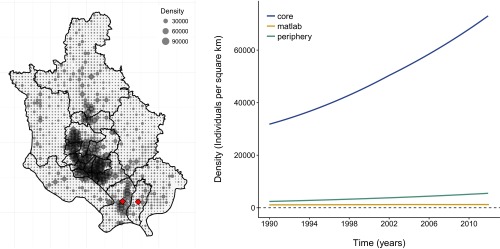
Consideration of two different parts of the city, a densely populated core and a more rural periphery, appears essential to understand seasonal and interannual variation of this major diarrheal infection in response to climate forcing by the monsoons. In particular, our analysis reveals pronounced spatial heterogeneity in both the overall magnitude and the temporal pattern of disease risk within the city. Our results provide evidence that these two regions respond differentially to climate forcing, consistent with previous findings for cholera in the same region (11). The contrasting seasonal patterns described here within the city are consistent with the findings of a recent metaanalysis on rotavirus seasonality proposing that climatic conditions and the degree of country development are better predictors than latitude or geographic location per se (21, 27). The cholera study (11) also suggested that this level of aggregation (core and periphery) is congruent with spatial variation in socioeconomic conditions, including population density (Fig. S5). These factors may act to modulate the effect of climate variables at local spatial scales by enhancing contact and population susceptibility. It is interesting to note that the climate sensitivity of cholera has been traditionally explained with reference to the residence of its etiological agent, the bacterium V. cholerae, in aquatic environments independent of the human host (28). The fact that rotavirus displays climate sensitivity too, in the absence of such an environmental reservoir, suggests that the causal links in the climate–disease connection are not strictly dependent on specific ecological mechanisms related to transmission pathways (29). A similar association with sea surface temperatures in the Pacific for cholera and shigellosis in Bangladesh suggested that the ENSO acts mainly via the modulation of secondary transmission in these diarrheal diseases (e.g., by increasing exposure to contaminated water as well as person-to-person contact) (30).
Fig. S5.
Population density. (Left) Map of the population density for 2010. Each gray dot refers to the density at a resolution of 1 km2. Diamonds in red label the peripheral thanas of Narayanganj Sadar and Bandar. Note the concentration of density values larger than is typically the case in other areas of the periphery, especially for Nrayaganj Sadar, although not as high as in the core of the city. Population data were downloaded from web.ornl.gov/sci/landscan. (Right) Average population density across thanas within each region and for the rural area south of Dhaka known as Matlab.
In addition to socioeconomic and demographic factors, the two regions of the city might more directly differ in susceptibility to flooding itself. Flooding risk and extent appear heterogeneous throughout the city (31), but in a way that is not consistent with this explanation. Moreover, during extreme floods, such as the floods of 1998, more than 50% of the city’s area can be inundated (32).
Our results suggest the presence of a transmission reservoir that maintains transmission between seasons and primes the seasonal response of the system to the monsoons. The existence of such a reservoir is implied by the long duration of infection in the most immune class (), whose individuals are asymptomatic in our model. The more endemic epidemiological pattern of the core region is generated in the model via this reservoir conjoined with high transmission rates. In the core, the monsoon season peak is highly regular, and the relatively small interannual variability in this peak suggests rapid saturation of the transmission system during the season. In the periphery, by contrast, low transmission rates lead to a more epidemic pattern of dynamics (deeper troughs), where the magnitude of the second peak is limited by the rate of transmission during the monsoon season, which varies substantially from year to year. Thus, the degree of interannual and seasonal sensitivity to climate would vary across a transmission gradient, as documented for climate-sensitive diseases, such as malaria, via comparisons of disease dynamics in endemic vs. fringe regions (33, 34), and within an urban landscape here.
The validity of our conclusions vis-à-vis transmission presupposes that the patterns we see in the incidences are not merely due to differential hospital-seeking behavior in the two parts of the city. Three pieces of evidence suggest that this differential reporting rate is not the case. First, the similarity in the seasonal pattern and overall incidence rate between the periphery of Dhaka and the rural area of Matlab, 40 km southeast and the site of an intensive and well-established surveillance system, supports that the observed differences are not merely an artifact of biases in hospital attendance rates. Second, rotavirus rates do not track seasonal rates in hospital attendance rates (e.g., the former decline in the periphery in March, April, and May when values of the latter increase; Fig. S6). Hospital-seeking behavior is driven by a variety of diarrheal infections, particularly by cholera during those months. Finally, we formulated a model specifically allowing for differential reporting rates between the regions and seasons; this model is rejected by the model selection criteria (P < 0.0001).
Fig. S6.
Seasonality of the number of patients visiting the hospital in core (Left) and periphery (Center). (Right) Seasonality of the number of rotavirus cases in the periphery does not track seasonality of the number of patients. Rotavirus cases decline in March, April, and May, when hospital attendance increases (concurrent with the first peak of cholera).
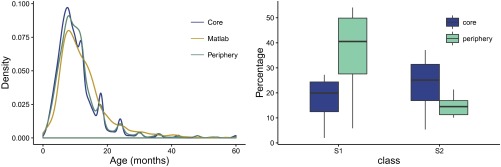
Relationships between force of infection, reinfection frequency, and severity of disease shape the age distribution of cases. Under similar case age distributions across the city, which we find for Dhaka (Fig. S7), the estimated higher force of infection in the core implies that children there also experience more frequent bouts of infection. Pitzer et al. (35) fitted a model similar to ours to age-distribution data, under the assumption of stationarity. We have focused here instead on the dynamic behavior of the system and fitted the model to time series of incidence, ignoring age structure. The fact that these contrasting approaches lead to models that differ in several particulars, including the basic reproduction number, , emphasizes the remaining uncertainties in model structure and parameter values. To resolve these issues, it will be useful to fit rotavirus transmission models to time series of age-specific incidence. Such an effort should further elucidate rotavirus epidemiology and, in particular, the relationship between age structure and force of infection in models with a more complex structure than the well-understood susceptible–infected–recovered (SIR) formulation.
Fig. S7.
Age distribution of cases per region (Left) and box plot of the proportion of individuals in classes and from simulations of the model (Right).
The coupling of the population dynamics of the virus between the two regions of the city is weak in our best model. This result could be further investigated in the future with explicit spatiotemporal information on human movement within the city based on mobile phone data and census data, because these methods continue to develop and have already contributed to a better spatial understanding of transmission in other infectious diseases (36–40). Further research of relevance to early warnings would also benefit from better data on flooding with higher spatiotemporal resolution, more congruent with the spatial scale of the city and the temporal scale of the seasonal transmission dynamics. A finer resolution would allow the explicit consideration of flooding as a seasonal driver. In addition, investigation of seasonal forecasts from hydrological models is warranted. Finally, other model structures should be investigated to examine the nature of the reservoir better and to take into account existing serotype variation within the virus population.
To conclude, our results underscore the importance of considering the spatial heterogeneity of large urban environments when analyzing climate-driven transmission dynamics. Urban heterogeneity can enhance sensitivity of transmission dynamics to climate factors via demographic and socioeconomic conditions, even in infectious diseases that are not necessarily recognized as climate-sensitive to begin with. These conditions can facilitate the persistence of reservoirs of infection and, in so doing, facilitate responses to anomalous climate events and seasonal environmental variation, especially in the populated cities of the developing world and in the future under climate change.
Materials and Methods
Data.
Records of rotavirus cases confirmed by ELISA were obtained from the Dhaka Hospital, through the ongoing and long-term surveillance program of the International Centre for Diarrheal Disease Research, Bangladesh (ICDDR,B). A sample was taken for every 25th patient who visited the hospital from 1990 to 1995, and for every 50th patient from 1996 to 2011. These samples were extrapolated to correct for the frequency of sampling and to produce a consistent time series across time. The cases were aggregated by month per administrative subdivision or thana. The population for each thana was exponentially interpolated from the decadal censuses (1981, 1991, and 2001) to generate the monthly values. The cases were then aggregated for the two different parts of the city as proposed by Reiner et al. (11) (core and periphery; Fig. 1A). The monthly data for Matlab of rotavirus cases for the period 2010–2013 were obtained from the Matlab Hospital. The flooding data consist of the annual percentage of country area flooded, provided by the Annual Flood Report of the Flood Forecasting and Warning Centre, Bangladesh. We drive the model with the flooding anomaly F (the flooding index with its mean value subtracted). For data access, coauthors from the ICDDR,B should be contacted and data access would be guided by the data-sharing policy of the ICDDR,B.
Transmission Model.
To describe the population dynamics of the disease within a region, we adapted the model proposed by Pitzer et al. (41) and coupled transmission between regions (Fig. 2). Newborns enter the class, where they are protected from infection by maternal Abs. This maternally acquired immunity wanes at rate ω as individuals are transferred to the first susceptible class . Because individuals may be infected multiple times during their lifetime (42), gaining immunity by repeated exposure, we considered a structure with multiple classes of infected (, , ) and susceptible (, , ) individuals. Although the recovery class is not included, the model takes into account partial immunity from previous exposure to the pathogen through a reduction in susceptibility following the first infection (σ). Other epidemiological parameters are described in Table 2. The set of stochastic differential equations is given by the following:
| [1] |
represents population size, and the flow of newborns combined with the death rate of each class results in population numbers equal to the population numbers observed for the growth of the city. Furthermore, the force of infection (or rate of transmission per susceptible individual) of each population is given by the following expression:
| [2] |
where is the transmission rate for population i and (1 − ) refers to the movement rate of infected individuals from region i to j, and vice versa. The transmission rate is, in turn, given by the following:
| [3] |
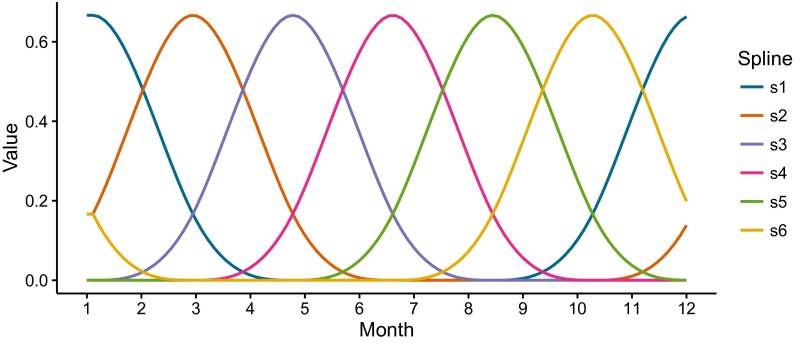
and includes three components: (i) periodic functions of time to incorporate the seasonality through six splines (Fig. S8) and their respective coefficients ; (ii) the interannual effect of flooding (F); and (iii) environmental noise through a Gamma distribution , which represents stochastic variability absent in the climate covariate [details are provided in the study by Laneri et al. (6)]. We note that the effect of climate forcing by the monsoons enters at two different time scales, seasonal and interannual, in this expression. The seasonal effect is represented implicitly by the coefficient , specifically by , because the fourth spline () peaks during the monsoon months (Fig. S8); we therefore interpret the seasonal component quantified by this term as the average influence of the monsoon, which might include effects of humidity and temperature, and not necessarily or uniquely the effects of flooding. Additional variability is introduced across years through explicit consideration of an interannual effect of flooding (F), which, as a major manifestation of the monsoons, is also localized during those same months by its dependency on and multiplicatively modulates this seasonal component (Eq. 3).
Fig. S8.
Periodic splines. The six beta splines () used in the expression and estimation of the transmission rate (Eq. 3) are shown. Note the localization of the fourth spline (magenta) during the monsoon months.
We assume that reported cases are sampled from a negative binomial distribution, allowing for measurement noise: casest ∼ NegBin() with mean and overdispersion . The reporting rate is ρ, and represents the symptomatic infected individuals for population i coming from the sum of the individuals entering in class and at time t (Fig. 2). Two additional models are described in Supporting Information. The first one adds an additional parameter to the above model to allow for differential infectiousness of the infected classes. The second one allows us to investigate the hypothesis that the differences between the core and periphery arise from biases in hospital attendance for the core and periphery.
Parameter Estimation and Model Selection.
The estimation of both parameters and initial conditions for all state variables was carried out with an iterated filtering algorithm (MIF, for maximum likelihood iterated filtering) implemented in the R package “pomp” [partially observed Markov processes (43–45)]. This algorithm maximizes the likelihood and allows for the inclusion of both measurement and process noise, in addition to hidden variables, which is a typical limitation of surveillance records that provide a time series for a single observed variable per region. The initial search of parameter space was performed with a grid of 10,000 random parameter combinations, and the output of this search was used as the initial conditions of a more local search. We repeated this process until the maximum likelihood value was stationary. All parameters were estimated, except for μ, which was based on the average lifespan of an individual.
Likelihood-based criteria were used for model selection, including a likelihood ratio test because the models are nested and the AIC, which penalizes the likelihood based on the number of parameters, thus taking into account model complexity.
Alternative Transmission Models
Differential Infectiousness of the Infected Classes.
Variations in infectiousness across the infected classes () are included in the parameter ξ, which acts to scale this quantity in the force of infection, given by:
| [S1] |
The log-likelihood for the maximum likelihood estimate of this model equals −1577.5, with the estimated [confidence interval (CI): 0.59–1.00]. Because this model did not perform significantly better than the model without variation in infectiousness, and because the CIs of ξ include 1, we decided to fix ξ at this value to decrease the number of parameters.
Differential Reporting Rate.
We implemented an alternative model that assumes the same transmission rate across the city but includes different reporting rates across the seasons (monsoon and nonmonsoon months, from June to September) and between the core and periphery. As a consequence, the number of parameters of this model is smaller (by four parameters) than the number of parameters of our main model in Materials and Methods. The measurement model is given by the following: casest ∼ NegBin(), where is the reporting rate for region i and season j. As described in Materials and Methods, denotes the overdispersion and denotes the new symptomatic infections for population i, consisting of the accumulated individuals entering the classes and during the time interval of sampling (). The expression for the transmission rate simplifies to
| [S2] |
The maximum log-likelihood for this model is equal to −1,606.9, with an AIC of 3,256.
Basic Reproductive Number
The basic reproductive number, , refers to the number of secondary infections in a completely susceptible population (i.e., for the whole susceptible population in class ). This number was estimated by using the next-generation method, resulting in the following expression:
| [S3] |
where is the average transmission rate for region i. The value for the core is , and the value for the periphery is .
Acknowledgments
We thank two anonymous referees for their insightful comments. This work was completed in part with resources provided by the University of Chicago Research Computing Center. This research was partially supported by the National Oceanic and Atmospheric Administration (Grant F020704). The case data used in this paper were collected with the support of the ICDDR,B and its donors, who provide unrestricted support to the ICDDR,B for its operation and research. Current donors providing unrestricted support include the Government of the People’s Republic of Bangladesh; the Department of Foreign Affairs, Trade, and Development Canada; the Swedish International Development Cooperation Agency; and the Department for International Development (UK Aid). We thank these donors for their support and commitment to the ICDDR,B’s research efforts. A.A.K. was supported by the Research and Policy in Infectious Disease Dynamics program of the Science and Technology Directorate, US Department of Homeland Security; by the Fogarty International Center, US NIH; and also by research grants from the NIH (Grant 1R01AI101155) and Models of Infectious Disease Agent Study (MIDAS), National Institute of General Medical Sciences (Grant U54-GM111274).
Footnotes
The authors declare no conflict of interest.
This article is a PNAS Direct Submission.
This article contains supporting information online at www.pnas.org/lookup/suppl/doi:10.1073/pnas.1518977113/-/DCSupplemental.
References
- 1.Pascual M, Rodó X, Ellner SP, Colwell R, Bouma MJ. Cholera dynamics and El Niño-Southern Oscillation. Science. 2000;289(5485):1766–1769. doi: 10.1126/science.289.5485.1766. [DOI] [PubMed] [Google Scholar]
- 2.Zhou G, Minakawa N, Githeko AK, Yan G. Association between climate variability and malaria epidemics in the East African highlands. Proc Natl Acad Sci USA. 2004;101(8):2375–2380. doi: 10.1073/pnas.0308714100. [DOI] [PMC free article] [PubMed] [Google Scholar]
- 3.Cazelles B, Chavez M, McMichael AJ, Hales S. Nonstationary influence of El Niño on the synchronous dengue epidemics in Thailand. PLoS Med. 2005;2(4):e106. doi: 10.1371/journal.pmed.0020106. [DOI] [PMC free article] [PubMed] [Google Scholar]
- 4.Koelle K, Rodó X, Pascual M, Yunus M, Mostafa G. Refractory periods and climate forcing in cholera dynamics. Nature. 2005;436(7051):696–700. doi: 10.1038/nature03820. [DOI] [PubMed] [Google Scholar]
- 5.Nagao Y, Koelle K. Decreases in dengue transmission may act to increase the incidence of dengue hemorrhagic fever. Proc Natl Acad Sci USA. 2008;105(6):2238–2243. doi: 10.1073/pnas.0709029105. [DOI] [PMC free article] [PubMed] [Google Scholar]
- 6.Laneri K, et al. Forcing versus feedback: Epidemic malaria and monsoon rains in northwest India. PLOS Comput Biol. 2010;6(9):e1000898. doi: 10.1371/journal.pcbi.1000898. [DOI] [PMC free article] [PubMed] [Google Scholar]
- 7.Hoshen MB, Morse AP. A weather-driven model of malaria transmission. Malar J. 2004;3(1):32–46. doi: 10.1186/1475-2875-3-32. [DOI] [PMC free article] [PubMed] [Google Scholar]
- 8.Sultan B, Labadi K, Guégan JF, Janicot S. Climate drives the meningitis epidemics onset in west Africa. PLoS Med. 2005;2(1):e6. doi: 10.1371/journal.pmed.0020006. [DOI] [PMC free article] [PubMed] [Google Scholar]
- 9.Moran PAP. The statistical analysis of the Canadian lynx cycle. Aust J Zool. 1953;1(3):291–298. [Google Scholar]
- 10.Hudson PJ, Cattadori IM. The Moran effect: A cause of population synchrony. Trends Ecol Evol. 1999;14(1):1–2. doi: 10.1016/s0169-5347(98)01498-0. [DOI] [PubMed] [Google Scholar]
- 11.Reiner RC, Jr, et al. Highly localized sensitivity to climate forcing drives endemic cholera in a megacity. Proc Natl Acad Sci USA. 2012;109(6):2033–2036. doi: 10.1073/pnas.1108438109. [DOI] [PMC free article] [PubMed] [Google Scholar]
- 12.Parashar UD, Hummelman EG, Bresee JS, Miller MA, Glass RI. Global illness and deaths caused by rotavirus disease in children. Emerg Infect Dis. 2003;9(5):565–572. doi: 10.3201/eid0905.020562. [DOI] [PMC free article] [PubMed] [Google Scholar]
- 13.Tate JE, et al. WHO-coordinated Global Rotavirus Surveillance Network 2008 estimate of worldwide rotavirus-associated mortality in children younger than 5 years before the introduction of universal rotavirus vaccination programmes: A systematic review and meta-analysis. Lancet Infect Dis. 2012;12(2):136–141. doi: 10.1016/S1473-3099(11)70253-5. [DOI] [PubMed] [Google Scholar]
- 14.Ferdous F, et al. Aetiologies of diarrhoea in adults from urban and rural treatment facilities in Bangladesh. Epidemiol Infect. 2015;143(7):1377–1387. doi: 10.1017/S0950268814002283. [DOI] [PMC free article] [PubMed] [Google Scholar]
- 15.Konno T, et al. Influence of temperature and relative humidity on human rotavirus infection in Japan. J Infect Dis. 1983;147(1):125–128. doi: 10.1093/infdis/147.1.125. [DOI] [PubMed] [Google Scholar]
- 16.Cook SM, Glass RI, LeBaron CW, Ho MS. Global seasonality of rotavirus infections. Bull World Health Organ. 1990;68(2):171–177. [PMC free article] [PubMed] [Google Scholar]
- 17.Purohit SG, Kelkar SD, Simha V. Time series analysis of patients with rotavirus diarrhoea in Pune, India. J Diarrhoeal Dis Res. 1998;16(2):74–83. [PubMed] [Google Scholar]
- 18.Bresee J, et al. Asian Rotavirus Surveillance Network First report from the Asian Rotavirus Surveillance Network. Emerg Infect Dis. 2004;10(6):988–995. doi: 10.3201/eid1006.030519. [DOI] [PMC free article] [PubMed] [Google Scholar]
- 19.Nakagomi T, et al. Incidence and burden of rotavirus gastroenteritis in Japan, as estimated from a prospective sentinel hospital study. J Infect Dis. 2005;192(Suppl 1):S106–S110. doi: 10.1086/431503. [DOI] [PubMed] [Google Scholar]
- 20.D’Souza RM, Hall G, Becker NG. Climatic factors associated with hospitalizations for rotavirus diarrhoea in children under 5 years of age. Epidemiol Infect. 2008;136(1):56–64. doi: 10.1017/S0950268807008229. [DOI] [PMC free article] [PubMed] [Google Scholar]
- 21.Levy K, Hubbard AE, Eisenberg JNS. Seasonality of rotavirus disease in the tropics: A systematic review and meta-analysis. Int J Epidemiol. 2009;38(6):1487–1496. doi: 10.1093/ije/dyn260. [DOI] [PMC free article] [PubMed] [Google Scholar]
- 22.Hieber JP, Shelton S, Nelson JD, Leon J, Mohs E. Comparison of human rotavirus disease in tropical and temperate settings. Am J Dis Child. 1978;132(9):853–858. doi: 10.1001/archpedi.1978.02120340029004. [DOI] [PubMed] [Google Scholar]
- 23.Stoll BJ, et al. Surveillance of patients attending a diarrhoeal disease hospital in Bangladesh. Br Med J (Clin Res Ed) 1982;285(6349):1185–1188. doi: 10.1136/bmj.285.6349.1185. [DOI] [PMC free article] [PubMed] [Google Scholar]
- 24.Rahman M, et al. Prevalence of G2P[4] and G12P[6] rotavirus, Bangladesh. Emerg Infect Dis. 2007;13(1):18–24. doi: 10.3201/eid1301.060910. [DOI] [PMC free article] [PubMed] [Google Scholar]
- 25.Hashizume M, et al. Rotavirus infections and climate variability in Dhaka, Bangladesh: A time-series analysis. Epidemiol Infect. 2008;136(9):1281–1289. doi: 10.1017/S0950268807009776. [DOI] [PMC free article] [PubMed] [Google Scholar]
- 26.Cash BAX, Rodó JL, Kinter III. Links between tropical Pacific SST and cholera incidence in Bangladesh: Role of the eastern and central tropical Pacific. J Clim. 2008;21:4647–4663. [Google Scholar]
- 27.Patel MM, et al. Global seasonality of rotavirus disease. Pediatr Infect Dis J. 2013;32(4):e134–e147. doi: 10.1097/INF.0b013e31827d3b68. [DOI] [PMC free article] [PubMed] [Google Scholar]
- 28.Colwell RR. Global climate and infectious disease: Tthe cholera paradigm. Science. 1996;274(5295):2025–2031. doi: 10.1126/science.274.5295.2025. [DOI] [PubMed] [Google Scholar]
- 29.Lipp EK, Huq A, Colwell RR. Effects of global climate on infectious disease: The cholera model. Clin Microbiol Rev. 2002;15(4):757–770. doi: 10.1128/CMR.15.4.757-770.2002. [DOI] [PMC free article] [PubMed] [Google Scholar]
- 30.Cash BA, et al. Cholera and shigellosis: Different epidemiology but similar responses to climate variability. PLoS One. 2014;9(9):e107223. doi: 10.1371/journal.pone.0107223. [DOI] [PMC free article] [PubMed] [Google Scholar]
- 31.Dewan A, Corner R. Dhaka Megacity Geospatial Perspectives on Urbanisation, Environment and Health. Springer, Dordrecht; 2014. [Google Scholar]
- 32.Faisal IM, Kabir MR, Nishat A. The disastrous flood of 1998 and long-term mitigation strategies for Dhaka City. Nat Hazards (Dordr) 2003;28:85–99. [Google Scholar]
- 33.Laneri K, et al. Dynamical malaria models reveal how immunity buffers effect of climate variability. Proc Natl Acad Sci USA. 2015;112(28):8786–8791. doi: 10.1073/pnas.1419047112. [DOI] [PMC free article] [PubMed] [Google Scholar]
- 34.Pascual M. Climate and Population Immunity in Malaria Dynamics: Harnessing Information from Endemicity Gradients. Trends Parasitol. 2015;31(11):532–534. doi: 10.1016/j.pt.2015.08.009. [DOI] [PubMed] [Google Scholar]
- 35.Pitzer VE, et al. Influence of birth rates and transmission rates on the global seasonality of rotavirus incidence. Journal of the Royal Society Interface. 2011;8(64):1584–1593. doi: 10.1098/rsif.2011.0062. [DOI] [PMC free article] [PubMed] [Google Scholar]
- 36.Wesolowski A, et al. Quantifying the impact of human mobility on malaria. Science. 2012;338(6104):267–270. doi: 10.1126/science.1223467. [DOI] [PMC free article] [PubMed] [Google Scholar]
- 37.Buckee CO, Wesolowski A, Eagle NN, Hansen E, Snow RW. Mobile phones and malaria: Modeling human and parasite travel. Travel Med Infect Dis. 2013;11(1):15–22. doi: 10.1016/j.tmaid.2012.12.003. [DOI] [PMC free article] [PubMed] [Google Scholar]
- 38.Dalziel BD, Pourbohloul B, Ellner SP. Human mobility patterns predict divergent epidemic dynamics among cities. Proc Biol Sci. 2013;280(1766):20130763. doi: 10.1098/rspb.2013.0763. [DOI] [PMC free article] [PubMed] [Google Scholar]
- 39.Richardson DB, et al. Medicine. Spatial turn in health research. Science. 2013;339(6126):1390–1392. doi: 10.1126/science.1232257. [DOI] [PMC free article] [PubMed] [Google Scholar]
- 40.Wesolowski A, Eagle N, Noor AM, Snow RW, Buckee CO. The impact of biases in mobile phone ownership on estimates of human mobility. J R Soc Interface. 2013;10(81):20120986. doi: 10.1098/rsif.2012.0986. [DOI] [PMC free article] [PubMed] [Google Scholar]
- 41.Pitzer VE, et al. Demographic variability, vaccination, and the spatiotemporal dynamics of rotavirus epidemics. Science. 2009;325(5938):290–294. doi: 10.1126/science.1172330. [DOI] [PMC free article] [PubMed] [Google Scholar]
- 42.Velázquez FR, et al. Rotavirus infections in infants as protection against subsequent infections. N Engl J Med. 1996;335(14):1022–1028. doi: 10.1056/NEJM199610033351404. [DOI] [PubMed] [Google Scholar]
- 43.Ionides EL, Bretó C, King AA. Inference for nonlinear dynamical systems. Proc Natl Acad Sci USA. 2006;103(49):18438–18443. doi: 10.1073/pnas.0603181103. [DOI] [PMC free article] [PubMed] [Google Scholar]
- 44.King AA, et al. 2015 pomp: Statistical Inference for Partially Observed Markov Processes (R package, version 1.0.0.0). Available at pomp.r-forge.r-project.org. Accessed May 1, 2015.
- 45.King AA, Nguyen D, Ionides EL. Statistical inference for partially observed Markov processes via the R Package pomp. J Stat Softw. 2015 in press. [Google Scholar]


