Significance
In animals and machines, our understanding of tactile function has hitherto been based primarily on information collected at, or near to, the region of contact of a tactile probe with an object. Using the human hand as a case in point, we show that during natural interactions with ordinary objects, mechanical energy originating at finger contact propagates through the whole hand, and that vibration signals that are captured remotely contain sufficient information to discriminate between gestures and between the touched objects. Our results shed light on possible tactile processes in humans and animals and may yield advances in tactile sensing for robotic manipulation or lead to novel paradigms for wearable computing.
Keywords: touch, haptics, vibration, cutaneous, skin
Abstract
We investigated the propagation patterns of cutaneous vibration in the hand during interactions with touched objects. Prior research has highlighted the importance of vibrotactile signals during haptic interactions, but little is known of how vibrations propagate throughout the hand. Furthermore, the extent to which the patterns of vibrations reflect the nature of the objects that are touched, and how they are touched, is unknown. Using an apparatus comprised of an array of accelerometers, we mapped and analyzed spatial distributions of vibrations propagating in the skin of the dorsal region of the hand during active touch, grasping, and manipulation tasks. We found these spatial patterns of vibration to vary systematically with touch interactions and determined that it is possible to use these data to decode the modes of interaction with touched objects. The observed vibration patterns evolved rapidly in time, peaking in intensity within a few milliseconds, fading within 20–30 ms, and yielding interaction-dependent distributions of energy in frequency bands that span the range of vibrotactile sensitivity. These results are consistent with findings in perception research that indicate that vibrotactile information distributed throughout the hand can transmit information regarding explored and manipulated objects. The results may further clarify the role of distributed sensory resources in the perceptual recovery of object attributes during active touch, may guide the development of approaches to robotic sensing, and could have implications for the rehabilitation of the upper extremity.
When we touch an object, a cascade of mechanical events ensues, and through it, vibration is transmitted, not just to the fingertips, but broadly within the hard and soft tissues of the hand. Prior research has shed light on mechanical signals generated during object palpation or manipulation, the transduction of such signals into neural signals, and the salience of different contact-generated stimuli. It has been shown that the responses of somatosensory neurons should be understood in light of perceptual functions that integrate input from several tactile submodalities (1, 2).
Tactile mechanics yield numerous perceptual cues that inform the brain about key properties of the external mechanical world such as the presence of an object through contact (3), slip against a surface (4), object deformation (5, 6), and object shape (7, 8). Among these cues, touch-induced vibrations play important roles. Until recently, it has been assumed that perceptual information generated during haptic interaction is confined to the region of skin–object contact. It has subsequently been demonstrated, however, that perceptually meaningful mechanical energy can propagate away from the origin of contact, sometimes beyond the hand itself (9, 10), and that humans are capable of using this information to evaluate surface roughness (11). Recent measurements have demonstrated that skin vibrations reflect the fine scale topography of touched objects (12). It is nonetheless not known whether touch-elicited vibrations contain more general information about an object that would be available at significant distances from the contact location.
At frequencies greater than about 100 Hz, mechanical damping dominates elasticity (13), and the skin can be thought of as a fluid-filled layer that can be excited vibromechanically (14). In this regime, mechanical transients propagate within glabrous skin at fast, yet frequency-dependent, speeds ranging from 5 to 7 m/s within the vibrotactile range (15). Despite the dispersive nature of wave propagation in the skin, complex waveforms appear to be well preserved at distances of at least several centimeters, and possibly much further (9), suggesting that perceptual information content may remain intact far from the site of stimulation. Although the amplitude of vibrations propagating in skin decay with distance (15, 16), decay is lower at frequencies relevant to vibrotactile sensation (near 250 Hz), and contact induced vibrations can remain above detectable thresholds at distances spanning most of the hand. However, the spatial and temporal propagation patterns of touch-elicited vibrations in the hand have not been characterized.
Prior literature sheds little light on the functional role that is played by mechanoreceptors that are far removed from areas of skin that are in contact with objects, but mechanical stimuli are known to excite sensory cells over wide areas (3). Pacinian corpuscles (PCs) have receptive fields that can span several centimeters and are located in the deep dermis of the volar (glabrous) and dorsal (hairy) skin of the hand (17–22). PC units respond to stimuli in a wide frequency range (∼20 Hz to 1 kHz). Several studies have associated PC units in hairy skin with vibrotactile sensory function (23, 24), including the detection of remote tapping (20). That the PC system is strongly implicated in the detection of fast mechanical signals does not exclude that other populations of sensory cells may also contribute. Merkel cell-neurites, which are abundant at the interface of the epidermis and which are described as forming the slowing adapting receptor population, have been shown to respond to frequencies in the whole tactile frequency range (25, 26). Similarly, the numerous Meissner corpuscles found in the epidermal grooves of the glabrous skin, and associated with fast adapting afferent units, cannot be excluded from responding to the low-frequency range (10–200 Hz) of stimuli propagating in the skin (27). These stimuli may also provide an input to the network of tendons in the hand and associated muscle spindles (28–30).
Vibromechanical stimuli have occasionally been used in psychophysical studies on stimulus localization (31, 32). The distribution and properties of sensory cells can also enable the remote detection of propagating vibrations away from the site of contact (9). These processes have thus far received limited attention, but further insight into mechanisms of remote tactile sensing could shed light on sensory specializations in the whole hand. Toward this end, we developed an apparatus consisting of an array of accelerometers capable of capturing cutaneous vibration at length and time scales matched to the receptive field sizes and frequency selectivity of fast adapting cutaneous mechanoreceptive afferents in the dorsal surface of the hand. Because this device is worn on the hand, it allowed us to collect data as subjects actively touched objects. We used it to accurately map vibration propagation in the hand during active touch, grasping, and manipulation tasks.
Results
Spatial Patterns of Cutaneous Vibrations.
We measured spatiotemporal vibration patterns in the skin of the hand and fingers during a variety of manual interactions with different objects, materials, and parts of the hand (Table 1). We used arrays of 15 or 30 miniature, three-axis accelerometers that were attached to the dorsal skin of subjects’ hands and fingers (Materials and Methods, SI Materials and Methods, and Figs. S1–S5). Data captured from 40 to 100 repetitions of each trial allowed us to reconstruct smooth maps of vibration intensity distributed over the surface of the hand; Fig. 1 presents examples. The interpolation parameters were obtained from empirically determined and published data on cutaneous vibration propagation (Materials and Methods).
Table 1.
Interaction modes and objects
| Digits | Interaction | Object | Configuration |
| (II) (II,III) | Tap | Steel plate | 15S 15D |
| (II) (II,III) | Tap | Fabric layer | 15S 15D |
| (II) (II,III) | Tap | Dorsal hand skin | 15S 15D |
| (II) (II,III) | Slide | Flat steel plate | 15S 15D |
| (II) (II,III) | Slide | Wood surface | 15S 15D |
| (II) (II,III) | Slide | Foam block | 15S 15D |
| (I)(II)(III)(II,III)(all) | Light tap | Steel plate | 15W |
| (I)(II)(III)(II,III)(all) | Hard tap | Steel plate | 15W |
| (I)(II)(III)(II,III)(all) | Light slide | Steel plate | 15W |
| (I)(II)(III)(II,III)(all) | Hard slide | Steel plate | 15W |
| (I,II) (I,II,III) (all) | Precision grip | Glass cup | 15W |
| (I,II) (I,II,III) (all) | Power grip | Glass cup | 15W |
| (I,II) (I,II,III) | Indirect tap | Plastic stylus | 15W |
| (I) (II) (III) (IV) (V) | Tap | Steel plate | 30W |
| (II,III)(II,III,IV,V)(all) | Tap | Steel plate | 30W |
| (II) | Slide | Steel plate | 30W |
| (I,II) | Precision grip | Small plastic cyl. | 30W |
| (I,II) | Precision grip | Large plastic cyl. | 30W |
| (all) | Power grip | Plastic ball | 30W |
| (I,II) | Indirect tap | Plastic stylus | 30W |
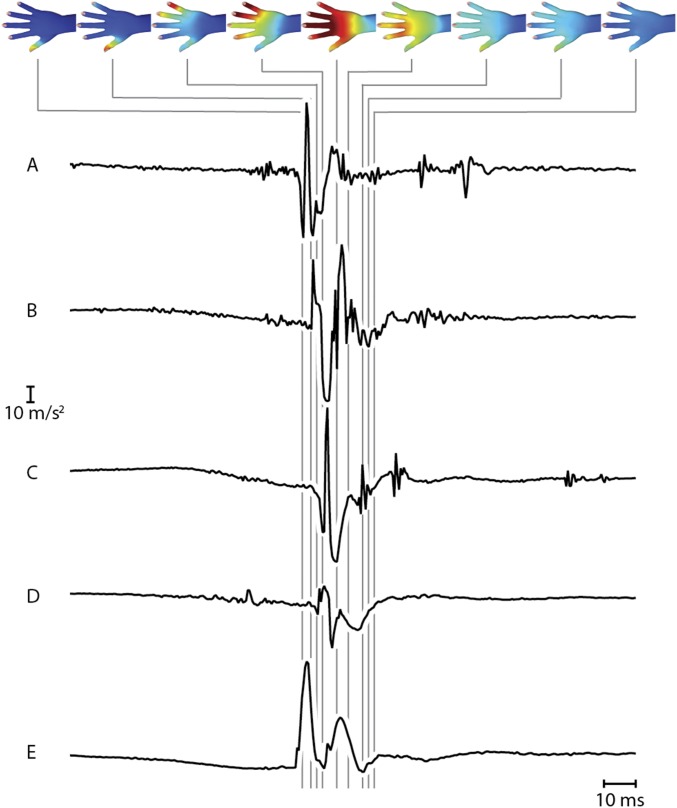
Fig. S1.
An illustration of the spatiotemporal distribution of vibration intensity arising during a single interaction, consisting of tapping all digits on a steel plate. The y axis acceleration recordings from each of several points (A–E) on the distal phalangeal area of each moving finger are shown below. As in the main experiments, the signal components near 0 Hz were removed (without further low-pass filtering or noise reduction). A–E correspond to sensor locations V D, IV D R, III D R, II D R, and I D in configuration 30W (Fig. S3).
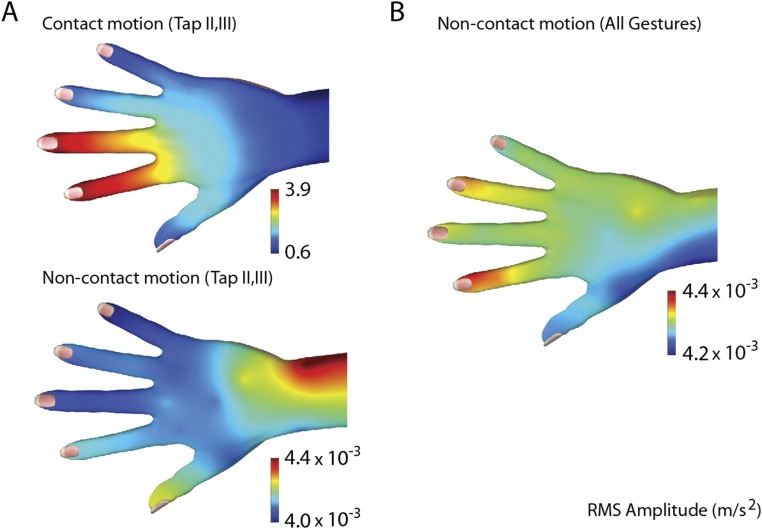
Fig. S5.
Examples illustrating the difference in vibration acceleration magnitude at the skin during hand gestures with and without touch contact. (A) Vibration acceleration magnitude was nearly three orders of magnitude smaller in the noncontact condition (∼ m/s2) than in the contact condition (between 0.6 and 3.9 m/s2). (B) The magnitude of vibration in the noncontact condition remained small (∼ m/s2) when averaged between all measured gestures in the dataset. The noncontact data were extracted from our original data recordings (sensor configuration 30W, all gestures). They were obtained by deleting a segment of time during each trial that corresponded to the touch contact phase and its immediate aftereffects. Because touch elicited vibrations decayed rapidly, the deleted segments averaged less than 100 ms in duration.
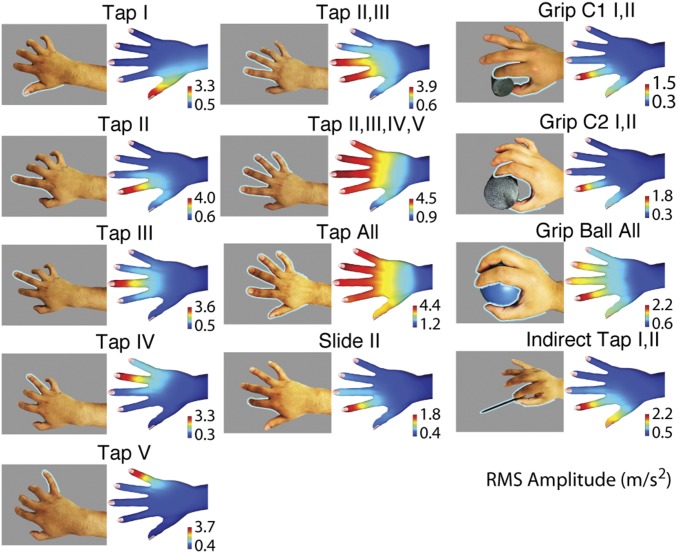
Fig. 1.
Interaction modes and spatial patterns of vibration intensity, averaged between all four subjects (condition 30W).
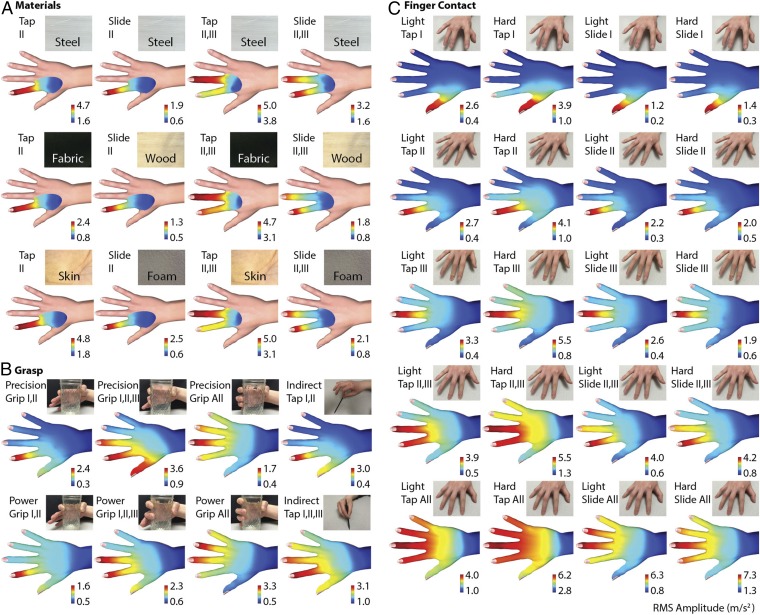
RMS intensity varied systematically over the dorsal surface of the hand (Fig. 2) and visibly depended on the contact interactions that produced them. In all cases, contact occurred near the distal end of the volar surface of the fingers, eliciting mechanical vibrations that propagated through the tissues of the hand. The resulting patterns of vibration reflected the type of interaction, the locations of contact with the hand, the objects, and the materials involved.
Fig. 2.
Patterns of touch-elicited cutaneous vibrations. Surface palpation by tapping and sliding, in one-finger (15S), two-finger (15D), and whole-hand (15W) sensor configurations (SI Materials and Methods). The vibrations were elicited by contact with different materials (A), grasp types (B), and different combinations of fingers (C). The grasped objects consisted of a glass cup and a plastic stylus. Multifinger tapping involved contact of the fingerpads with a flat, steel plate. The amplitude range is normalized for each condition to enhance the distinguishability of the patterns.
As should be expected, the areas closest to the contact region were the most excited. Vibration intensity decayed with distance but could be easily detected by our apparatus far beyond the fingers, achieving maximum peak to peak amplitudes greater than 30 m/s2 at all locations, in all conditions tested, which is well above perceptual and physiological thresholds (23, 33). The different interaction modes gave rise to qualitatively distinct spatial distributions of intensity. Fig. 2 also indicates that the range of vibration intensity appeared to be larger for contact interactions with hard objects than with very soft ones. Moreover, there were systematic differences in vibration propagation patterns for different types of interaction. Tapping with multiple digits elicited broadly distributed patterns of vibration intensity, whereas sliding contact elicited more localized vibration. Similarly, interactions at higher contact forces elicited more widely distributed patterns of vibration than lower forces did, even when normalized for intensity.
Information Content.
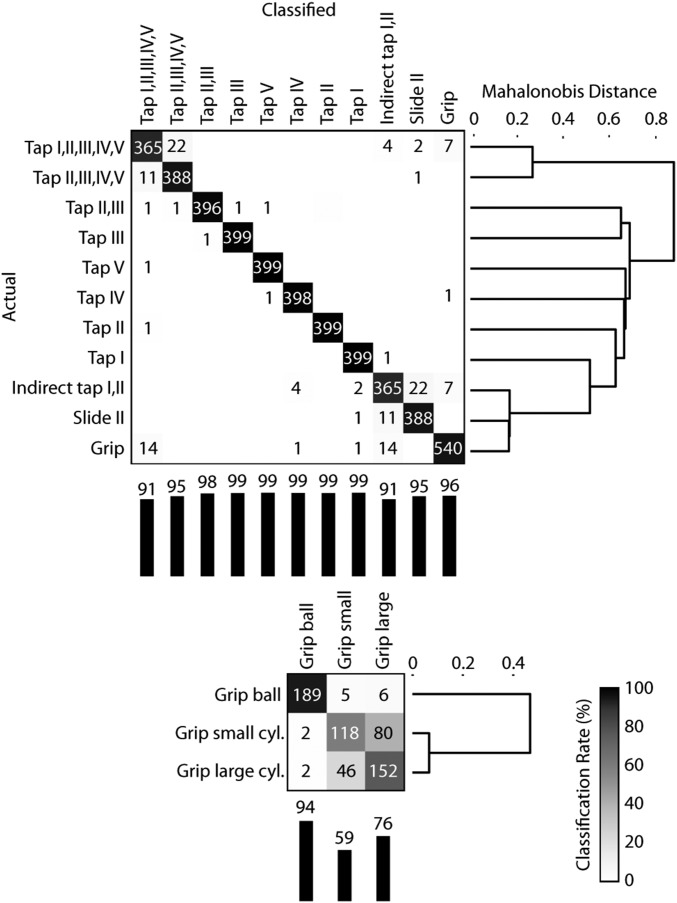
We investigated the possibility of decoding the modes of interaction from these signals using machine learning methods. We trained a support vector machine classifier (SVM) to predict the interaction mode that gave rise to vibration signals that were recorded using the 30-sensor (whole hand) configuration. To accurately classify the grasping interactions, we used a two-level classification hierarchy, with grasp type decoded in the second level (Fig. 3). A high classification accuracy of 97%, after cross-validation, demonstrated that the vibration data alone readily encoded interaction modes. The cases of grasping large or small cylinders were typically the only ones to be confused. For all sensor configurations, vibration patterns were heterogeneous between interaction modes (MANOVA, P < 10−5). The most distinguishable cases included sliding on wood vs. tapping the skin and grasping a cylinder vs. tapping a finger on a steel plate (Table 2). Using similar methods, we found that information about the mode of interaction was available in multiple, distinct frequency bands spanning the range salient to vibrotactile perception. Manual interaction type could be classified solely using measurements restricted to any of six nonoverlapping frequency bands (Table 3). Classification accuracy was greater than 89% in every band, with the highest rate (96.5%) achieved for the 10- to 100-Hz band.
Fig. 3.
Multiclass heirarchical SVM classification matrix for the 13 interaction modes (condition 30W). The second classification level disambiguates the grip type. The data from all four participants were combined for the analysis. Vertical bars report the percent correct for each class. The dendrograms, obtained from the MANOVA analysis, indicate the similarity (Mahalanobis distance) between class means.
Table 2.
Summary of MANOVA results
| Configuration | df | λ | F | Most distinguishable pair |
| 15S | 5 | 54.8* | Slide (wood), tap (skin) | |
| 15D | 5 | 38.2* | Slide (wood), tap (skin) | |
| 15W | 27 | 52.2* | Tap (I), tap (I,II,III,IV,V) | |
| 30W | 12 | 364.5* | Tap I, grip cylinder |
λ, Wilks’ multivariate test statistic; df, number of degrees of freedom of the group means.
Significance at P < 0.001.
Table 3.
Classification rates in six frequency bands
| Band (Hz) | Mean SE (%) |
| 0.1–10 | |
| 10–100 | |
| 100–200 | |
| 200–400 | |
| 400–700 | |
| 700–1,000 |
Differences between the hands of individual subjects could be expected to yield differences in patterns of touch-elicited vibrations. To assess this possibility, we attempted to decode the data from each participant using a classifier that we trained on data collected from the other three participants. The resulting classification rates averaged , indicating that despite individual differences, the information content in these signals was quite resilient, although the small size and relative homogeneity of the subject pool should be noted.
Time Domain Correlates of Touch Interactions.
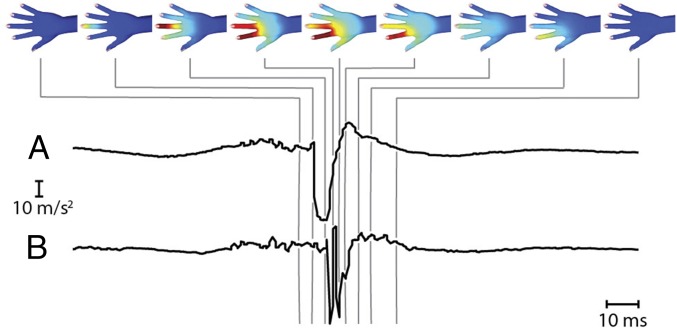
Mechanical vibrations propagating in the skin also reflected the time course of interaction between the hand and touched objects. For example, Fig. 4 illustrates the spatiotemporal pattern of vibration that was elicited when a participant tapped two digits (II, III) on a steel plate, as recorded from a single trial. Because motor behavior is much slower than vibration propagation, gross differences between spatial patterns at successive instants in this example could be attributed to contact timing rather than vibration propagation. Salient events, including asynchronous contact of digits (II) and (III) (delay 10 ms), are readily observed. Contact at the distal end of the digit yielded vibrations that propagated along the digit, across the dorsal surface, and to the wrist, before dissipating. Touch-induced vibrations were observed to vanish within 30 ms of the instant of contact. We further illustrated the time dependence of vibration patterns in the hand by rendering a movie (100-ms duration) from data recorded during tapping of several digits (Movie S1).
Fig. 4.
Spatiotemporal distribution of vibration intensity from a single recording when tapping digits I and II on a steel plate (configuration 30W). The time course of evolution of acceleration (y axis) at locations on the distal phalangeal area of digit III (A) and digit II (B) are shown (for further examples, see Fig. S1).
Frequency Domain Analysis.
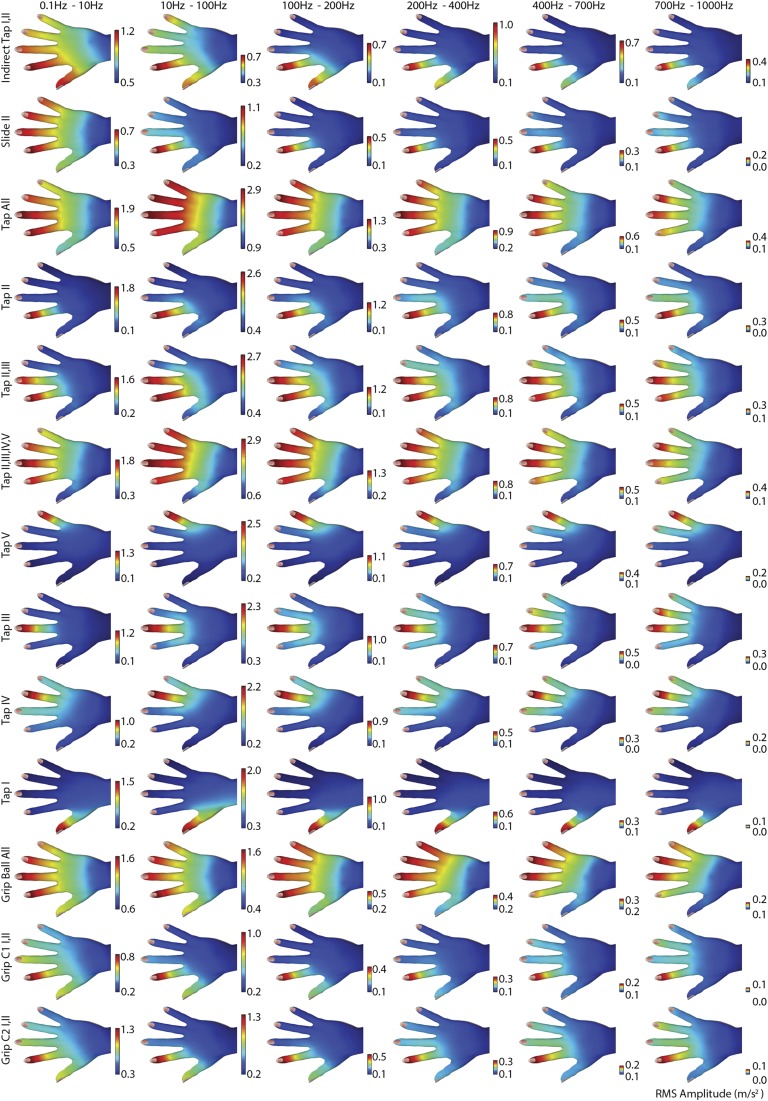
To further characterize spatiotemporal variations in touch-induced vibrations, we constructed frequency-dependent portraits of RMS vibration intensity. We band pass filtered the RMS acceleration signals to separate them into different frequency bands (0.1–10, 10–100, 100–200, 200–400, 400–700, and 700–1,000) and constructed intensity maps for each, using the same method used above (SI Materials and Methods and Fig. S5). The lowest frequency band, from 0.1 to 10 Hz, included motor information because the typical timescale for finger movement was 2 s. Content below 0.1 Hz was largely due to gravity.
There were noticeable differences between direct and indirect tapping gestures. For gestures involving direct finger contact, vibration intensity in the frequency band 10–100 Hz always had the highest amplitude. For indirect tap with a stylus, however, vibration intensity peaked in the bands from 0.1 to 10 Hz and 200 to 400 Hz. When performing indirect tap, vibration energy was transmitted to the digits that were not in contact with the stylus. This occurred primarily at low frequencies, below 100 Hz. Vibrations produced via direct tap were lower in amplitude in higher frequency bands above 10–100 Hz. In contrast, those elicited by gripping a ball varied greatly among frequency bands. We also observed significant differences between patterns elicited by gripping a ball and by contacting a steel plate with the same fingers, especially in the band of 10–100 Hz. In bands above 100 Hz, vibration intensity was generally low when gripping a ball, but decreased rapidly with frequency when contacting a steel plate with all fingers.
SI Materials and Methods
Measurement Apparatus: Details.
We designed a custom electronic package, in the form of a miniature double-side printed circuit board (PCB; width 6 mm, length 8 mm), to minimize size and mass and provide a stable electronic connection for the sensors. They were connected to the data acquisition board via lightweight ribbon cables, whose softness helped to minimize artifacts. Ribbon cables were used to connect the accelerometers to the data acquisition board due their softness that prevents the vibration interference among cables and accelerometers. The contact surface between skin and accelerometer was 4 4 mm in size.
Time-Windowed Acceleration Magnitude Estimation.
Acceleration intensity maps were produced from the acceleration magnitude at each sensor. We computed an estimate for the mean acceleration magnitude by first computing the RMS value of each vector component of the acceleration over a window of N samples beginning at time t
| [S1] |
And then computing the magnitude
| [S2] |
Anatomical Registration and Naming of Sensor Positions.
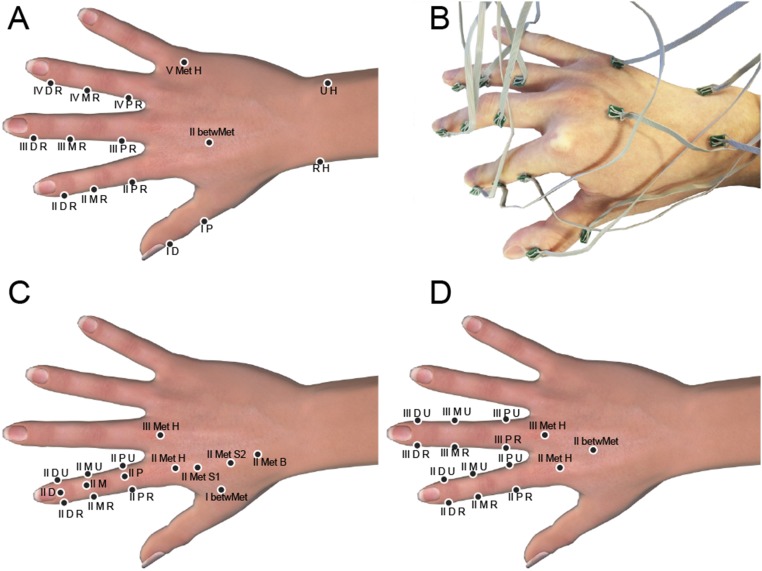
To ensure that the measurements were recorded in conditions that were consistent for all participants in the experiments, we positioned the sensors on each hand in configurations that were as identical as possible relative to the anatomy of each subject. The positions were labeled anatomically as in Figs. S2 and S3. All participants were right handed, and all measurements were recorded of the right hand. Sensors positioned on the digits were labeled with corresponding Roman numerals (I–V). The nearest bone to each sensor was indicated with a letter, so that D represented distal phalange, M represented middle phalange, and P represented proximal phalange. Met represents metacarpus, and betwMet indicated the region between two metacarpal bones. Where two or more sensors were located near to the same bone, the last part of the label was used to indicate the relative position on that bone. U represents ulna or toward the ulnar side of the sagittal plane, whereas R represents radius for the radial side. H referred to the head of the bone, and B’ eferred to the base of the bone. S (or S1, S2) was used to indicate sensor locations on the shaft of the bone.
Fig. S2.
Sensor placement on the fingers and dorsal surface of the hand under 15-accelerometers configuration. (A) Four-finger configuration: nine accelerometers (black disks) were placed on fingers 2, 3, and 4, with one accelerometer on each of the distal, medial, and proximal phalangeal sections, two on the distal and proximal phalangeal section of the thumb, and three on the dorsal surface. (B) Photograph of this configuration showing miniature PCBs and flexible wires. (C) One finger configuration, with nine accelerometers on the index finger and the remainder on the dorsal surface. (D) Two-finger configuration, with six accelerometers on each of the first and second finger and three on proximal areas of the dorsal surface of the hand.
Fig. S3.
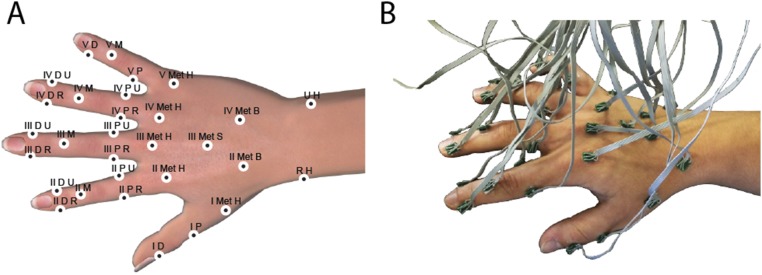
Sensor placement on the fingers and dorsal surface of the hand under 30-accelerometers configuration. (A) Whole hand configuration of the sensor array (B): 15 accelerometers (black disks) were placed on fingers 2, 3, and 4, with every two accelerometers on both lateral of the distal and proximal phalangeal sections and one accelerometer on top of the intermediate phalangeal sections, two on the distal and proximal phalangeal section of the thumb, three on distal, intermediate, and proximal phalangeal section of finger 5, and 10 on the dorsal surface.
Frequency Dependence of Spatial Patterns of Vibration Intensity: Single- and Multifinger Gestures.
To further characterize spatiotemporal variations in touch-induced vibrations, we constructed frequency-dependent portraits of RMS vibration intensity in the hand, as described in the main text. Fig. S4 illustrates the resulting data for six nonoverlapping frequency bands for the full set of 13 gestures that were included in the experimental set for configuration 30W; these were computed as described in Materials and Methods. The results exhibit the main qualitative features described there, including the sharp distinction in the frequency dependence of patterns produced through direct and indirect contact and between the lowest frequency band from 0.1 to 10 Hz, which includes acceleration due to motor behavior and higher frequency information. During single-digit contact trials, for all digits except for I (the thumb), the spatial extent of touch-elicited vibrations was largest for the highest frequency bands. In the latter, the intensity remained well above measurement thresholds over most of the spatial area of the (noncontacting) digits that neighbored the contacting digit.
Fig. S4.
Examples of spatial patterns of vibration intensity in six nonoverlapping frequency bands for 13 classes of gestures. Color bars: RMS amplitude range. Vibration intensity decreased with increasing frequency in all conditions except indirect tap, which exhibited a secondary maximum in the band from 200 to 400 Hz. The lengths of the color bars represent the RMS acceleration range (m/s2) and the value at the top of the bars indicate the maximum value or the respective subplot. Each subplot was normalized over itself. The scales of color bars of all frequency band segments of the same gesture were normalized to facilitate comparison of relative vibration intensity between them.
Time-Dependent Patterns of Vibration Intensity.
To further illustrate time variation in cutaneous vibrations, we used the method described in the main text to render video from measurements of 12 single- and multifinger interactions (Movie S1). Each video was rendered from measurements captured in a single trial. Each frame of the movies corresponded to 1 ms of measurement time, and the movies themselves were presented at 30 frames/s, yielding a speed reduction of 3%. The results evidence the rapid spread of vibration energy from the distal region of the fingers, where contact was initiated, to wider areas of the hand. This spread was especially pronounced in multifinger interactions, for which vibration intensity remained higher than measurement thresholds over much of the dorsal surface of the hand.
Contact and Non–Contact-Elicited Vibrations.
During normal hand function, vibrations produced via muscle and tendon activity are present, in addition to those elicited through skin–object contact. However, tendon- and muscle-produced vibrations are typically far smaller than those produced through touch contact. To illustrate this, we processed our dataset (configuration 30W, all gestures) to remove time segments during and immediately after the touch contact phase of the manual interaction. Because touch-elicited vibrations decayed rapidly, the deleted segments averaged less than 100 ms in duration. We used the remaining signals to construct vibration intensity maps in the same manner as in our main experiments (Materials and Methods). The resulting accelerations in the noncontact condition proved to be nearly three orders of magnitude smaller than in the contact condition (Fig. S5). Although it could be argued that some of the movement-produced vibrations were excluded as a result of this processing, the results suggest that skin–object contact was the dominant source of the mechanical vibrations studied here.
Discussion
Cutaneous patterns of vibration vary in structured ways with the mode of interaction with a touched object, and these results demonstrate that it is possible to decode the interaction types directly from the vibration patterns they elicit. The classification analysis indicated that vibration patterns produced by tapping contact are highly distinctive from those produced by other gestures. In contrast, sliding contact, indirect tapping, and gripping gestures yielded similar multidigit vibration distributions. Unsurprisingly, higher finger forces generally yielded higher vibration intensity, but also proportionally larger distances of propagation. Intensity and distance also increased with the number of digits engaged.
We also observed rapid changes in the patterns of intensity over time, as cutaneous vibrations propagated unevenly on the dorsal side of the hand. Vibration energy peaked dramatically in time and space on the contact of a finger with an object and then spread quickly. Within a few milliseconds, its intensity reached a maximum, and then faded out within 20–30 ms. Owing to the impulsive nature of the stimulation, the signals that were observed were highly asymmetric in time. Curiously, digit I, the thumb, produced lower intensities than the other digits.
Different manual gestures were observed to elicit distinct patterns of energy in the frequency domain, with indirect tapping yielding vibration energy that was concentrated at higher frequencies (between 200 and 400 Hz) than was the case for direct tapping (between 10 and 100 Hz), and these differences were preserved at locations distant from the areas of contact. Soft objects, such as the ball used in the grasping measurements, induced little energy above 10 Hz. Thus, the mechanical characteristics of the contact affected the frequency content of the propagated energy. There was generally less energy in low frequency bands. These nonetheless contained significant information, albeit within limits, because kinematic differences elicited by variations in the size of gripped object were lost.
Prior research has shed light on certain sensory specializations in the upper limb—including the high innervation density of the finger pads and the restriction of Meissner’s corpuscles to glabrous skin—and their relevance to fine manual control. However, less is known about why some sensory cells, including PC units, are distributed more widely in the hand. The patterns of touch-elicited vibration, and the extent to which they can encode information about their source, may offer some explanation. The signals observed in this study have greatest energy and spatial resolution in the fingers, although energies in the rest of the hand remained easily detectable by our apparatus. The large spatial scale of the variations in these patterns (on the order of 1 cm), and their fast temporal evolution (order 5 ms), could suggest that a sparse distribution of vibration-sensitive mechanoreceptors, similar to the network of PC units in the hand, would be appropriate to capturing them. The proximity of extensor tendons in the dorsal surface of the hand suggests that muscle spindle afferents could play a role in processing vibrations during active touch (28–30), but more research is needed.
Further advances in our understanding of sensorimotor function in the upper limb may lead to new developments in prosthetic and robotic hands and to new technologies for providing realistic tactile feedback in virtual reality.
Materials and Methods
Apparatus.
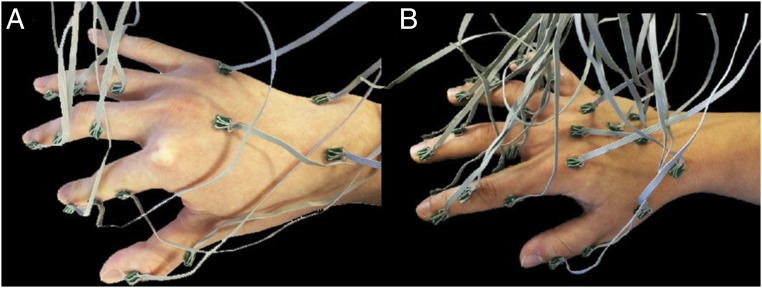
The apparatus was a customized array of 15 or 30 three-channel miniature accelerometers (model ADXL335; Analog Devices) attached to the skin (Fig. 5). These devices had low, but nonzero, mass (40.0 mg), wide frequency bandwidth (0–1,600 Hz in X and Y; 0–550 Hz in Z), high dynamic range (−35.3 to 35.3 m/s2), and were soldered to miniature two-sided printed circuit boards. The analog signals were digitized with 12-bit resolution using custom electronics and were sampled at a frequency of 2.0 kHz by a data acquisition board (model PCIE-6321; National Instruments). The accelerometers were attached to the skin using a prosthetic adhesive (Pros-Aide; FXWarehouse) that ensured a consistent flexible bond over a small contact patch. The sensors were placed to provide coverage of all five fingers and dorsal surface of the hand, in correspondence with the distal, intermediate, and proximal phalanges and the metacarpal area. The data were processed and analyzed using Matlab (The MathWorks).
Fig. 5.
Sensor placement. (A) Fifteen accelerometers with miniature PCBs and flexible wires. Accelerometers were distributed in one of three ways: a whole hand configuration (15W), a single finger configuration (15S) with nine accelerometers on the index finger and the rest on the dorsal surface, and in a two finger configuration (15D) with six accelerometers on each of digits I and II and three on proximal areas of the dorsal surface of the hand. (B) A 30 accelerometer whole-hand configuration (30W). Anatomical positions are reported in Figs. S2 and S3.
Procedure.
The experiments were approved by the institutional research ethics review board of Drexel University. Informed consent was obtained in writing before the experiments. For experiment 1, two volunteers (male students at Drexel University, 22 and 23 y old, dominant right hand) wore the array of accelerometers as indicated in Fig. 5A. They sat in front of a table on which they rested their right forearms. In single and double finger measurements (15S and 15D), they performed tapping and sliding tasks on the specified surfaces. Subjects were instructed to perform natural finger movements, and no restraint was applied to the inactive fingers, to avoid interfering with the movements. Each block of trials lasted 45 s and comprised 20 tapping trials and 10 trials for the other cases. Subjects were trained to follow a visual cue supplied by a computer to maintain a pace of 4 s per trial (2 s in the tapping condition). They performed the tasks with light ( 0.1 N) and high force ( 2.0 N). Grasping tasks involved precision and power grip of a glass cup and tapping using a plastic stylus. Precision grip is when the distal phalanges and the thumb tip press against each other on an object, whereas the power grip is when the fingers and palm clamp on an object with the thumb producing counter pressure. In experiment 2, four volunteers (one female and three male students at the Drexel University, aged 19–23 y old, all right hand dominant) wore the array of accelerometers as indicated in Fig. 5B. Measurement positions were chosen to ensure that the accelerometers were evenly distributed, and the positions were standardized with respect to hand anatomy. Measurements were acquired as subjects performed specified actions with different parts of the hand and objects. Subjects performed tapping tasks 20 times and the other tasks 10 times.
Data Preparation.
To ensure that frequency content of the measurements included the range of PC sensitivity (34), the data were minimally filtered. We used a zero-phase 10-Hz high-pass filter to eliminate effects of hand kinematics. Each measurement recording lasted 45 s. For tapping tasks, each 2-s trial involved the finger contacting and sliding against the plate and then returning to its original position. For sliding tasks, a trial consisted of a combined forward and backward sliding motion 4 s in duration. For gripping tasks, the fingers flexed and held the object during the first 2 s of the trial and then extended and released the object (also 2 s).
Map Construction.
We divided each trial into 100 equal segments for analysis. A sliding window one segment long was shifted forward in time by a quarter of this duration, yielding 397 windows per trial. The acceleration magnitude was computed for every recording in each condition and all were averaged. This yielded a summary amplitude value, , for each of the 30 sensors in each of the 13 measurement conditions. The summary amplitudes were used to estimate an interpolated amplitude over relevant areas of the hand, using a physiologically based model of vibration propagation in the hand (15). The interpolation was performed in local coordinates on the surface of the hand. At each point, we compute a distance-weighted vibration amplitude given by
| [1] |
where is the estimated vibration amplitude, is the measured value at the ith accelerometer, is a rational function of distance from to the ith accelerometer, and is a threshold function with
| [2] |
We evaluated Eq. 1 with mm, based on ref. 15, and set mm−1. The results were used to construct color maps, with deep blue corresponding to the minimum value and bright red to the maximum value. The maps were then rendered on a prototype hand to visualize the interaction-dependent vibration pattern. We averaged over all trials and participants to produce maps for each interaction mode.
Frequency Analysis.
We selected six frequency bands from 0.1 to 1,000 Hz with an exponentially increasing range (Fig. S5). The residual DC component was removed via mean subtraction. A fast Fourier transform (FFT) was performed on each component axis of the accelerometer signal. The frequency-domain signals were separated into distinct bands and used to compute spatial vibration intensity distributions for each frequency band. To compare the relative amplitude in each band, the same intensity scale was used for all frequency bands associated with a given gesture, but different gestures were normalized independently.
Data Analysis by Classification and MANOVA.
We used amplitude data to train classifiers to discriminate different motion conditions (gestures) by means of a multiclass support vector machine classification algorithm (35). For each data trial, we used the averaged amplitude of all 30 accelerometers as input features and the corresponding gestures as the labels. We combined the data from all participants in random order and reported classification performance as the average of 10-fold cross-validation. A hierarchical classification method was used in which the three gripping gestures were discriminated in a second classification task. A confusion matrix was used to report the patterns of classification (Fig. 3). MANOVA was used to test for statistically significant differences among the gesture classes in the same dataset and to assess the pairwise distinguishability of different classes (Table 2). In a subsequent task, we assessed the between-subjects generalization of classification performance, by training SVM classifiers identical to those described above, with data from all participants except for one, whose data were then used to test the SVM. The results were averaged over all (excluded) participants and were computed via 10-fold cross-validation. Finally, motivated by the observation that vibration patterns in different frequency bands were highly distinctive, we repeated the classification task using band-pass filtered data from all subjects. Data were filtered by finite impulse response (FIR) filters with the following frequency ranges: 0.1–10, 10–100, 100–200, 200–400, 400–700, and 700–1,000 Hz. We reported correct classification rates for each band using 10-fold cross-validation.
Supplementary Material
Acknowledgments
This work was supported by the National Science Foundation under Awards CNS-1446752 and 1527709 (to Y.V.), and by the European Commission 7th Framework Programme for Research and Technological Development project Wearable Haptics for Humans and Robots (V.H.).
Footnotes
The authors declare no conflict of interest.
This article is a PNAS Direct Submission.
This article contains supporting information online at www.pnas.org/lookup/suppl/doi:10.1073/pnas.1520866113/-/DCSupplemental.
References
- 1.Saal HP, Bensmaia SJ. Touch is a team effort: Interplay of submodalities in cutaneous sensibility. Trends Neurosci. 2014;37(12):689–697. doi: 10.1016/j.tins.2014.08.012. [DOI] [PubMed] [Google Scholar]
- 2.Jörntell H, et al. Segregation of tactile input features in neurons of the cuneate nucleus. Neuron. 2014;83(6):1444–1452. doi: 10.1016/j.neuron.2014.07.038. [DOI] [PMC free article] [PubMed] [Google Scholar]
- 3.Johansson RS, Flanagan JR. Coding and use of tactile signals from the fingertips in object manipulation tasks. Nat Rev Neurosci. 2009;10(5):345–359. doi: 10.1038/nrn2621. [DOI] [PubMed] [Google Scholar]
- 4.Delhaye B, Lefèvre P, Thonnard JL. Dynamics of fingertip contact during the onset of tangential slip. J R Soc Interface. 2014;11(100):20140698. doi: 10.1098/rsif.2014.0698. [DOI] [PMC free article] [PubMed] [Google Scholar]
- 5.Bicchi A, Scilingo EP, De Rossi D. Haptic discrimination of softness in teleoperation: The role of the contact area spread rate. IEEE Trans Robotics Automation. 2000;16(5):496–504. [Google Scholar]
- 6.Visell Y, Giordano BL, Millet G, Cooperstock JR. Vibration influences haptic perception of surface compliance during walking. PLoS One. 2011;6(3):e17697. doi: 10.1371/journal.pone.0017697. [DOI] [PMC free article] [PubMed] [Google Scholar]
- 7.Robles-De-La-Torre G, Hayward V. Force can overcome object geometry in the perception of shape through active touch. Nature. 2001;412(6845):445–448. doi: 10.1038/35086588. [DOI] [PubMed] [Google Scholar]
- 8.Wijntjes MW, Sato A, Hayward V, Kappers AM. Local surface orientation dominates haptic curvature discrimination. IEEE Trans Haptics. 2009;2(2):94–102. doi: 10.1109/TOH.2009.1. [DOI] [PubMed] [Google Scholar]
- 9.Delhaye B, Hayward V, Lefèvre P, Thonnard JL. Texture-induced vibrations in the forearm during tactile exploration. Front Behav Neurosci. 2012;6:37. doi: 10.3389/fnbeh.2012.00037. [DOI] [PMC free article] [PubMed] [Google Scholar]
- 10.Tanaka Y, Horita Y, Sano A. 2012. Finger-mounted skin vibration sensor for active touch. Haptics: Perception, Devices, Mobility, Communication, Lecture Notes in Computer Science, eds Isokoski P, Springare J (Springer, Berlin), Vol 7283, pp 169–174.
- 11.Libouton X, Barbier O, Berger Y, Plaghki L, Thonnard JL. Tactile roughness discrimination of the finger pad relies primarily on vibration sensitive afferents not necessarily located in the hand. Behav Brain Res. 2012;229(1):273–279. doi: 10.1016/j.bbr.2012.01.018. [DOI] [PubMed] [Google Scholar]
- 12.Manfredi LR, et al. Natural scenes in tactile texture. J Neurophysiol. 2014;111(9):1792–1802. doi: 10.1152/jn.00680.2013. [DOI] [PubMed] [Google Scholar]
- 13.Wiertlewski M, Hayward V. Mechanical behavior of the fingertip in the range of frequencies and displacements relevant to touch. J Biomech. 2012;45(11):1869–1874. doi: 10.1016/j.jbiomech.2012.05.045. [DOI] [PubMed] [Google Scholar]
- 14.Johansson RS, Landström U, Lundström R. Responses of mechanoreceptive afferent units in the glabrous skin of the human hand to sinusoidal skin displacements. Brain Res. 1982;244(1):17–25. doi: 10.1016/0006-8993(82)90899-x. [DOI] [PubMed] [Google Scholar]
- 15.Manfredi LR, et al. The effect of surface wave propagation on neural responses to vibration in primate glabrous skin. PLoS One. 2012;7(2):e31203. doi: 10.1371/journal.pone.0031203. [DOI] [PMC free article] [PubMed] [Google Scholar]
- 16.Sofia KO, Jones LA. Mechanical and psychophysical studies of surface wave propagation during vibrotactile stimulation. IEEE Trans Haptics. 2013;6(3):320–329. doi: 10.1109/TOH.2013.1. [DOI] [PubMed] [Google Scholar]
- 17.Cauna N, Mannan G. The structure of human digital pacinian corpuscles (corpus cula lamellosa) and its functional significance. J Anat. 1958;92(1):1–20. [PMC free article] [PubMed] [Google Scholar]
- 18.Stark B, Carlstedt T, Hallin RG, Risling M. Distribution of human Pacinian corpuscule in the hand. J Hand Surg Am. 1998;23B(3):370–372. doi: 10.1016/s0266-7681(98)80060-0. [DOI] [PubMed] [Google Scholar]
- 19.Kumamoto K, Senuma H, Ebara S, Matsuura T. Distribution of pacinian corpuscles in the hand of the monkey, Macaca fuscata. J Anat. 1993;183(Pt 1):149–154. [PMC free article] [PubMed] [Google Scholar]
- 20.Edin BB, Abbs JH. Finger movement responses of cutaneous mechanoreceptors in the dorsal skin of the human hand. J Neurophysiol. 1991;65(3):657–670. doi: 10.1152/jn.1991.65.3.657. [DOI] [PubMed] [Google Scholar]
- 21.Järvilehto T, Hämäläinen H, Soininen K. Peripheral neural basis of tactile sensations in man: II. Characteristics of human mechanoreceptors in the hairy skin and correlations of their activity with tactile sensations. Brain Res. 1981;219(1):13–27. doi: 10.1016/0006-8993(81)90264-x. [DOI] [PubMed] [Google Scholar]
- 22.Johansson RS, Vallbo AB. Tactile sensibility in the human hand: Relative and absolute densities of four types of mechanoreceptive units in glabrous skin. J Physiol. 1979;286:283–300. doi: 10.1113/jphysiol.1979.sp012619. [DOI] [PMC free article] [PubMed] [Google Scholar]
- 23.Merzenich MM, Harrington TH. The sense of flutter-vibration evoked by stimulation of the hairy skin of primates: Comparison of human sensory capacity with the responses of mechanoreceptive afferents innervating the hairy skin of monkeys. Exp Brain Res. 1969;9(3):236–260. doi: 10.1007/BF00234457. [DOI] [PubMed] [Google Scholar]
- 24.Mahns DA, Perkins NM, Sahai V, Robinson L, Rowe MJ. Vibrotactile frequency discrimination in human hairy skin. J Neurophysiol. 2006;95(3):1442–1450. doi: 10.1152/jn.00483.2005. [DOI] [PubMed] [Google Scholar]
- 25.Gottschaldt KM, Vahle-Hinz C. Merkel cell receptors: Structure and transducer function. Science. 1981;214(4517):183–186. doi: 10.1126/science.7280690. [DOI] [PubMed] [Google Scholar]
- 26.Maksimovic S, et al. Epidermal Merkel cells are mechanosensory cells that tune mammalian touch receptors. Nature. 2014;509(7502):617–621. doi: 10.1038/nature13250. [DOI] [PMC free article] [PubMed] [Google Scholar]
- 27.Goodwin AW, Youl BD, Zimmerman NP. Single quickly adapting mechanoreceptive afferents innervating monkey glabrous skin: Response to two vibrating probes. J Neurophysiol. 1981;45(2):227–242. doi: 10.1152/jn.1981.45.2.227. [DOI] [PubMed] [Google Scholar]
- 28.Ribot-Ciscar E, Rossi-Durand C, Roll JP. Muscle spindle activity following muscle tendon vibration in man. Neurosci Lett. 1998;258(3):147–150. doi: 10.1016/s0304-3940(98)00732-0. [DOI] [PubMed] [Google Scholar]
- 29.Burke D, Hagbarth KE, Löfstedt L, Wallin BG. The responses of human muscle spindle endings to vibration of non-contracting muscles. J Physiol. 1976;261(3):673–693. doi: 10.1113/jphysiol.1976.sp011580. [DOI] [PMC free article] [PubMed] [Google Scholar]
- 30.Roll JP, Vedel JP. Kinaesthetic role of muscle afferents in man, studied by tendon vibration and microneurography. Exp Brain Res. 1982;47(2):177–190. doi: 10.1007/BF00239377. [DOI] [PubMed] [Google Scholar]
- 31.Rogers CH. Choice of stimulator frequency for tactile arrays. IEEE Trans Man-Machine Syst. 1970;11(1):5–11. [Google Scholar]
- 32.Cholewiak RW, McGrath C. 2006. Vibrotactile targeting in multimodal systems: Accuracy and interaction. Proceedings of the 14th Symposium on Haptic Interfaces for Virtual Environments and Teleoperator Systems (IEEE Computer Society, Arlington, VA), pp 413–420.
- 33.Brisben AJ, Hsiao SS, Johnson KO. Detection of vibration transmitted through an object grasped in the hand. J Neurophysiol. 1999;81(4):1548–1558. doi: 10.1152/jn.1999.81.4.1548. [DOI] [PubMed] [Google Scholar]
- 34.Bell J, Bolanowski S, Holmes MH. The structure and function of Pacinian corpuscles: A review. Prog Neurobiol. 1994;42(1):79–128. doi: 10.1016/0301-0082(94)90022-1. [DOI] [PubMed] [Google Scholar]
- 35.Cortes C, Vapnik V. Support-vector networks. Mach Learn. 1995;20(3):273–297. [Google Scholar]
Associated Data
This section collects any data citations, data availability statements, or supplementary materials included in this article.


