Significance
This work shows that hole−electron recombination can be controlled by engineering the length of brookite nanorods, and that a variety of organic substrates can be efficiently oxidized as the counterreaction to hydrogen evolution. Both are important steps to developing photocatalysis as a sustainable technology. Electron−hole recombination is a major fundamental limitation in any photocatalytic process. By controlling and reducing it with rod length, we can increase the efficiency of photocatalyzed processes. Also, by utilizing demanding substrates in aqueous media, ethanol, glucose, and glycerol, we make a step toward the photoreforming of more plentiful feedstocks such as, or derived from, biomass.
Keywords: titania, brookite, photocatalysis, photoreforming, hydrogen
Abstract
Photocatalytic pathways could prove crucial to the sustainable production of fuels and chemicals required for a carbon-neutral society. Electron−hole recombination is a critical problem that has, so far, limited the efficiency of the most promising photocatalytic materials. Here, we show the efficacy of anisotropy in improving charge separation and thereby boosting the activity of a titania (TiO2) photocatalytic system. Specifically, we show that H2 production in uniform, one-dimensional brookite titania nanorods is highly enhanced by engineering their length. By using complimentary characterization techniques to separately probe excited electrons and holes, we link the high observed reaction rates to the anisotropic structure, which favors efficient carrier utilization. Quantum yield values for hydrogen production from ethanol, glycerol, and glucose as high as 65%, 35%, and 6%, respectively, demonstrate the promise and generality of this approach for improving the photoactivity of semiconducting nanostructures for a wide range of reacting systems.
Photocatalysis could play an important role in the new clean energy economy (1, 2). By using photoexcited electrons and holes to drive chemical reactions using absorbed sunlight, photocatalytic processes offer potential carbon-free means of both neutralizing waste and producing various fuels and chemicals (3). However, although photocatalysis is already used in niche industrial applications (4), the wider promise of photocatalytic processes at industrial scale has gone unrealized. A main reason for this failure is fast electron−hole recombination following light absorption in most photocatalysts (5). As a result, previous efforts at photocatalyst engineering have focused on charge separation efficiency (6). Heterojunctions can enhance charge separation by electron or hole transfer from one semiconductor to another (or to a metal) (7), provided that the correct energy band alignment is present. Other strategies can be used, for example by facet engineering (8), such that electrons and holes are driven toward different surfaces. The use of organic surfactants provides the opportunity to control the crystal phase and the exposed crystal facets (8, 9). Despite some advances, a clear path toward improvement in charge separation is still missing, resulting in quantum efficiencies that are still low, even in the best existing photocatalytic systems.
One of the most promising applications of heterogeneous photocatalysis is hydrogen production. Hydrogen is considered to be one of the potential energy vectors of the future, and its utilization in fuel cells represents a clean way to convert chemical into electrical energy (10). Currently, 95% of hydrogen is obtained from fossil fuels (mainly natural gas) by steam reforming in an unsustainable process (11). Given that hydrogen is also a commodity chemical used at the million-ton scale for several industrial processes (e.g., ammonia synthesis), methods that could sustainably produce hydrogen would represent a great economic and environmental benefit. Potential options are available, such as aqueous reforming of biomass (12), but they still require intense energy input. Photocatalytic reforming, in which light converts low-quality or low-purity biomass-derived compounds or waste streams into hydrogen, represents an alternative that can be nearly carbon-neutral, by using renewable resources and sunlight as the only feedstock (3).
Among semiconductors, titanium dioxide (TiO2, titania) is the most studied and is therefore used as a benchmark photocatalytic material (13). Its stability, activity, and Earth abundance makes it the premier photocatalytic system. Anatase and rutile TiO2 polymorphs have been thoroughly investigated because they are thermodynamically favored in the nanoscale form and in the bulk, respectively (14). Brookite, in contrast, has rarely been studied, despite theoretical and experimental data supporting its higher activity in some photocatalyzed transformations (15–20). Previously, structural modifications (21), doping (22), or the formation of heterojunctions with plasmonic building blocks (23) have shown promise in promoting its photocatalytic activity. However, these efforts leave much to be desired in boosting the charge-separating ability of TiO2 to industrially viable levels.
Here, we demonstrate an approach to reduce recombination and improve the photoactivity of titania by tuning the structure of nanorods in the brookite phase. This method has a profound influence on the photocatalytic reforming activity of the system, and is used to demonstrate efficient hydrogen production from several low-purity, potentially biomass-derived compounds. By achieving exquisite control over the nanostructure and the electronic properties of the photocatalyst, we provide a paradigm for the preparation of highly active TiO2 photocatalysts that could be implemented across the wide range of systems and substrates for which TiO2 is already used.
Results and Discussion
Preparation and Characterization of Brookite Nanorods of Different Lengths.
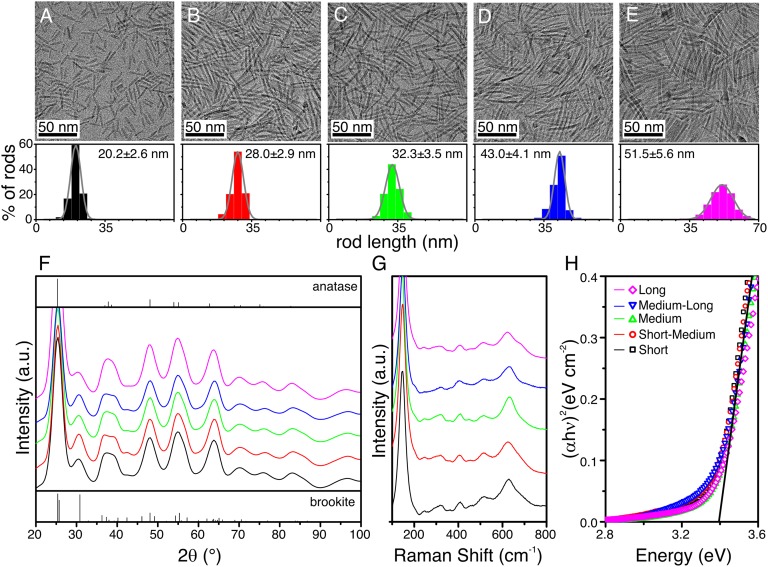
The synthesis of pure-phase brookite titania nanorods is based on a seed-mediated approach, which initially produces anatase seeds that are then grown into brookite rods by further injection of precursor (24). A large excess of oleylamine is required for the hydrolysis of the titanium chloride−oleic acid precursor, in accordance with other synthesis methods that show brookite being favored with a slow in situ production of OH− ions (16). Anisotropic growth of the seeds is accomplished by decomposition and deposition of additional precursors during synthesis. Because the growth is achieved through slow injection, the length of the rods is easily tunable by controlling the volume of additional precursors. It has been observed that the nanorods switch from the anatase to the brookite phase when they grow to about 15 nm in length (24). In this work, five samples of brookite nanorods of different average lengths greater than 20 nm were prepared. Transmission electron microscopy (TEM) images of the samples are shown in Fig. 1 A−E. The samples show uniform (10–12% dispersion) and distinct lengths that vary from 25 nm to 45 nm (see histograms associated with Fig. 1 A−E). The samples are labeled as short, short-medium, medium, medium-long, and long with increasing length. Under the present experimental conditions, a growth rate of about 5 nm⋅mL−1 of added precursor was observed at the initial growth stages. Given that the diameter of the rods (∼4–6 nm) does not vary drastically between samples, about 90% of the additional titanium precursor injected is decomposed on the surface of the rods and contributes to increasing their length. At later stages, however, the growth rate decreases due to the poor solubility of the longer rods in the reaction mixture, which leads to self-nucleation of nonuniform anatase particles. These by-products can be removed by careful size-selective purification, which also improves the length distribution of the samples. This procedure exploits the size-dependent solubility of the particles and is performed by adding an antisolvent (isopropanol) to the solution. The longer rods, being less soluble than smaller particles, precipitate first and are separated from the supernatant containing the particles by centrifugation and redissolved for further use.
Fig. 1.
Brookite nanorods of different lengths used in this work. (A−E) TEM images of short (A), short-medium (B), medium (C), medium-long (D), and long (E) brookite rods synthesized by a seed-mediated approach, with associated histograms of length distributions (bottom). (F) Synchrotron XRD patterns of the samples and reference patterns for pure anatase (top) and brookite (bottom). (G) Raman spectra using 532-nm laser excitation source. (H) Kubelka−Munk plot derived from diffuse reflectance UV-Vis spectroscopy experiments.
The organic ligands on the rods can be removed by treatment with NOBF4, which replaces the alkyl ligands with small BF4− ions, and provides samples that can be isolated, dried, and used as powders (25). Synchrotron X-ray diffraction (XRD) data of such powders (Fig. 1F) indicates the formation of pure-phase brookite rods, with relative intensities differing from the theoretical values and a general broadening due to microstrain and size dispersion. There are no clear features that can be associated with the elongation of the crystal structure, likely because of strain. Raman spectra (Fig. 1G) further corroborate the phase purity, with the plethora of peaks between 200 cm−1 and 600 cm−1 that are characteristic of the brookite structure (16, 24, 26). As observed in XRD patterns, broad signals preclude an accurate comparison between the samples, and no differences in peak position or breadth are distinguishable. A bandgap of 3.4 eV for all of the samples was measured using diffuse reflectance UV-visible (UV-Vis) spectroscopy (Fig. 1H). This value is larger than that of rutile and anatase polymorphs, and in accordance with previous works on brookite materials (16). Such a large bandgap and the associated cathodic shift of the conduction band are advantageous for photocatalytic hydrogen evolution.
Photocatalytic Activity for Alcohol Photoreforming.
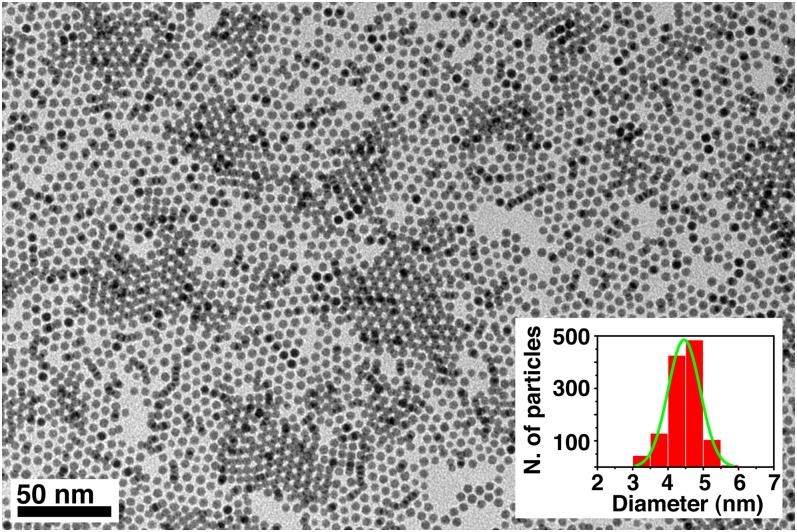
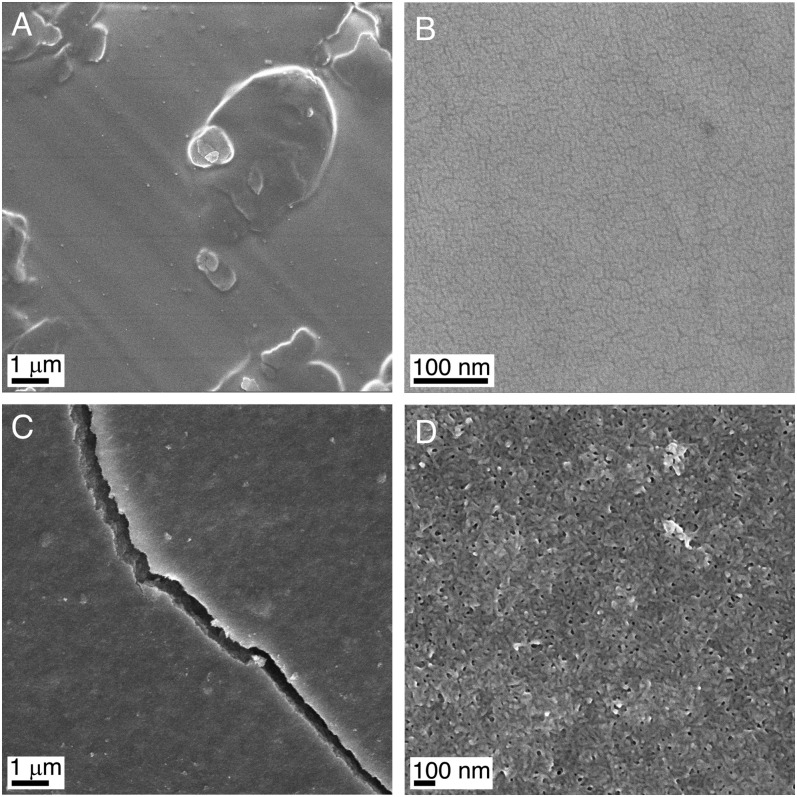
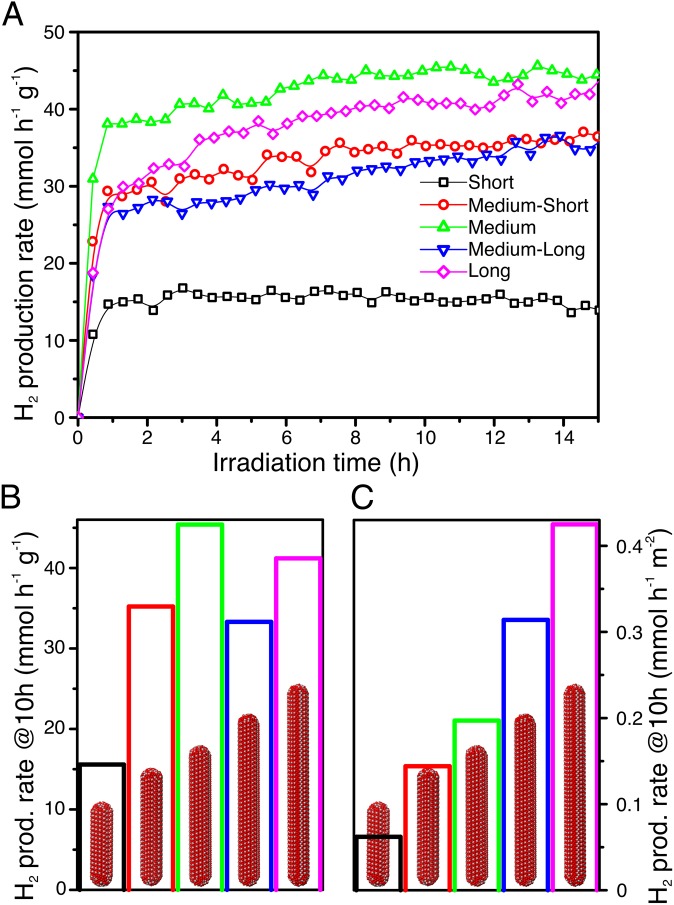
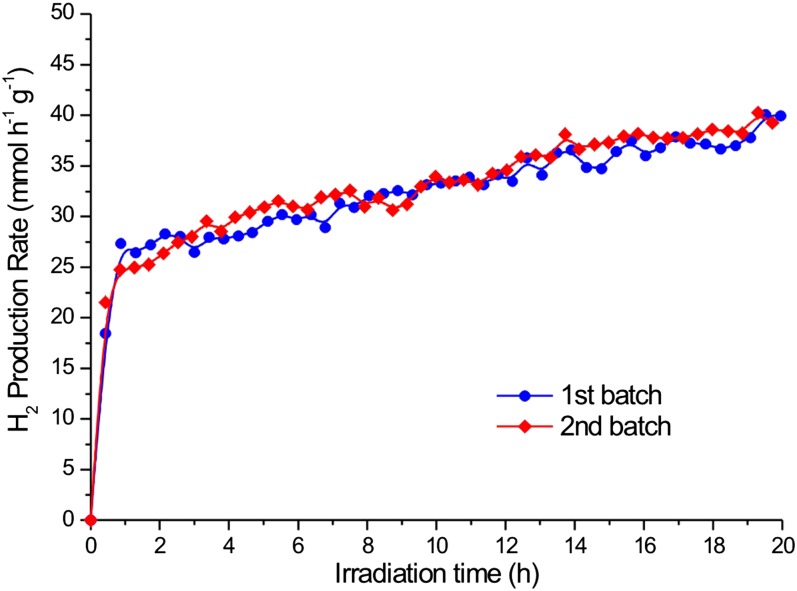
The nanorods were tested for photocatalytic hydrogen production from aqueous ethanol solutions under solar simulated irradiation, using an air mass 1.5 (AM1.5) filter with about 4% of the energy in the UV region (<400 nm). Instead of the often-studied methanol, which is mainly produced from fossil fuels (syngas), ethanol was selected as a model compound because it is obtained from biomass through fermentation of lignocellulosic-derived sugars (27) or from CO2 by genetically engineered microbes (28). It therefore represents a sustainable source for H2 production. In addition, ethanol oxidation requires breaking a C−C bond. This aspect makes it a better facsimile for more complicated feedstocks like biomass compared with methanol. To control the catalyst loading, the nanorods still coated with organic ligands were drop-casted from hexane−octane solutions onto cover glass slides to form thin films. The use of films is advantageous over powders and slurries because of the ease of recoverability and recyclability when considering realistic applications of these materials (29). To reduce the kinetic barrier for H2 production (30), Pt was used as a standard cocatalyst, although nonnoble metals such as Cu can also be used (31). To avoid catalytic activity disparities because of Pt particle size differences using conventional impregnation or photodeposition methods, colloidal Pt nanocrystals with uniform particle size distributions of 4.5 ± 0.4 nm (Fig. S1) were codeposited with the nanorods using the same metal loading for all of the samples (1 wt %). Given that nanorods without Pt are not active for hydrogen production under these conditions, the low loading guarantees that the overall number of active Pt/nanorod pairs remain the same for all of the samples. Therefore, the same metal loading allows a fair comparison between samples with equally exposed metal surface area. The films were highly homogeneous and smooth, as demonstrated by scanning electron microscopy (SEM), with uniform thicknesses on the order of ∼100 nm and clearly showing the presence of mesopores created by random stacking of the rods (see Fig. S2). All films were highly active for ethanol photoreforming, with H2 evolution rates approaching 45 mmol⋅h−1⋅g−1 for the overall best performing sample, the medium nanorods (Fig. 2 A and B), and rates were highly repeatable and reproducible (see Fig. S3). This rate of hydrogen production under simulated solar irradiation is among the highest for titania-based photocatalysts (16, 21, 32). Furthermore, the rate of H2 production of medium nanorods is 3 times that of the short nanorods (Fig. 2B). The delay in reaching steady-state hydrogen production was due to the removal of organic ligands from the surface of the nanorods, as demonstrated by infrared spectroscopy performed on the films before and after photocatalytic activity (see Fig. S4). Further proof was provided by experiments performed by recycling the films several consecutive times (see Fig. S5). During the second and third runs, there is a much lower delay in H2 production related only to hydrogen detection by the system. Furthermore, the films were proven to provide stable hydrogen production for days. Following International Union of Pure and Applied Chemistry (IUPAC) recommendations (33), rates were normalized by specific surface area, which was measured using a recently developed method based on adsorption of Kr at liquid argon temperature (34, 35). The films are mesoporous and show high specific surface areas between 100 m2⋅g−1 and 250 m2⋅g−1, with narrow pore size distribution (see Fig. S6), confirming morphology apparent in SEM. Differences in surface area can be related to differences in the packing density of the rods in the films. After normalization, long rods were found to be the most active, with an intrinsic hydrogen production rate that was roughly 8 times that of short rods. The quantum yields for hydrogen production, i.e., the fraction of photons that are used in the chemical reaction to produce hydrogen, were measured in a separate experiment using monochromated light at 365 nm also following IUPAC recommendations (33). In the case of ethanol, quantum yields as high as 65% were calculated, which are among the highest reported for platinized titania materials (36). This value can be further increased by optimizing ethanol concentration, metal loading, or photoreactor design, which goes beyond the focus of this manuscript.
Fig. S1.
Representative TEM image of uniform Pt nanocrystals used to promote photocatalytic hydrogen production in brookite rod films. (Inset) Histogram of particle size distribution (4.5 ± 0.4 nm).
Fig. S2.
SEM characterization of uniform films of short (A and B, low and high magnification) and long (C and D, low and high magnification) nanorods showing uniform thickness and smooth surfaces formed by random stacking of rods, as well as porous structures formed within the layers.
Fig. 2.
Ethanol photoreforming on 1 wt % Pt−brookite nanorods of different length. (A) Rates of H2 production over time. (B) Rates after 10 h under illumination normalized by weight of photocatalyst. (C) Rates after 10 h under illumination normalized by surface area of the photocatalysts.
Fig. S3.
Representative ethanol photoreforming experiments on two 1 wt % Pt/TiO2 medium-long nanorods samples, confirming good reproducibility of the preparation and photocatalytic results.
Fig. S4.
Infrared spectroscopy of the film composed of Pt nanocrystals and medium brookite nanorods before and after photocatalytic activity, evidencing the disappearance of the C−H stretching bands at 2,800–3,000 cm−1 due to the in situ removal of organic ligands.
Fig. S5.
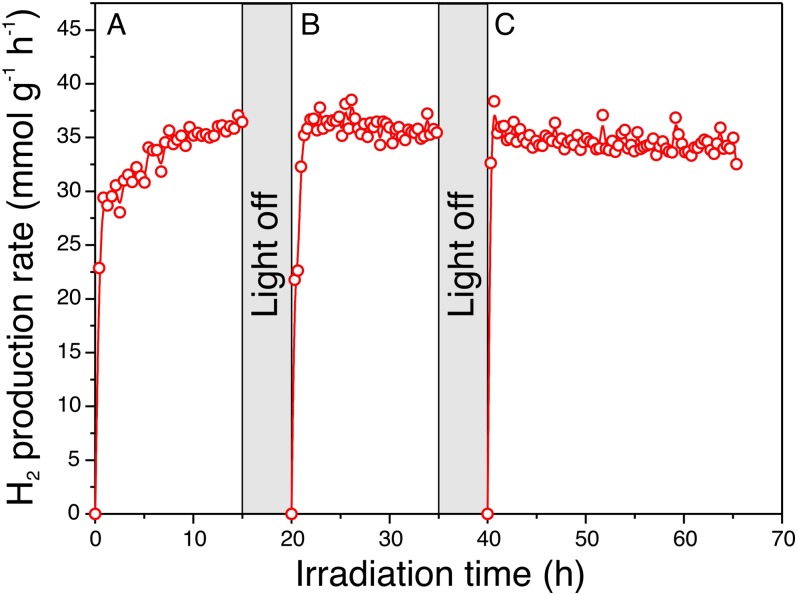
Recycling experiments in which the same film (medium rods) was subjected to three consecutive runs. It is evident that removal of organic ligands causes delay in hydrogen productive during the first run (A), which is not observed in subsequent runs (B). The liquid phase was then removed and replaced by fresh solution to restart the experiment (C)—this to ensure that there is no significant change in concentration and to prove that the catalysis does not occur in suspension but on the films. Furthermore, the photocatalyst is stable for several days, with no noticeable decrease in rate of hydrogen production.
Fig. S6.
Kr adsorption isotherm at liquid Ar temperature (–185.5 °C) on the medium rods sample (Top); filled symbols, adsorption branch; empty symbols, desorption branch. (Inset) The pore size distribution. (Bottom) Table showing summary of surface area according to Brunauer−Emmett−Teller (BET) analysis for all of the samples in this study.
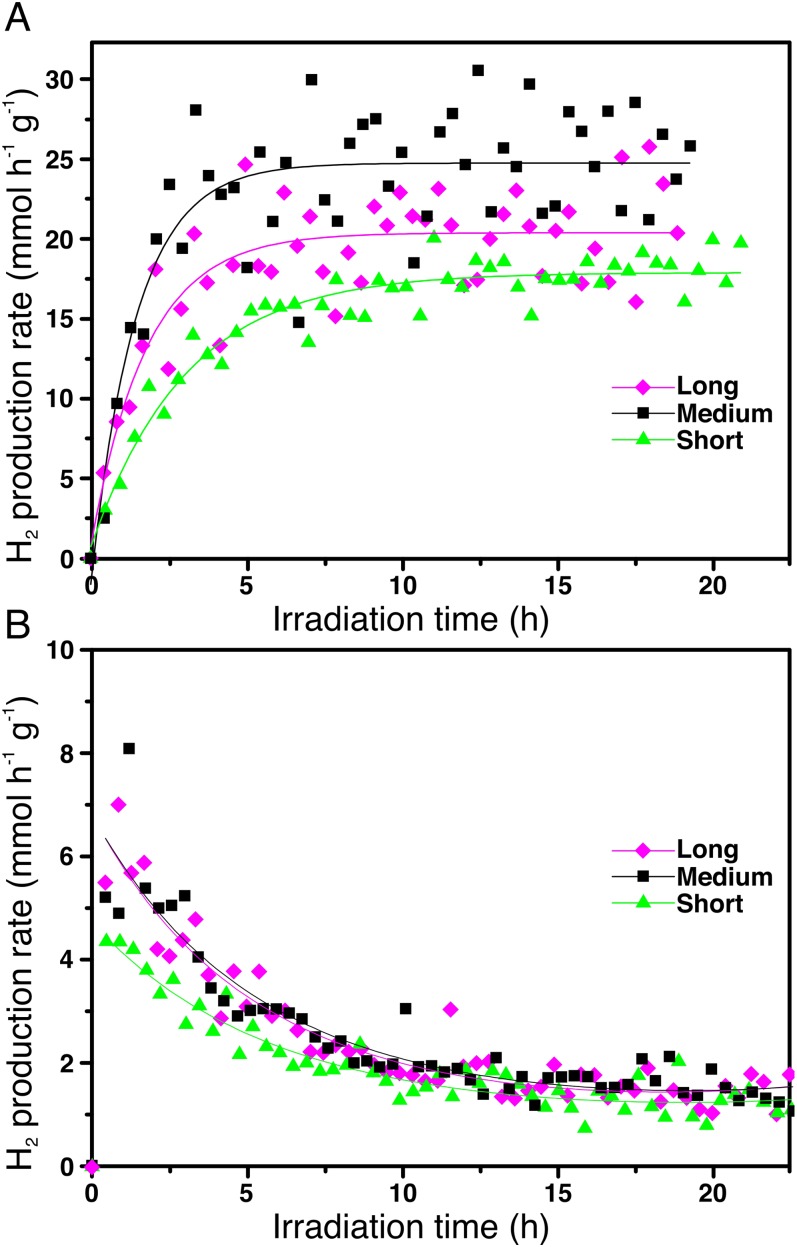
The samples were also tested for photoreforming of more-challenging renewable alcohols, such as glycerol and glucose (see Fig. S7). In accordance with the higher complexity of these two polyalcohols, overall rates were lower than when using ethanol (3). However, these rates were still remarkable, and quantum yields of 35% and 6% for glycerol and glucose, respectively, were measured. Photocatalytic rates for glycerol still showed the long rods as performing best when the data were normalized by surface area, but, for glucose, the difference between the samples was noticeably smaller. It is likely that surface reactions and diffusion rates, rather than hole−electron separation, become limiting. One possibility is that the active sites are intrinsically less active for glucose oxidation. Another possibility is that glucose requires a different active site, perhaps the sterically unencumbered tips, and so the kinetics are limited by the number of active sites. Additionally, a delay in reaching steady-state rates is observed with glycerol. This delay is due to the removal of organic ligands from the surface of the rods, which takes longer than in ethanol because of the lower hole extraction rate for glycerol, or because of equilibria in solution that cause a delay in the detection of H2. With glucose, a strong deactivation was also observed, suggesting poisoning of the catalyst/cocatalyst surface by by-products of the initial glucose oxidation steps. The trend is different compared with the other two compounds because the observed forward rates are decreased by deactivation phenomena. Deactivation becomes more prominent as the reaction proceeds and more by-products are formed. Intermediate products of the photoreforming process are indeed known to potentially inhibit the reaction by blocking active sites (36, 37).
Fig. S7.
Photoreforming of glycerol (A) and glucose (B) over the short, medium, and long rods.
During photoreforming of ethanol, acetaldehyde and 1,1-diethoxyetane are produced by dehydrogenation and accumulated in the liquid phase (only traces amounts are removed from the solution by the inert gas flow). No CO2 formation has been observed, confirming that ethanol is oxidized more readily than acetaldehyde. In the case of glycerol and glucose, CO2 is detected as a by-product in the gas phase as a result of the oxidation/decarboxylation of the organic skeleton. This process is possible because intermediates following the initial dehydrogenation still contain OH groups. These intermediates can favorably compete with the initial substrate and bind to the surface of TiO2 for further oxidation. In the case of glycerol, the analysis of the liquid phase revealed the presence of 1,3-dihydroxy-2-propanone, hydroxyacetaldehyde, and formic acid as major by-products, in agreement with previous reports on photoreforming of glycerol on TiO2-based materials (37).
In-Depth Characterization Studies.
Several techniques were used to shed light on the observed catalytic trends. High-resolution TEM investigations were carried out both before (see Fig. S8) and after catalytic activity (Fig. 3). The size and shape of both Pt nanocrystals and titania nanorods were maintained during photocatalysis, even after reaction for more than 20 h. The nanorods, despite unavoidable agglomeration in the solid state, also maintained their crystallinity, as evidenced by the lattice fringes in Fig. 3A. Analysis of digital diffraction patterns on multiple nanorods demonstrated that most of them were in the brookite phase, and only a small percentage (<5%) could be tentatively assigned to the anatase phase. It must be highlighted that, in a few cases, it was hard to clearly distinguish anatase from brookite, making the definitive assignment difficult. The results for the other samples were in line with those shown for the long rods. There was no preferential exposure of specific surface facets, in accordance with XRD results, ruling out differences in exposed facets as an explanation for the higher H2 production rate of some samples (18).
Fig. S8.
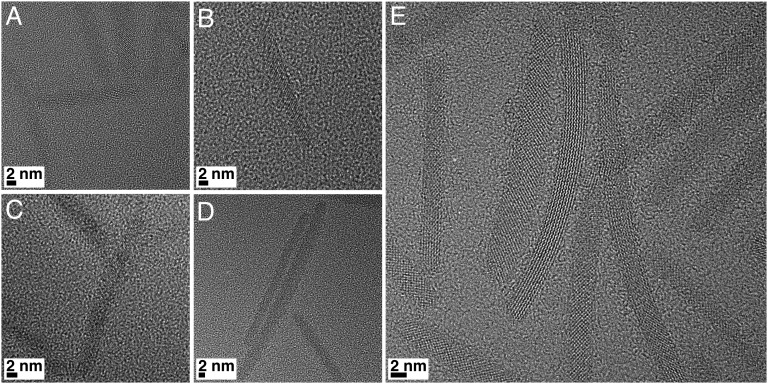
Representative HR TEM images of the brookite nanorod samples before catalytic activity and without Pt; (A) small, (B) small-medium, (C) medium, (D) medium-long, and (E) long nanorods.
Fig. 3.
High-resolution TEM characterization of long nanorods after photocatalytic activity. (A and B) Representative high-resolution (HR) TEM images. Black particles are Pt nanocrystals. (C) Digital diffraction pattern of a selected area, showing distances and angles for specific planes. (D) Simulated diffraction pattern for brookite phase viewed along the [2 1 3] zone axis, showing a very good match with the experimental pattern in C.
We set out to investigate the behavior of electrons and holes under irradiation on the different samples using two complimentary techniques, electron paramagnetic resonance (EPR) spectroscopy and transient absorption (TA), probing electron and hole activity, respectively.
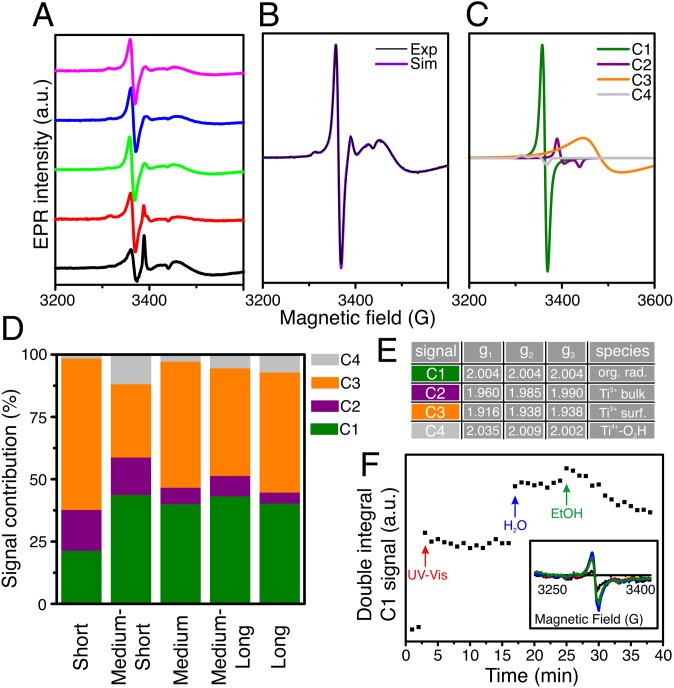
Fig. 4A shows EPR spectroscopy data at −173 °C on the ligand-exchanged samples under irradiation with UV-Vis light. Each spectrum could be deconvoluted by spectrum simulation into a combination of four signals (C1−C4, Fig. 4D and table in Fig. 4E, as in the example of the medium rods in Fig. 4 B and C). The isotropic signal C1 likely arises from organic residues still on the particle surface after ligand exchange, which can produce stable radicals upon photooxidation by the positive holes in UV-irradiated TiO2 (38). C2 and C3 are most likely Ti3+ species of the brookite phase (39) formed by trapped UV-excited electrons at bulk (C2) or surface (C3) Ti4+ sites. C4 is assigned to HO2• radicals, which can arise from the reaction of holes with the surface hydroxyl groups on TiO2 (40, 41). The contribution of each signal to the whole spectrum as derived by spectrum simulation is reported in Fig. 4D. For the least active sample (short rods), the relative intensity of signal C1 is lowest, whereas the total contribution of Ti3+ (C2 and C3) is highest. If photoexcited electrons were quickly transferred to the Pt particle, reducing electron−hole recombination, there would be no EPR signal. Therefore, a higher Ti3+ signal intensity in the short nanorod sample suggests a slower or inhibited transfer to Pt, agreeing with the observed lower activity (42). At the reaction temperature (room temperature), exciton recombination is likely to be even faster. Indeed, when ethanol is added at room temperature in the EPR tube for in situ experiments (Fig. 4F), the C1 signal decreases. This decrease is related to the preferential reaction of holes with ethanol, leaving the electron localized on a Ti3+ ion, and thus confirming that the C1 signal is a good indicator of the reactivity of the samples. In summary, the different intensities of the Ti3+ and C1 EPR signals as well as the behavior of the latter in the presence of ethanol indicate that the transfer of photoexcited electrons to Pt as well as the reaction of holes with ethanol is fastest for the most active sample, the long rods.
Fig. 4.
EPR spectroscopy experiments. (A) EPR signals recorded at −173 °C. (B) Combined experimental and simulated EPR patterns, and (C) deconvolution of the EPR trace into its constituent signals according to literature reports. (D) Contribution of the four EPR-active signals to the total EPR trace. (E) EPR signal assignments. (F) In situ EPR experiment on the medium rods by switching from dark to UV-Vis illumination, then adding water and, finally, ethanol as indicated by the arrows.
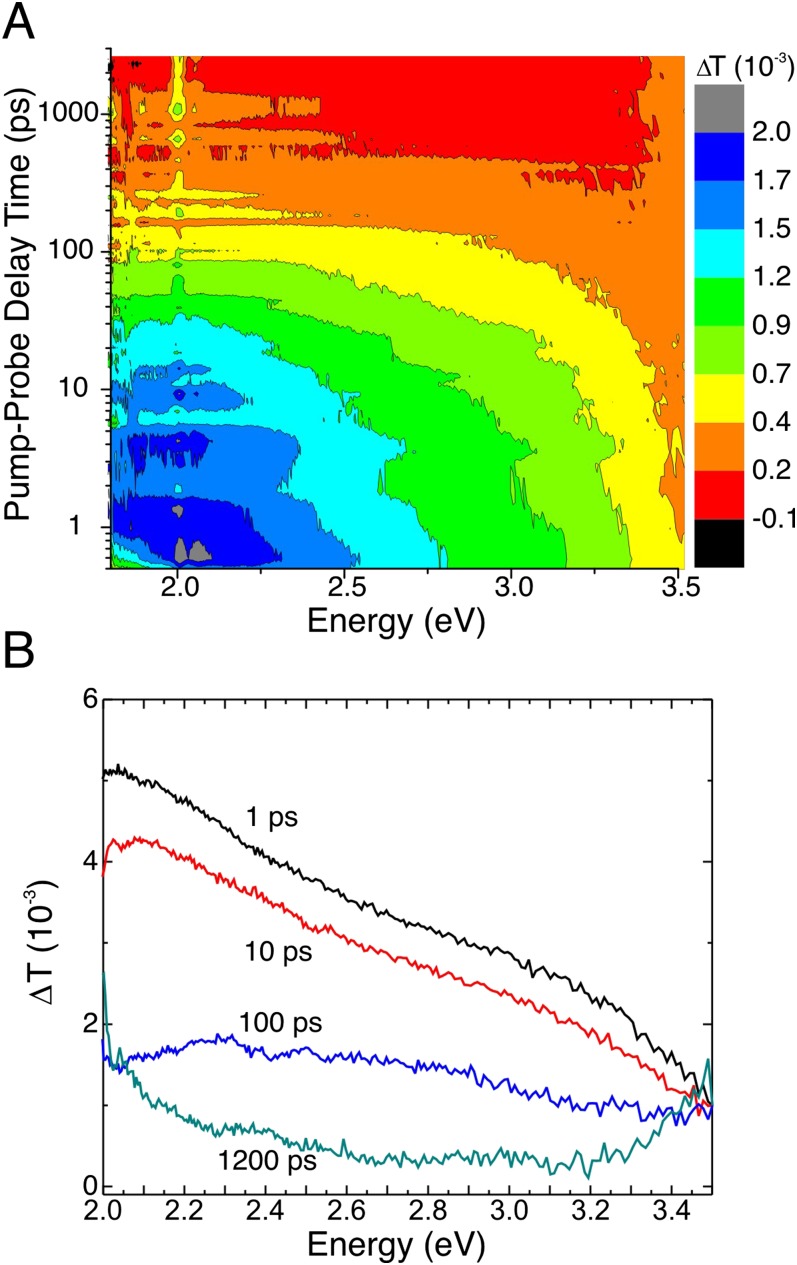
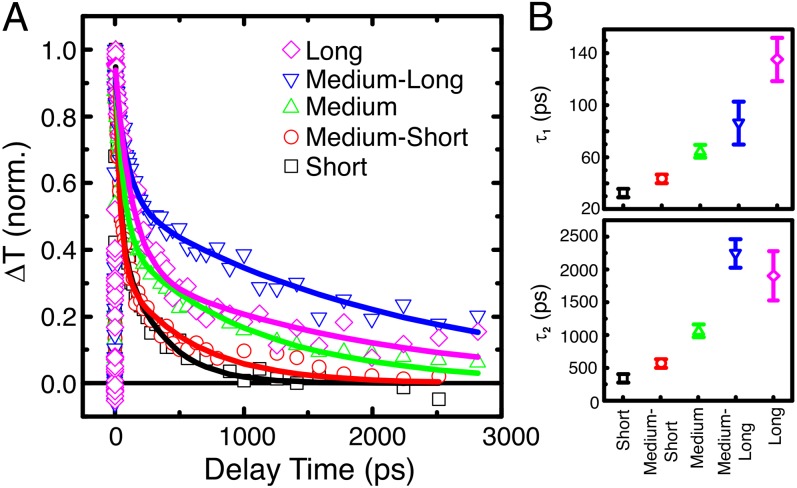
Ultrafast TA spectroscopy of the nanorod films was performed to quantify lifetimes of photoexcited carriers and complement EPR studies (43). Ultrafast measurements of Pt-decorated nanorod films were performed in situ with the same ethanol mixture that was used in the hydrogen evolution experiment. The films were photoexcited with a 50-fs UV (4.0 eV) pump pulse, and the relaxation of carriers was monitored with an ultrafast visible probe pulse (see Supporting Information for further details). In accordance with previous investigations on titania particles, a broad photoinduced absorption feature in the visible range is obtained when pumping above the brookite band gap (see Fig. S9) (44). This feature has previously been assigned to trapped holes that lie energetically within the band gap and physically on or near the surface of the TiO2 nanoparticles (44, 45). Trapping of photoexcited holes occurs on the order of a few hundred femtoseconds, which results in an ultrafast rise in the TA signal following photoexcitation (46). Trapped holes then relax to deeper trap states over the next few hundred picoseconds, resulting in a blue shift of the spectral feature (see Fig. S9) (47). The feature decays as trapped holes recombine with electrons or react to oxidize an adsorbate. The normalized kinetics of the visible absorption feature for each film are shown in Fig. 5A. To quantify the differences in dynamics, the kinetics were fit with a biexponential decay model according to:
| [1] |
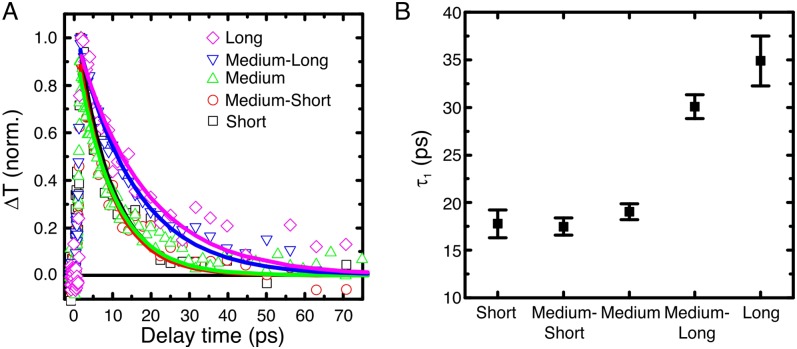
Fits to the data are shown in Fig. 5A, and time constants are shown in Fig. 5B. The fast and slow time constants τ1 and τ2 are on the order of 100 ps and 1 ns, respectively. Investigation of nanorods without Pt in ethanol exhibited much faster single-exponential decays with time constants of 10–40 ps, increasing with nanorod length (see Fig. S10). These dynamics indicate that the capture of electrons by Pt increases the lifetime of the charge-separated state and that lifetimes increase with nanorod length, in accordance with the fact that samples with no Pt do not show detectable H2 production. The increase in the lifetime of trapped holes with nanorod length is attributed to the larger volume available to the electron to remain separated from the hole. These data are consistent with the EPR results that indicate that electrons in longer nanorods transfer to Pt faster than electrons in shorter nanorods. This fact decreases the probability of recombination and thus in turn increases lifetimes of trapped holes in longer rods. Even if electrons can transfer between rods, the larger volume available is still a crucial element to limit recombination in the longer rods. Photooxidation of ethanol by trapped holes has been reported to occur on the order of nanoseconds in anatase (46), and it therefore competes more favorably with recombination in longer nanorods, in which carrier lifetimes are longer. Hence, photocatalytic activity is expected to be better for longer rods, which is consistent with the hydrogen evolution results in Fig. 2.
Fig. S9.
(A) Characteristic TA contour plot of medium-short TiO2 nanorod film with Pt. (B) TA spectra at several different delay times. The sample was pumped at 4.0 eV at 220 µJ⋅cm−2. The data at 2.0 eV are obscured because of scattered pump light.
Fig. 5.
In situ TA spectroscopy experiments. (A) Normalized TA kinetic traces of Pt-decorated nanorods in ethanol. Lines show fits with a biexponential model. (B) Fitted time constants [τ1 (Top) and τ2 (Bottom)] for brookite nanorod samples with Pt. Films were pumped at 4.0 eV at a fluence of 220 µJ⋅cm−2. The broad absorption feature is integrated from 2.1 eV to 3.25 eV.
Fig. S10.
(A) Normalized TA kinetic data (open symbols) and single exponential fit (line) for nanorod films, without Pt, in ethanol. (B) Fitted time constants. Films were pumped at 4.0 eV. The broad absorption feature was integrated from 2.1 eV to 3.25 eV.
The hole and electron diffusion lengths in titania are about 10 nm and several micrometers, respectively (48). The holes are effectively confined to the width of the nanorods, whereas electrons are free to move over the whole length, thanks to their 1D nature (49). Recombination and electrical conductivity are lower in brookite compared with anatase, which are positive attributes for photocatalysis (50). For these reasons, we correlate the high H2 production rate of the long rods with the delocalization of electrons along their 1D structure, which favors electron−hole separation and carrier extraction by protons and the alcohol.
It should be noted that the overall photocatalytic activity for these samples was not optimized. For example, a smaller Pt particle size or a lower loading can result in increased rates. Nevertheless, the brookite nanorods that we reported still showed among the highest H2 production rates from alcohol photoreforming. More generally, we validated an approach where, by controlling the photocatalyst 1D structure using colloidal methods, we were able to manipulate its photocatalytic and electronic properties, thereby providing a general scheme for improving the activity of photocatalytic materials.
Conclusions
We demonstrated not only that brookite titania is a highly active phase for photocatalytic hydrogen generation but also that engineering its structure can lead to dramatic improvements of photocatalytic activity. We showed that the anisotropic, 1D nature of the photocatalyst allows a much improved electron−hole separation after light excitation. The result of these combined efforts are materials that show some of the highest rates and quantum efficiencies for hydrogen production from biomass-derived compounds. The manipulation of the exciton through crystal structure is not restricted to this particular set of materials but can be generally and widely applicable to other semiconductor-based nanostructures.
Methods
Nanorod Synthesis.
Brookite nanorods were prepared using standard air-free Schlenk-type techniques following the synthesis described by Buonsanti et al. (24) with modifications to improve length control and particle dispersibility (8). See Supporting Information for further details.
Preparation of Photocatalytic Films.
Pt nanocrystals of ∼4.5 nm in size were prepared according to literature methods (51) and dissolved in hexanes to a concentration of ∼5 mg Pt⋅mL−1. Appropriate volumes of the two solutions were combined such that 1 mg of TiO2 and 0.01 mg of Pt (1 wt %) were present, and the resulting solution was diluted with hexanes to a volume of 200 µL. Then, 50 µL of octane were added, and the solution was drop-casted onto cover glass slides (1.8 × 1.8 cm; Fisher Scientific). The slide was covered with a plastic lid to reduce the solvent evaporation rate, which was ∼2 h. The samples were then used in the photocatalytic experiments without further treatment.
Photocatalytic Experiments.
Photocatalytic activity was measured in a home-built photocatalytic reactor. The film was immersed in aqueous solutions of the sacrificial agent (1/1 by volume for ethanol, or 1 M glycerol or glucose). The sample was irradiated using a Solar Simulator equipped with a 150-W Xe lamp filtered with an atmospheric filter (AM1.5) to reduce the fraction of UV photons. Ar flow at a rate of 15 mL⋅min−1 was used to remove air from the reactor and to carry gaseous reaction products to the gas chromatograph. See Supporting Information for further details.
SI Methods
Synthesis.
First, 10 mL of oleylamine, 10 mL of 1-octadecene, and 0.5 mL of oleic acid were combined and degassed at 120 °C for 1 h at pressures below 3 torr. The solution was then cooled under vacuum below 60 °C, the flask was switched to nitrogen and 1.5 mL of a stock solution of TiCl4 (0.2 M) and oleic acid (1 M) in 1-octadecene were added. The solution was then heated rapidly to 290 °C (∼30 °C⋅min−1) and held 10 min to allow for the formation of nanocrystal seeds. Variable amounts of the same TiCl4 stock solution were then added at a rate of 0.3 mL⋅min−1 using a New Era Pump Systems NE-1000 syringe pump, depending on the desired length (1 mL, 2 mL, 3 mL, 4 mL, or 8 mL for short, short-medium, medium, medium-long, and long rods samples, respectively). When injection was complete, the heating mantle was removed, and the flask was allowed to cool to ambient temperature. Purification of the nanorods was performed by three precipitation/centrifugation steps using isopropanol/ethanol mixtures as an antisolvent and redispersion in hexane. A final size-selective precipitation step was performed by dissolving the rods in a small amount of toluene and adding isopropanol until the mixture became turbid. The nanorods were then precipitated at 5,000 rpm, and the supernatant containing small particles was discarded, before finally dissolving the nanorods in hexanes at a concentration of about 25 mg TiO2⋅mL−1.
Photocatalytic Setup.
Gaseous products were analyzed by gas chromatography analysis using a thermal conductivity detector for the quantification of H2 and a flame ionization detector, coupled with a methanizer, for the quantification of carbon-containing compounds (CO, CO2, CH4, etc.). Quantum yields were calculated using monochromatic light provided by a 4W Pen Ray Hg medium pressure lamp with emission at 365 nm in conditions otherwise similar to the photocatalytic experiments. The incident light power was measured using a radiometer (Delta Ohm) with UV-A probe (range 315–400 nm) to be 12.5 W⋅m−2, whereas the transmitted light power was 3.88 W⋅m−2, corresponding to an absorption of 69%. The H2 production rate was measured with the same analytic apparatus used in the photocatalytic experiments described above. According to ref. 6 and IUPAC recommendations (33), the quantum yields were calculated using the formula
Characterization Techniques.
Physisorption studies of specific surface areas were performed on a Quantachrome Autosorb 1-MP using Kr as adsorptive (30, 31). Films on glass slides were transferred to a 12-mm-diameter glass sample bulb that was degassed at 120 °C for 19 h under vacuum in the Quantachrome degas station (cold trap cooled by liquid N2). Sorption measurements were then carried out at 87 K with krypton gas adsorbant (Praxair, 99.999% pure) and a sample bulb coolant bath of liquid argon (Praxair). Isotherms were captured from a pressure of ∼1 × 10⁻⁴–0.999 (adsorption cycle) to 0.01 (desorption cycle) po, where po is the solidification pressure of krypton in the pores of the samples under investigation (∼1.1 × 10⁶ Pa).
SEM images were obtained using a Magellan 400 XHR SEM (FEI Corporation) with a 50-pA beam current. Before imaging, all films were sputter-coated with a thin (<10 nm) Au60Pd40 layer (Cressington 108auto) and plasma-cleaned.
TA spectroscopy was performed with an Ultrafast Systems Helios spectrometer and a regeneratively amplified Ti:sapphire laser (Coherent Libra HE). The Coherent Libra HE outputs 50-fs pulses centered at 800 nm at a power of 3.5 W with a repetition rate of 1 kHz. The pump energy was tuned to 4.0 eV with an optical parametric amplifier (Coherent OPerA Solo). The 2broadband white light (1.8–3.8 eV) probe was generated by focusing the 800-nm pulsed laser light onto a CaF2 crystal. The white light was detected with an Si CCD array. Following photoexcitation by the pump, the change in the absorption of the film was monitored up to several nanoseconds with a white light probe. Every other pump pulse is blocked with an optical chopper, allowing the determination of photoexcited properties relative to the nonexcited state. Because the change in absorption in the photoexcited film is due to photoexcited carriers, monitoring these absorption transients allows one to track the relaxation of carriers with time. The time delay varies between 50 fs and 3 ns, giving kinetic information on a timescale relevant for recombination.
In situ EPR spectra in X band were recorded by a Bruker EMX CW-microspectrometer. An ER 4119HS-WI high-sensitivity optical resonator with a grid on the front side enabled irradiation of the catalysts using a 300-W Xe-arc lamp (LOT Oriel). Room-temperature measurements were conducted in special homemade flow cells while passing a carrier gas stream (He) saturated with water and ethanol (30 mL/min of He flow with added 5% H2O/EtOH in the volume ratio of 1:1) through the catalyst (20 mg). For experiments at –173 °C, the samples (15 mg) were filled into commercial X-band EPR tubes (4 mm o.d.; Wilmad) and measured under liquid nitrogen cooling. The g values were calculated using the equation h ν = gβB0, with B0 and ν being the resonance field and frequency, respectively. The g values were calibrated using 1,1-diphenyl-2-picrylhydrazyl (DPPH) as standard (g = 2.0036 ± 0.00004).
Acknowledgments
Benjamin T. Diroll (University of Pennsylvania) is acknowledged for building the titania model in Fig. 2 and for discussions. C.B.M. and J.B.B. acknowledge support from a collaborative National Science Foundation (NSF) Grant (NSF CBET-1335821 to C.B.M. and NSF CBET-1333649 to J.B.B.). S.Y.S. and J.B.B. acknowledge further support from NSF ECCS-1201957. The ultrafast spectrometer at Drexel University was acquired with funds from NSF MRI Award DMR-0922929. M.C. acknowledges partial support from NSF through the Nano/Bio Interface Center at the University of Pennsylvania, Grant DMR08-32802. J.J.D.J. is grateful for support to the Ramon y Cajal program and the Ce-NanoSurPhases project grant from MINECO. T.M. and P.F. acknowledge support from the Ministero dell’Istruzione, Università e Ricerca (Project 2010N3T9M4 “HI-PHUTURE”), EU FP7 COST Action CM1104 “Reducible oxide chemistry, structure and functions”, National Interuniversity Consortium of Materials Science and Technology (INSTM), and University of Trieste (FRA2013 Project). Work at Beam Line 11-ID-B (GUP-32747) of the Advanced Photon Source, an Office of Science User Facility operated for the US Department of Energy (DOE) Office of Science by Argonne National Laboratory, was supported by the US DOE under Contract DE-AC02-06CH11357. I.S.M. was supported by the Department of Defense through the National Defense Science & Engineering Graduate Fellowship Program, and by the Fannie and John Hertz Foundation through a Hertz Foundation Fellowship. J.A.S. acknowledges support of the Stanford University Center for Interface Science and Catalysis (SUNCAT) seed funding from the Dean of Engineering and the Dean of Research at Stanford University. C.B.M. is grateful for the support of the Richard Perry University Professorship.
Footnotes
The authors declare no conflict of interest.
This article is a PNAS Direct Submission.
This article contains supporting information online at www.pnas.org/lookup/suppl/doi:10.1073/pnas.1524806113/-/DCSupplemental.
References
- 1.Kamat PV. Meeting the clean energy demand: Nanostructure architectures for solar energy conversion. J Phys Chem C. 2007;111(7):2834–2860. [Google Scholar]
- 2.Lewis NS, Nocera DG. Powering the planet: Chemical challenges in solar energy utilization. Proc Natl Acad Sci USA. 2006;103(43):15729–15735. doi: 10.1073/pnas.0603395103. [DOI] [PMC free article] [PubMed] [Google Scholar]
- 3.Cargnello M, et al. Photocatalytic H2 and added-value by-products: The role of metal oxide systems in their synthesis from oxygenates. Eur J Inorg Chem. 2011;2011(28):4309–4323. [Google Scholar]
- 4.Malato S, Blanco J, Vidal A, Richter C. Photocatalysis with solar energy at a pilot-plant scale: An overview. Appl Catal B. 2002;37(1):1–15. [Google Scholar]
- 5.Schneider J, et al. Understanding TiO2 photocatalysis: Mechanisms and materials. Chem Rev. 2014;114(19):9919–9986. doi: 10.1021/cr5001892. [DOI] [PubMed] [Google Scholar]
- 6.Colombo DP, Bowman RM. Does interfacial charge transfer compete with charge carrier recombination? A femtosecond diffuse reflectance investigation of TiO2 nanoparticles. J Phys Chem. 1996;100(47):18445–18449. [Google Scholar]
- 7.Zhang Z, Yates JT., Jr Band bending in semiconductors: Chemical and physical consequences at surfaces and interfaces. Chem Rev. 2012;112(10):5520–5551. doi: 10.1021/cr3000626. [DOI] [PubMed] [Google Scholar]
- 8.Gordon TR, et al. Nonaqueous synthesis of TiO2 nanocrystals using TiF4 to engineer morphology, oxygen vacancy concentration, and photocatalytic activity. J Am Chem Soc. 2012;134(15):6751–6761. doi: 10.1021/ja300823a. [DOI] [PubMed] [Google Scholar]
- 9.Jun YW, et al. Surfactant-assisted elimination of a high energy facet as a means of controlling the shapes of TiO2 nanocrystals. J Am Chem Soc. 2003;125(51):15981–15985. doi: 10.1021/ja0369515. [DOI] [PubMed] [Google Scholar]
- 10.Dunn S. Hydrogen futures: Toward a sustainable energy system. Int J Hydrogen Energy. 2002;27(3):235–264. [Google Scholar]
- 11.Holladay JD, Hu J, King DL, Wang Y. An overview of hydrogen production technologies. Catal Today. 2009;139(4):244–260. [Google Scholar]
- 12.Cortright RD, Davda RR, Dumesic JA. Hydrogen from catalytic reforming of biomass-derived hydrocarbons in liquid water. Nature. 2002;418(6901):964–967. doi: 10.1038/nature01009. [DOI] [PubMed] [Google Scholar]
- 13.Chen X, Selloni A. Introduction: Titanium dioxide (TiO2) nanomaterials. Chem Rev. 2014;114(19):9281–9282. doi: 10.1021/cr500422r. [DOI] [PubMed] [Google Scholar]
- 14.Zhang H, Banfield JF. Thermodynamic analysis of phase stability of nanocrystalline titania. J Mater Chem. 1998;8(9):2073–2076. [Google Scholar]
- 15.Kandiel TA, Robben L, Alkaim A, Bahnemann D. Brookite versus anatase TiO2 photocatalysts: Phase transformations and photocatalytic activities. Photochem Photobiol Sci. 2013;12(4):602–609. doi: 10.1039/c2pp25217a. [DOI] [PubMed] [Google Scholar]
- 16.Kandiel TA, et al. Tailored titanium dioxide nanomaterials: Anatase nanoparticles and brookite nanorods as highly active photocatalysts. Chem Mater. 2010;22(6):2050–2060. [Google Scholar]
- 17.Li Z, Cong S, Xu Y. Brookite vs anatase TiO2 in the photocatalytic activity for organic degradation in water. ACS Catal. 2014;4(9):3273–3280. [Google Scholar]
- 18.Lin H, et al. Synthesis of high-quality brookite TiO2 single-crystalline nanosheets with specific facets exposed: Tuning catalysts from inert to highly reactive. J Am Chem Soc. 2012;134(20):8328–8331. doi: 10.1021/ja3014049. [DOI] [PubMed] [Google Scholar]
- 19.Altomare M, et al. High activity of brookite TiO2 nanoparticles in the photocatalytic abatement of ammonia in water. Catal Today. 2015;252(1):184–189. [Google Scholar]
- 20.Chiarello GL, Di Paola A, Palmisano L, Selli E. Effect of titanium dioxide crystalline structure on the photocatalytic production of hydrogen. Photochem Photobiol Sci. 2011;10(3):355–360. doi: 10.1039/c0pp00154f. [DOI] [PubMed] [Google Scholar]
- 21.Chen X, Liu L, Yu PY, Mao SS. Increasing solar absorption for photocatalysis with black hydrogenated titanium dioxide nanocrystals. Science. 2011;331(6018):746–750. doi: 10.1126/science.1200448. [DOI] [PubMed] [Google Scholar]
- 22.Asahi R, Morikawa T, Ohwaki T, Aoki K, Taga Y. Visible-light photocatalysis in nitrogen-doped titanium oxides. Science. 2001;293(5528):269–271. doi: 10.1126/science.1061051. [DOI] [PubMed] [Google Scholar]
- 23.Linic S, Christopher P, Ingram DB. Plasmonic-metal nanostructures for efficient conversion of solar to chemical energy. Nat Mater. 2011;10(12):911–921. doi: 10.1038/nmat3151. [DOI] [PubMed] [Google Scholar]
- 24.Buonsanti R, et al. Nonhydrolytic synthesis of high-quality anisotropically shaped brookite TiO2 nanocrystals. J Am Chem Soc. 2008;130(33):11223–11233. doi: 10.1021/ja803559b. [DOI] [PubMed] [Google Scholar]
- 25.Dong A, et al. A generalized ligand-exchange strategy enabling sequential surface functionalization of colloidal nanocrystals. J Am Chem Soc. 2011;133(4):998–1006. doi: 10.1021/ja108948z. [DOI] [PubMed] [Google Scholar]
- 26.Tompsett GA, et al. The Raman spectrum of brookite, TiO2 (Pbca, Z = 8) J Raman Spectrosc. 1995;26(1):57–62. [Google Scholar]
- 27.Hahn-Hägerdal B, Galbe M, Gorwa-Grauslund MF, Lidén G, Zacchi G. Bio-ethanol—The fuel of tomorrow from the residues of today. Trends Biotechnol. 2006;24(12):549–556. doi: 10.1016/j.tibtech.2006.10.004. [DOI] [PubMed] [Google Scholar]
- 28.Gao Z, et al. Photosynthetic production of ethanol from carbon dioxide in genetically engineered cyanobacteria. Energy Environ Sci. 2012;5(12):9857–9865. [Google Scholar]
- 29.Gaya UI, Abdullah AH. Heterogeneous photocatalytic degradation of organic contaminants over titanium dioxide: A review of fundamentals, progress and problems. J Photochem Photobiol C Photochem Rev. 2008;9(1):1–12. [Google Scholar]
- 30.Disdier J, Herrmann JM, Pichat P. Platinum/titanium dioxide catalysts. A photoconductivity study of electron transfer from the ultraviolet-illuminated support to the metal and of the influence of hydrogen. J Chem Soc Faraday Trans. 1983;79(3):651–660. [Google Scholar]
- 31.Gombac V, et al. CuO(x)-TiO2 photocatalysts for H2 production from ethanol and glycerol solutions. J Phys Chem A. 2010;114(11):3916–3925. doi: 10.1021/jp907242q. [DOI] [PubMed] [Google Scholar]
- 32.Chen X, Shen S, Guo L, Mao SS. Semiconductor-based photocatalytic hydrogen generation. Chem Rev. 2010;110(11):6503–6570. doi: 10.1021/cr1001645. [DOI] [PubMed] [Google Scholar]
- 33.Braslavsky SE, et al. Glossary of terms used in photocatalysis and radiation catalysis (IUPAC recommendations 2011) Pure Appl Chem. 2011;83(4):931–1014. [Google Scholar]
- 34.Krause KM, Thommes M, Brett MJ. Pore analysis of obliquely deposited nanostructures by krypton gas adsorption at 87 K. Microporous Mesoporous Mater. 2011;143(1):166–173. [Google Scholar]
- 35.Thommes M, Nishiyama N, Tanaka S. Aspects of a novel method for the pore size analysis of thin silica films based on krypton adsorption at liquid argon temperature (87.3 K) Stud Surf Sci Catal. 2007;165(1):551–554. [Google Scholar]
- 36.Kondarides DM, Daskalaki VM, Patsoura A, Verykios XE. Hydrogen production by photo-induced reforming of biomass components and derivatives at ambient conditions. Catal Lett. 2008;122(1):26–32. [Google Scholar]
- 37.Montini T, et al. Nanostructured Cu/TiO2 photocatalysts for H2 production from ethanol and glycerol aqueous solutions. ChemCatChem. 2011;3(3):574–577. [Google Scholar]
- 38.Cybula A, et al. The effect of calcination temperature on structure and photocatalytic properties of Au/Pd nanoparticles supported on TiO2. Appl Catal B. 2014;152-153(1):202–211. [Google Scholar]
- 39.Livraghi S, et al. Nature of reduced states in titanium dioxide as monitored by electron paramagnetic resonance. II: Rutile and brookite cases. J Phys Chem C. 2014;118(38):22141–22148. [Google Scholar]
- 40.Coronado JM, et al. EPR Study of the surface characteristics of nanostructured TiO2 under UV irradiation. Langmuir. 2001;17(17):5368–5374. [Google Scholar]
- 41.Anpo M, et al. Generation of superoxide ions at oxide surfaces. Top Catal. 1999;8(3-4):189–198. [Google Scholar]
- 42.Naldoni A, et al. Pt and Au/TiO2 photocatalysts for methanol reforming: Role of metal nanoparticles in tuning charge trapping properties and photoefficiency. Appl Catal B. 2013;130-131(1):239–248. [Google Scholar]
- 43.Baxter JB, Richter C, Schmuttenmaer CA. Ultrafast carrier dynamics in nanostructures for solar fuels. Annu Rev Phys Chem. 2014;65(1):423–447. doi: 10.1146/annurev-physchem-040513-103742. [DOI] [PubMed] [Google Scholar]
- 44.Yoshihara T, et al. Identification of reactive species in photoexcited nanocrystalline TiO2 films by wide-wavelength-range (400−2500 nm) transient absorption spectroscopy. J Phys Chem B. 2004;108(12):3817–3823. [Google Scholar]
- 45.Henderson MA. A surface science perspective on photocatalysis. Surf Sci Rep. 2011;66(6-7):185–297. [Google Scholar]
- 46.Tamaki Y, et al. Direct observation of reactive trapped holes in TiO2 undergoing photocatalytic oxidation of adsorbed alcohols: Evaluation of the reaction rates and yields. J Am Chem Soc. 2006;128(2):416–417. doi: 10.1021/ja055866p. [DOI] [PubMed] [Google Scholar]
- 47.Tamaki Y, et al. Trapping dynamics of electrons and holes in a nanocrystalline TiO2 film revealed by femtosecond visible/near-infrared transient absorption spectroscopy. C R Chim. 2006;9(2):268–274. [Google Scholar]
- 48.Fisher AC, et al. Intensity dependence of the back reaction and transport of electrons in dye-sensitized nanocrystalline TiO2 solar cells. J Phys Chem B. 2000;104(5):949–958. [Google Scholar]
- 49.Varghese OK, Paulose M, Grimes CA. Long vertically aligned titania nanotubes on transparent conducting oxide for highly efficient solar cells. Nat Nanotechnol. 2009;4(9):592–597. doi: 10.1038/nnano.2009.226. [DOI] [PubMed] [Google Scholar]
- 50.Kusumawati Y, et al. Charge transport and recombination in TiO2 brookite-based photoelectrodes. J Phys Chem C. 2014;118(41):23459–23467. [Google Scholar]
- 51.Cargnello M, et al. Control of metal nanocrystal size reveals metal-support interface role for ceria catalysts. Science. 2013;341(6147):771–773. doi: 10.1126/science.1240148. [DOI] [PubMed] [Google Scholar]


