Significance
Deoxycytidine kinase (dCK) is required for the activation of multiple nucleoside analog prodrugs used in cancer therapy and is a potential new therapeutic target in hematological malignancies. Here, we identify [18F]Clofarabine; 2-chloro-2′-deoxy-2′-[18F]fluoro-9-β-d-arabinofuranosyl-adenine ([18F]CFA) as a new candidate PET probe for dCK, with superior specificity and biodistribution in humans compared with existing probes. [18F]CFA PET may provide a useful companion biomarker for therapeutic interventions against cancer that include nucleoside analog prodrugs, dCK inhibitors, and immunotherapies.
Keywords: nucleotide metabolism, deoxycytidine kinase, PET imaging, cancer
Abstract
Deoxycytidine kinase (dCK), a rate-limiting enzyme in the cytosolic deoxyribonucleoside (dN) salvage pathway, is an important therapeutic and positron emission tomography (PET) imaging target in cancer. PET probes for dCK have been developed and are effective in mice but have suboptimal specificity and sensitivity in humans. To identify a more suitable probe for clinical dCK PET imaging, we compared the selectivity of two candidate compounds—[18F]Clofarabine; 2-chloro-2′-deoxy-2′-[18F]fluoro-9-β-d-arabinofuranosyl-adenine ([18F]CFA) and 2′-deoxy-2′-[18F]fluoro-9-β-d-arabinofuranosyl-guanine ([18F]F-AraG)—for dCK and deoxyguanosine kinase (dGK), a dCK-related mitochondrial enzyme. We demonstrate that, in the tracer concentration range used for PET imaging, [18F]CFA is primarily a substrate for dCK, with minimal cross-reactivity. In contrast, [18F]F-AraG is a better substrate for dGK than for dCK. [18F]CFA accumulation in leukemia cells correlated with dCK expression and was abrogated by treatment with a dCK inhibitor. Although [18F]CFA uptake was reduced by deoxycytidine (dC) competition, this inhibition required high dC concentrations present in murine, but not human, plasma. Expression of cytidine deaminase, a dC-catabolizing enzyme, in leukemia cells both in cell culture and in mice reduced the competition between dC and [18F]CFA, leading to increased dCK-dependent probe accumulation. First-in-human, to our knowledge, [18F]CFA PET/CT studies showed probe accumulation in tissues with high dCK expression: e.g., hematopoietic bone marrow and secondary lymphoid organs. The selectivity of [18F]CFA for dCK and its favorable biodistribution in humans justify further studies to validate [18F]CFA PET as a new cancer biomarker for treatment stratification and monitoring.
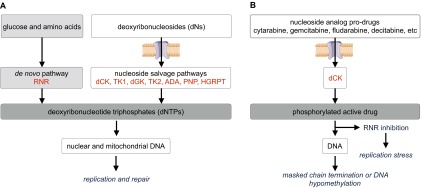
Accurate DNA replication and repair require sufficient and balanced production of deoxyribonucleoside triphosphates (dNTPs) (1). Mammalian cells synthesize dNTPs by two biochemical routes: the de novo pathway produces dNTPs from glucose and amino acid precursors whereas the nucleoside salvage pathway generates dNTPs from deoxyribonucleosides (dNs) scavenged from the extracellular milieu by the combined action of nucleoside transporters and dN kinases (Fig. S1A). The cytosolic dN kinases in mammalian cells are thymidine kinase 1 (TK1), which phosphorylates thymidine (dT) and deoxyuridine (dU), and deoxycytidine kinase (dCK), which phosphorylates deoxycytidine (dC), deoxyadenosine (dA), and deoxyguanosine (dG) (2). Although dCK has been studied extensively in vitro, its in vivo functions are not well understood. Previously, we reported impaired hematopoiesis in dCK−/− mice resulting from DNA replication stress in hematopoietic progenitors due to insufficient dCTP supply (3, 4). More recently, we showed that, in cancer cells, dCK confers resistance to inhibitors of de novo dCTP biosynthesis and that pharmacological cotargeting of dCK and ribonucleotide reductase, the rate-limiting enzyme in the de novo pathway, was well-tolerated and efficacious in animal models of acute leukemia (5, 6). dCK also plays an essential role in the activation of the nucleoside analog prodrugs Cytarabine, Fludarabine, Gemcitabine, Decitabine, Cladribine, and Clofarabine (7) (Fig. S1B). Clinically applicable assays to measure tumor dCK activity in vivo would be of great value, given the variable response rates and toxicities associated with these frequently used prodrugs (7). Collectively, the identification of dCK as a new therapeutic target in acute leukemia, the requirement for dCK in the activation of FDA-approved nucleoside analog prodrugs, and the heterogeneous expression of dCK in cancer suggest that dCK is an important target for noninvasive biomarker PET imaging.
Fig. S1.
Schematic overview of de novo and salvage dNTP biosynthetic pathways and the mechanism of action of dCK-dependent nucleoside analog prodrugs. (A) dNTPs are synthesized by the de novo pathway starting from glucose and amino acids, and by nucleoside salvage pathways starting with preformed deoxyribonucleosides (dNs). ADA, adenosine deaminase; dCK, deoxycytidine kinase; dGK, deoxyguanosine kinase; HGPRT, hypoxanthine-guanine phosphoribosyltransferase; PNP, purine nucleoside phosphorylase; RNR, ribonucleotide reductase; TK1, thymidine kinase 1; TK2, thymidine kinase 2. (B) Indicated nucleoside analog prodrugs are phosphorylated by dCK to their monophosphate forms and trapped inside the cells by dCK. Subsequent phosphorylation steps generate the active di- and triphosphate forms that induce anti-tumor effects via the indicated mechanisms.
The first PET probe described for dCK imaging was 1-(2′-deoxy-2′-[18F]fluoro-β-d-arabinofuranosyl)cytosine ([18F]FAC) (8). Although [18F]FAC enabled PET imaging of dCK activity in mice (8–11), a subsequent study (12) questioned its clinical utility because of rapid probe catabolism mediated by cytidine deaminase (CDA), an enzyme present at higher levels in humans than in rodents (13). CDA converts [18F]FAC to 1-(2′-deoxy-2′-[18F]fluoro-β-d-arabinofuranosyl)uracil ([18F]FAU), a metabolite that is not phosphorylated by dCK. To overcome this problem, l-enantiomer analogs of [18F]FAC that resisted deamination and retained affinity for dCK were developed (14). Two of the l-enantiomer analogs—1-(2′-deoxy-2′-[18F]fluoro-β-l-arabinofuranosyl)cytosine (l-[18F]FAC) and 2′-deoxy-2′-[18F]fluoro-5-methyl-β-l-arabinofuranosylcytosine (l-[18F]FMAC)—were translated to the clinic (12, 15). These second generation dCK probes had better sensitivity than [18F]FAC in humans as reflected by improved accumulation in the bone marrow, a tissue with high dCK activity. However, both l-FAC analogs were cross-reactive with mitochondrial thymidine kinase 2 (TK2), which, like dCK, lacks enantioselectivity and consequently phosphorylates deoxypyrimidines with both d- and l-enantiomeric configurations (16). In humans, cross-reactivity with TK2 was likely responsible for the uptake of the FAC analogs into the myocardium (12), a tissue with high TK2 expression (17).
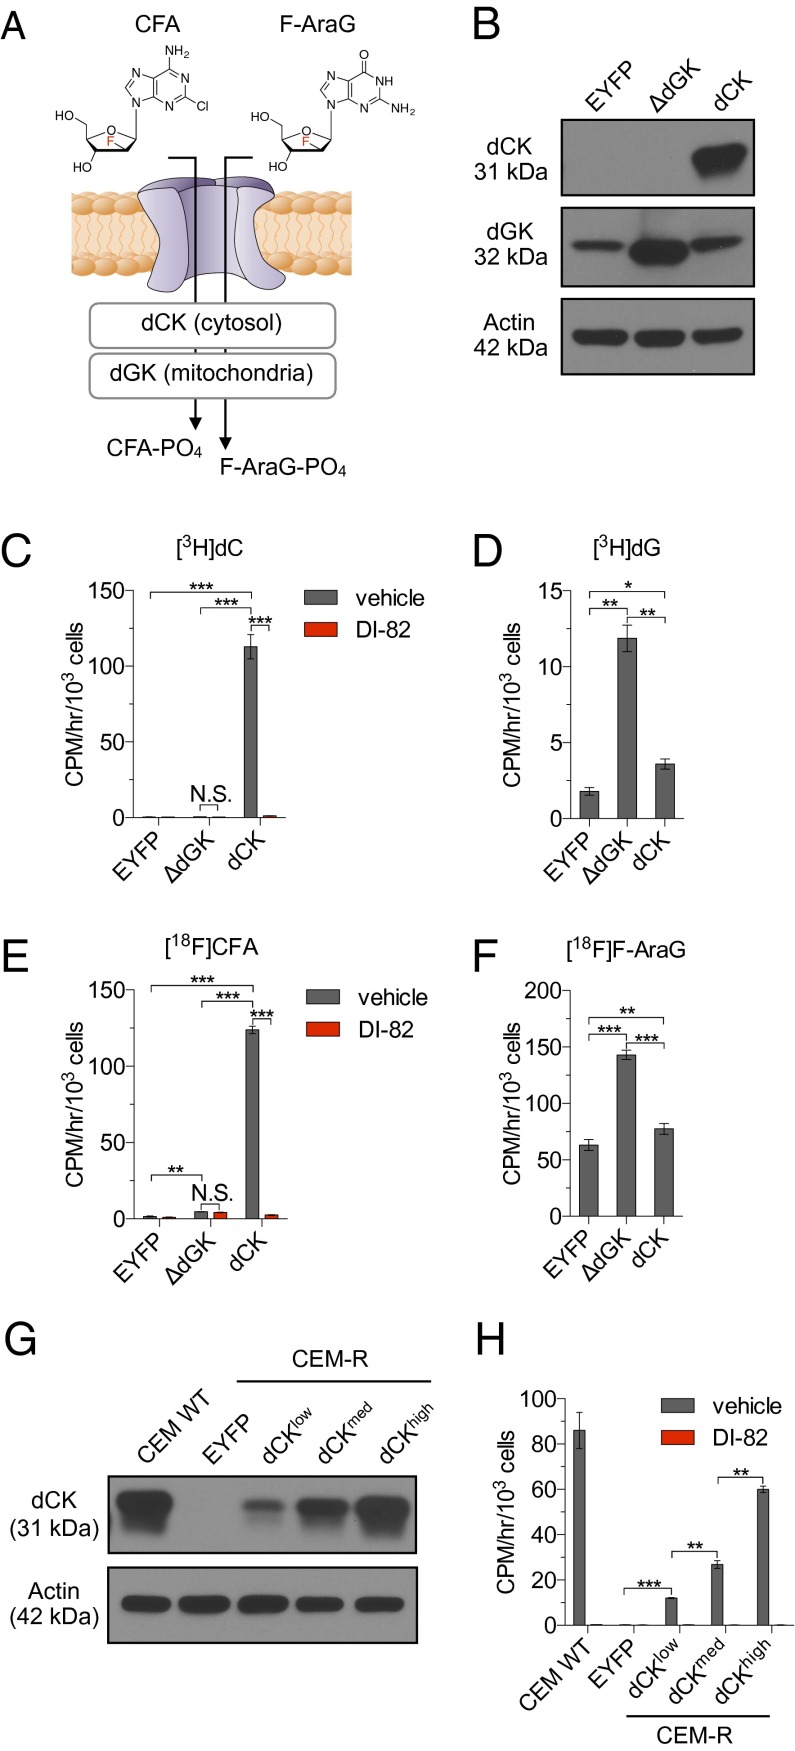
Because dCK phosphorylates both pyrimidines and purines (18), the limitations of current PET probes for dCK could be circumvented using fluorinated purine analogs. Two candidate purine PET probes for dCK have been proposed (Fig. 1A): [18F]Clofarabine; 2-chloro-2′-deoxy-2′-[18F]fluoro-9-β-d-arabinofuranosyl-adenine ([18F]CFA) (14) and 2′-deoxy-2′-[18F]fluoro-9-β-d-arabinofuranosyl-guanine ([18F]F-AraG) (19). Unlike FAC and its analogs, neither of these purine analogs is phosphorylated by TK2. However, both [18F]CFA and [18F]F-AraG may be substrates for the mitochondrial deoxyguanosine kinase (dGK) (Fig. 1A), which is structurally related to both dCK and TK2 (20). Despite some overlap in substrate specificity, dCK and dGK have distinct biological functions (18, 21, 22) and expression patterns (22, 23). Therefore, to properly interpret the information provided by [18F]CFA and [18F]F-AraG PET scans, it is essential to delineate the roles played by dCK and dGK in the intracellular trapping of these two candidate PET probes. Here, we compared the selectivity of [18F]CFA and [18F]F-AraG for dCK and dGK. Observed differences in kinase selectivity indicated that PET assays using these probes are likely to have distinct applications, with [18F]CFA as the choice for clinical dCK imaging and [18F]F-AraG as the appropriate probe for dGK imaging. We then investigated whether competition between [18F]CFA and endogenous dC affected the sensitivity of [18F]CFA PET imaging in the range of plasma dC concentrations found in mice, humans, and other species. We also present preliminary first-in-human, to our knowledge, studies of [18F]CFA biodistribution and discuss how this tracer complements the current repertoire of PET probes for nucleotide metabolism.
Fig. 1.
[18F]CFA accumulation is primarily dCK-dependent whereas [18F]F-AraG uptake primarily reflects dGK activity. (A) Potential mechanisms for accumulation of CFA and F-AraG in cells. (B) Western blot analysis of dCK and dGK expression in dCK-deficient CEM-R cells engineered to express EYFP (negative control), or dCK, or truncated human dGK (ΔdGK) lacking the mitochondrial sorting N-terminal sequence. (C) [3H]dC (18.5 kBq), (D) [3H]dG (18.5 kBq), (E) [18F]CFA (18.5 kBq), and (F) [18F]F-AraG (18.5 kBq) uptake assays using the isogenic panel of cells shown in B. [3H]dC and [18F]CFA uptake assays were performed in the presence or absence of DI-82 (1 µM), a small molecule inhibitor of dCK (C and E). N.S., nonsignificant; *P < 0.05; **P < 0.01; ***P < 0.001. (G) Western blot analysis of dCK expression in CEM WT cells and in CEM-R cells engineered to express EYFP or low, medium, and high dCK levels. (H) [3H]CFA (18.5 kBq) uptake, ± DI-82 (1 µM), in the isogenic panel of CEM-R cell lines shown in A. **P < 0.01; ***P < 0.001. All results are representative of three independent experiments (n = 3 for each experiment).
Results
Differential Selectivity of [18F]CFA and [18F]F-AraG for dCK and dGK.
To determine the selectivity of [18F]CFA and [18F]F-AraG for dCK and dGK, CEM-R leukemia cells, which do not express dCK (24) but contain endogenous dGK (Fig. 1B), were reconstituted with human dCK (CEM-R-dCK) (Fig. 1B). To enable an additional comparison between [18F]CFA and [18F]F-AraG in the absence of any confounding aspects related to potential differences in the access of these two probes to mitochondrial-located dGK, we also generated CEM-R cells that express a truncated form of human dGK (CEM-R-ΔdGK), which lacks the N-terminal mitochondrial sorting signal (Fig. 1B). CEM-R cells expressing enhanced yellow fluorescent protein (CEM-R-EYFP) completed the isogenic panel (Fig. 1B). Radioactive uptake assays using tracer amounts (10–100 nM) of [3H]-labeled endogenous substrates deoxycytidine ([3H]dC) and deoxyguanosine ([3H]dG) were used to validate the isogenic lines. [3H]dC accumulation was 237 ± 17-fold higher in CEM-R-dCK cells compared with CEM-R-EYFP and CEM-R-ΔdGK cells (Fig. 1C). DI-82, a specific dCK inhibitor (25), abrogated [3H]dC accumulation in CEM-R-dCK cells (Fig. 1C). CEM-R-ΔdGK cells retained 6.62 ± 0.49-fold more [3H]dG compared with CEM-R-EYFP cells (Fig. 1D), thereby confirming the functionality of the truncated dGK construct. [3H]dG also accumulated in CEM-R-dCK cells (2.01 ± 0.19-fold increase relative to CEM-R-EYFP cells) (Fig. 1D), consistent with the ability of dCK to phosphorylate both pyrimidine and purine substrates (2, 18). The isogenic CEM-R panel was then used to compare the accumulation of tracer amounts (50–100 pM) of [18F]CFA and [18F]F-AraG. [18F]CFA accumulation in CEM-R-EYFP cells was indistinguishable from background levels (Fig. 1E). Although ΔdGK overexpression resulted in a minor increase (2.97 ± 0.09-fold) in [18F]CFA accumulation, a much larger (79 ± 2-fold) increase in probe uptake was observed in the CEM-R-dCK cells (Fig. 1E). DI-82 abrogated [18F]CFA accumulation in CEM-R-dCK cells (Fig. 1E), thereby confirming the specificity of this probe for dCK. Overall, [18F]CFA accumulation in the isogenic CEM-R panel closely resembled that of [3H]dC (Fig. 1C). In contrast, [18F]F-AraG accumulation (Fig. 1F) closely resembled that of [3H]dG (Fig. 1D). In summary, in the subnanomolar concentration range relevant for PET imaging, [18F]CFA is primarily a substrate for dCK, with minimal cross-reactivity for dGK, whereas [18F]F-AraG is primarily a substrate for dGK, with dCK playing a lesser role. [18F]CFA accumulation was sensitive to variations in dCK expression (Fig. 1 G and H), further supporting the utility of this probe for imaging dCK activity.
[18F]CFA Accumulation Is Inhibited by Deoxycytidine at Concentrations Present in Murine and Rat Plasma, but Not in Human or Nonhuman Primate Plasma.
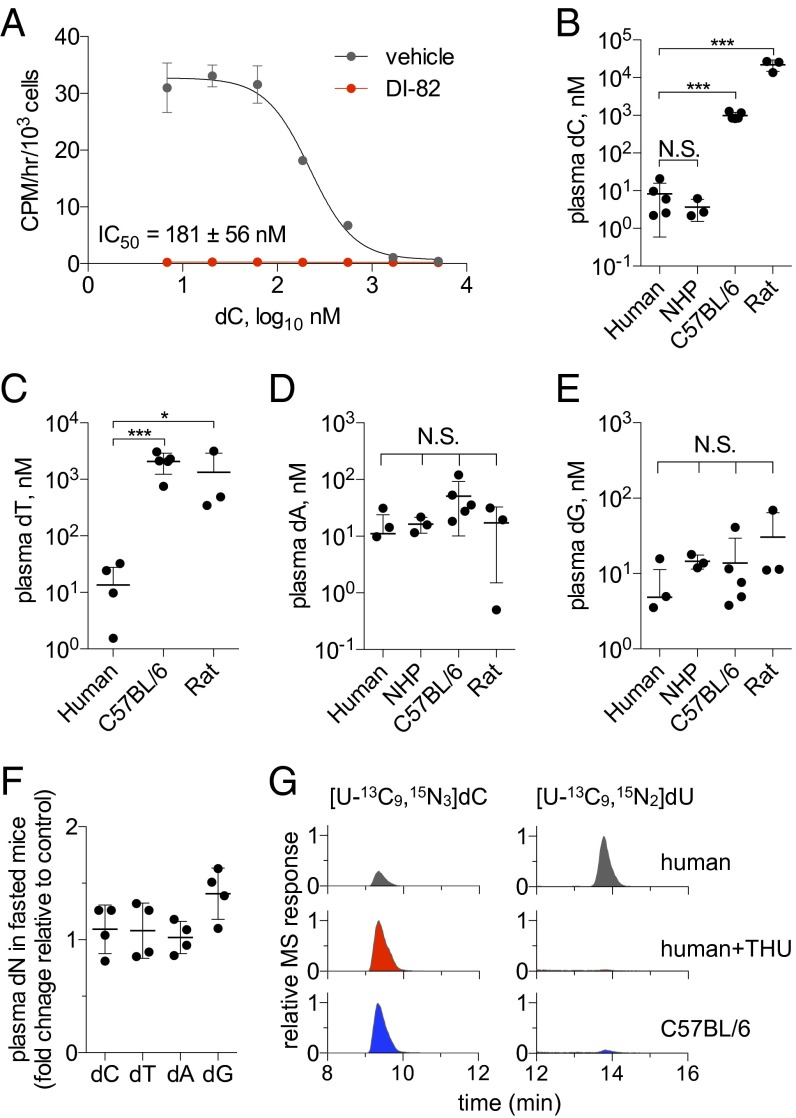
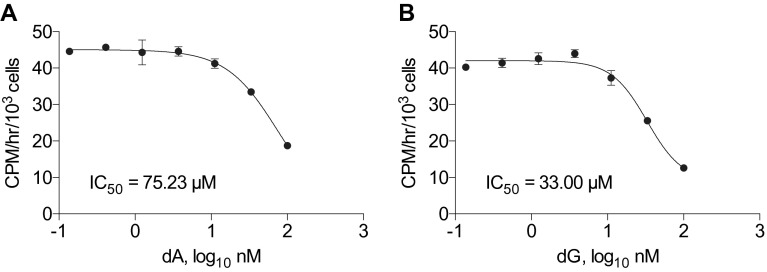
Competition between probes and endogenous metabolites often reduces the sensitivity of PET assays: e.g., 2-deoxy-2-[18F]fluoro-d-glucose ([18F]FDG) competes with endogenous glucose (26) and 3′-[18F]fluoro-3′-deoxythymidine ([18F]FLT) competes with endogenous thymidine (dT) (27, 28). As shown in Fig. 2A, [3H]CFA accumulation is also inhibited in a dose-dependent manner by dC, the physiological substrate of dCK, with an IC50 value of 181 ± 56 nM (Fig. 2A). Deoxyadenosine (dA) and deoxyguanosine (dG), which are also dCK substrates (18), also inhibited [3H]CFA accumulation (Fig. S2). The high IC50 values observed for dA and dG (75 µM and 33 µM, respectively) (Fig. S2) likely reflect the rapid catabolism of these purine dNs by adenosine deaminase (ADA) and purine nucleoside phosphorylase (PNP); both are expressed at high levels in lymphoid cells (29, 30).
Fig. 2.
The endogenous dCK substrate dC competes with [3H]CFA uptake at concentrations found in rodent plasma but not in human or NHP plasma. (A) Extracellular dC competes with CFA uptake. [3H]CFA (9.25 kBq) uptake for 1 h in CEM WT cells in the presence of varying concentrations of dC ± DI-82 (1 µM). n = 3 per group. (B) Plasma dC, (C) dT, (D) dA, and (E) dG concentrations for indicated species. The dT concentration in the NHP plasma was below the lowest limit of detection for the assay (10 nM). n = 5 subjects per group for human and C57BL/6 murine plasma; n = 3 subjects per group for NHP and rat plasma. (F) Mice were fasted for 24 h before plasma collection. Plasma dN concentrations were measured by LC-MS/MS-MRM and were normalized to those of the control unstarved group. n = 4 mice per group. N.S., nonsignificant; *P < 0.05; ***P < 0.001. (G) [U-13C9,15N3]dC (5 µM) is more rapidly deaminated to [13C9,15N2]dU upon 60-min incubation with human plasma (Top) than mouse plasma (Bottom). The deamination of dC was blocked by treating human plasma samples with 100 µM THU, a specific CDA inhibitor (Middle).
Fig. S2.
The endogenous dCK substrates dA and dG compete with [3H]CFA uptake. [3H]CFA (9.25 kBq) uptake for 1 h in CEM WT cells in the presence of varying concentrations of (A) dA and (B) dG. n = 3 triplicates.
To determine whether the competition between CFA and dC observed in cell culture could also occur in vivo, plasma dC levels in humans, nonhuman primates (NHPs), mice, and rats were measured by combined liquid chromatography tandem mass spectrometry in the multiple reaction-monitoring mode (LC-MS/MS-MRM) (Fig. 2B). C57BL/6 mouse and rat plasma dC concentrations were in the high nanomolar to low micromolar range, which, according to our cell culture data, are sufficient to inhibit CFA uptake. In marked contrast, plasma dC concentrations were two to three orders of magnitude lower in humans and NHPs than in mice and rats and are well-below the levels that can inhibit CFA uptake. A similar pattern was observed for dT in our study (Fig. 2C), in agreement with previous reports (31, 32). In contrast to dC and dT, plasma concentrations of dA and dG did not differ significantly in the examined species (Fig. 2 D and E). Mouse plasma dN levels were not affected by 24-h fasting (Fig. 2F), arguing against an exogenous origin for these nucleosides. Instead, the observed differences are likely the result of different catabolic rates of endogenously produced dC and dT in rodents vs. primates. To test this hypothesis, stable isotope-labeled dC ([U-13C9,15N3]dC) was incubated for 1 h in human and mouse plasma samples with or without tetrahydrouridine (THU), a specific cytidine deaminase (CDA) inhibitor (33). CDA catalyzes the first step in dC catabolism by converting dC to deoxyuridine (dU). LC-MS/MS-MRM analyses of labeled dC and dU demonstrated that dC was catabolized more rapidly in human than in murine plasma (Fig. 2G, Top and Bottom). Moreover, the CDA inhibitor THU blocked dC deamination in human plasma (Fig. 2G, Middle).
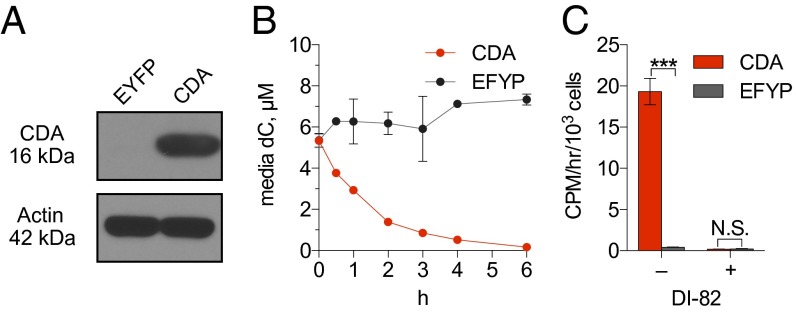
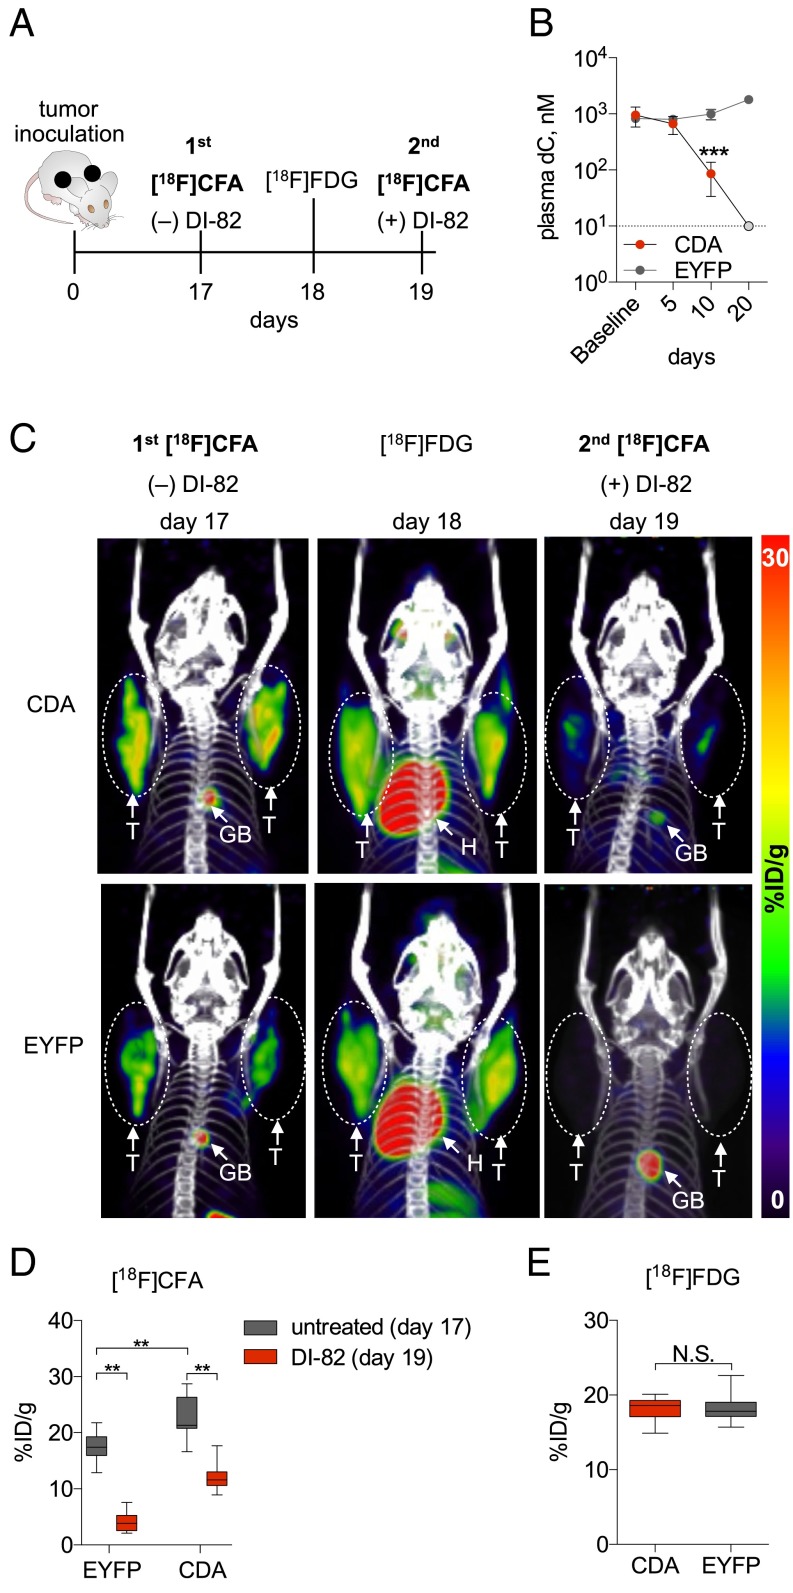
To further investigate how CDA expression influences CFA accumulation, CEM cells engineered to express CDA (CEM-CDA) or EYFP (CEM-EYFP, negative control) (Fig. 3A) were incubated with cell culture medium containing 5 µM [U-13C9,15N3]dC. The medium was sampled at the times shown to measure the CDA-mediated catabolism of labeled dC. An ∼32-fold decrease in the amount of [U-13C9,15N3]dC was observed after a 6 h incubation with CEM-CDA cells, but not with the CDA-negative cells (Fig. 3B). Consequently, [3H]CFA added for 1 h after the 6-h incubation period was retained only in the CEM-CDA cells. [3H]CFA accumulation by the CEM-CDA cells was dCK-dependent, as indicated by the effect of the dCK inhibitor DI-82 (Fig. 3C). To model these cell culture findings in vivo, nonobese diabetic (NOD) SCID IL-2 receptor gamma chain KO (NSG) mice underwent s.c. bilateral implantation with either CEM-EYFP or CEM-CDA cells in both flanks. Mice bearing bilateral tumors were imaged serially by PET/CT, using either [18F]CFA or [18F]FDG, at the indicated times (Fig. 4A). Plasma dC concentrations decreased with time in mice with CEM-CDA tumors but not in mice with CEM-EYFP tumors (Fig. 4B), likely reflecting the leakage of tumor CDA in plasma. Consistent with the cell culture data (Fig. 3C), mice bearing CEM-CDA tumors, which had reduced plasma dC levels, accumulated significantly more [18F]CFA than mice bearing CEM-EYFP tumors, as indicated by day 17 PET scans (Fig. 4 C and D). [18F]FDG PET scans performed on day 18 revealed similar metabolic activity in both CDA and EYFP tumors (Fig. 4 C and E). On day 19, mice were treated with DI-82 followed by a second [18F]CFA PET scan, which confirmed that tumor probe accumulation was dCK-dependent (Fig. 4 C and D). Collectively, these data indicate that (i) competition with endogenous dC reduces the sensitivity of [18F]CFA PET imaging in species with high levels of plasma dC concentration such as mice and rats, (ii) CDA activity is an important determinant of [18F]CFA accumulation in tumors, by reducing the levels of competing endogenous dC, and (iii) tumor [18F]CFA accumulation in vivo requires dCK activity.
Fig. 3.
Increased CDA expression reduces dC levels and increases [3H]CFA accumulation by CEM leukemia cells. (A) Western Blot for CDA expression in CEM cells engineered to express EYFP or CDA. (B) LC-MS/MS-MRM measurements of dC levels in culture supernatants from these cells incubated for the indicated times with 5 µM [U-13C9,15N3]dC. n = 3. (C) [3H]CFA (9.25 kBq) uptake (over 1 h) in the isogenic panel described in A, after 6 h of incubation in medium supplemented with dC (5 µM) ± DI-82 (1 µM). N.S., nonsignificant; ***P < 0.001. Results are representative of three independent experiments (n = 3 for each group).
Fig. 4.
Increased CDA expression in tumor xenografts is sufficient to reduce plasma dC levels in mice and to increase dCK-dependent tumor [18F]CFA accumulation. (A) Experimental design and timeline. (B) Plasma dC levels in tumor-bearing mice were measured at the indicated times. On day 20 post-tumor inoculation, plasma dC concentration in the NSG mice injected with CEM-CDA cells was below 10 nM (gray circle), which corresponds to the lowest limit of detection of the LC-MS/MS-MRM assay. ***P < 0.001; n = 5 mice per group. (C) Representative PET/CT scans of a mouse that was serially imaged with [18F]CFA (day 17), with [18F]FDG (day 18), and then again with [18F]CFA on day 19, 2 h after treatment with DI-82 (50 mg/kg in 50% PEG/Tris, pH 7.4, by i.p. injection). GB, gallbladder; H, heart; %ID/g, percentage injected dose per gram; T, tumor. (D and E) Quantification of [18F]CFA and [18F]FDG PET/CT scans from C. N.S., nonsignificant; **P < 0.01; n = 5 mice per group.
First-in-Human [18F]CFA Biodistribution Studies.
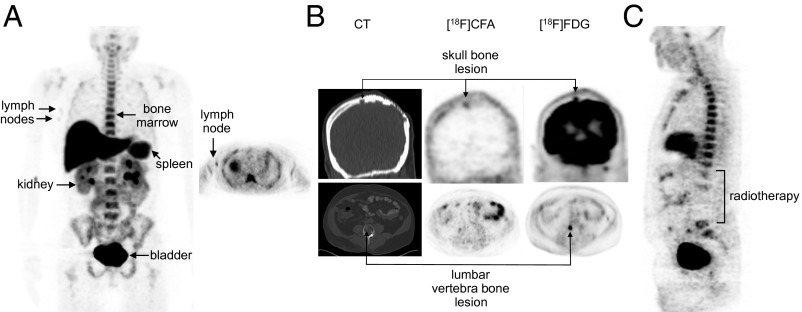
Because dC competes with CFA for cellular uptake (Fig. 2A) and because plasma dC levels are two to three orders of magnitude lower in humans than in mice (Fig. 2B), we hypothesized that the biodistribution of [18F]CFA will be more favorable in humans than in mice. Indeed, unlike the negative scans in mice (14), [18F]CFA PET/CT scans in healthy volunteers revealed significant probe accumulation in dCK-positive tissues (bone marrow, liver, and spleen) (Fig. 5A). [18F]CFA also accumulated in the axillary lymph nodes (Fig. 5A, arrows) of healthy volunteers (Fig. 5A, Left, coronal; Right, transverse image). Label accumulation in the kidneys and bladder was indicative of urinary clearance. [18F]CFA and [18F]FDG PET/CT scans of a paraganglioma patient showed label accumulation in a skull bone tumor lesion but not in a lumbar vertebra bone lesion (Fig. 5B), reflecting interlesion heterogeneity in [18F]CFA uptake. We were initially surprised that the [18F]CFA accumulation observed throughout the spinal column in healthy volunteers (Fig. 5A) was not detected in the paraganglioma patient in whom the lumbar segment of the spinal column was negative for [18F]CFA accumulation (Fig. 5C). A subsequent examination of the clinical history of this patient revealed that the [18F]CFA-negative lumbar spine region corresponds anatomically to the part of the vertebral column that was previously (9 mo before the scan) irradiated to target a tumor lesion at this location. This serendipitous finding suggested that [18F]CFA bone accumulation in humans likely reflects dCK-dependent probe uptake by bone marrow cells, rather than probe defluorination. Further supporting this interpretation, CFA defluorination was not detected in metabolic stability studies of CFA administered at pharmacological doses in humans (34).
Fig. 5.
[18F]CFA PET CT images in humans. (A) Images of [18F]CFA biodistribution in a healthy volunteer. Maximum intensity 2D projection whole body image (Left) and cross-sectional tomographic image (Right) of the axilla indicating probe accumulation in the lymph nodes. (B) [18F]CFA PET/CT and [18F]FDG PET/CT images of a paraganglioma patient showing variability in [18F]CFA accumulation between the skull lesion and the vertebra lesion. (C) Whole body [18F]CFA image of the same patient as in B, showing reduced probe accumulation in previously irradiated lumbar spine region.
Discussion
We show that [18F]CFA is a highly specific substrate/probe for dCK, with minimal cross-reactivity with dGK. [18F]CFA accumulation in leukemia cells was competitively inhibited in a concentration-dependent manner by dC, the physiological dCK substrate. Evidence is provided that plasma dC levels vary significantly across species and that these variations correspond to striking differences in [18F]CFA biodistribution between mice and humans. Accordingly, the [18F]CFA PET assay is more sensitive in humans than in mice, due to reduced competition between the probe and endogenous dC. [18F]CFA accumulation in leukemia cells was dCK-dependent, and probe accumulation was sensitive to variations in dCK expression. In this context, a large variation in dCK expression and activity was observed in a panel of lymphoma cell lines (35). Similar variations in dCK expression likely occur in other cancers. dCK mRNA levels also increase upon T-cell activation (8). Additional levels of dCK regulation involve posttranslational mechanisms. For example, phosphorylation of dCK at Ser-74 increases dCK activity (36). The DNA-damage response kinase Ataxia-telangiectasia mutated (ATM) has been proposed to catalyze this dCK phosphorylation (36–38). If the observed sensitivity of [18F]CFA PET to variations in dCK activity is confirmed by larger clinical studies, this noninvasive, real-time PET assay may provide a useful biomarker for various therapies that trigger T-cell activation, induce DNA damage (36), or rely on dCK-dependent nucleoside analog prodrugs. In particular, [18F]CFA may be useful as a pharmacokinetic PET stratification biomarker for its corresponding drug Clofarabine (Clolar; Genzyme) (39). Furthermore, as dCK inhibitors (5, 6, 25) advance toward clinical trials, [18F]CFA PET could provide a companion pharmacodynamic biomarker to help optimize dosing and scheduling regimes.
Given the susceptibility of [18F]CFA uptake to competition by endogenous nucleosides, the use of [18F]CFA in patients with elevated plasma dN levels may result in false-negative scans. Such conditions include the tumor lysis syndrome that follows chemotherapy in hematological malignancies (40), genetic defects in the purine nucleoside-catabolizing enzymes adenosine deaminase (ADA) and purine nucleoside phosphorylase (PNP) (41, 42), and treatment of certain leukemias with ADA and PNP inhibitors (43, 44). In addition to plasma dN levels, which should be determined in each patient scanned with [18F]CFA, the interpretation of [18F]CFA PET scans should also take into account factors other than dCK that could modulate probe accumulation. Both concentrative and equilibrative nucleoside transporters, as well as ATP-binding cassette (ABC) transporters, could all modulate [18F]CFA accumulation in tumors (45, 46).
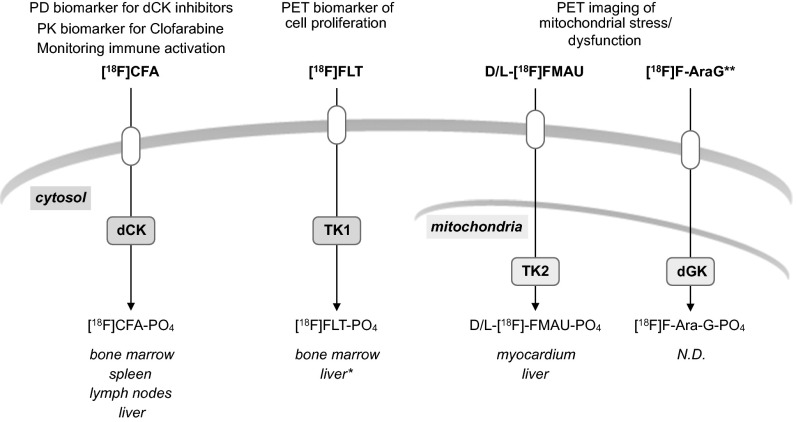
In summary, this work supports the evaluation of [18F]CFA in larger clinical studies as a companion biomarker for multiple therapeutic approaches. Moreover, [18F]CFA complements the toolbox of nucleoside analog PET probes for imaging dN kinases (Fig. 6). Given the diverse biological functions and the therapeutic relevance of cytosolic and mitochondrial dN kinases, the availability of a toolbox of PET imaging probes to noninvasively measure the activity of these enzymes could enable a wide range of preclinical and clinical applications.
Fig. 6.
The current toolbox of PET probes for nucleotide metabolism. Proposed matching of PET probes with deoxyribonucleoside salvage kinases. [18F]FLT, 3′-[18F]fluoro-3′ deoxythymidine (48); l-[18F]FMAU, 2′-deoxy-2′-[18F]fluoro-5-methyl-1-β-l-arabinofuranosyluracil (47, 49); d-[18F]FMAU, 2′-deoxy-2′-[18F]fluoro-5-methyl-1-β-d-arabinofuranosyluracil (50, 51). Potential applications for these probes, as well as anatomical sites of preferential accumulation in healthy volunteers, are indicated. *, [18F]FLT accumulation in the liver reflects probe glucuronidation (52). N.D., not determined; PD, pharmacodynamic; PK, pharmacokinetic. **, [18F]F-AraG uptake may also reflect dCK activity.
Materials and Methods
LC-MS/MS-MRM.
Details of LC-MS/MS-MRM analyses are provided in SI Materials and Methods.
Immunoblotting.
Immunoblotting was performed as previously described (4). Primary and secondary antibodies are provided in SI Materials and Methods.
Animal Studies.
Animal studies were conducted under the approval of the UCLA Animal Research Committee and were performed in accordance with the guidelines from the Division of Laboratory Animal Medicine at UCLA. For tumor xenograft experiments, 2 × 10⁶ CEM-EYFP and CEM-CDA were resuspended in 100 µL of a 50/50 (vol/vol) mixture of PBS and matrigel (BD Biosciences) for s.c. injections in the left and right shoulders of NSG mice.
Cell-Based Uptake Assays Using Radioactive Probes.
Uptake assays were conducted as previously described (47). See details in SI Materials and Methods.
MicroPET/CT and PET/CT Studies.
MicroPET/CT experiments were conducted as previously described (14). Briefly, prewarmed and anesthetized NSG mice were injected with indicated probes, and PET and CT images were acquired using the G8 PET/CT scanner (Sofie Biosciences) 3 h after the injection of 740 kBq of [18F]CFA. Clinical PET/CT studies were performed under a Radioactive Drug Research Committee protocol and under the approval from UCLA Institutional Review Boards as previously described (12). Briefly, 233.1 MBq of [18F]CFA was injected in the clinical subjects. For the healthy volunteer, dynamic imaging was performed immediately after the probe injection. For the paraganglioma patient, static imaging was performed 35 min after the probe injection.
Additional Information.
Additional experimental details are described in SI Materials and Methods.
SI Materials and Methods
Plasmids and Retrovirus Production.
The pMSCV-hCDA-IRES-EYFP plasmid was described previously (35). The pMSCV-hdGK-IRES-EYFP plasmid was generated by the insertion of the human dGK coding sequence, with the N-terminal mitochondrial localization sequence deleted (amino acids 1–50), into the multiple cloning site of the Murine Stem Cell Virus (MSCV)-IRES-EYFP plasmid as previously described (47). The pMSCV-hdCK-IRES-EYFP plasmid was generated as previously described (9). Amphotropic retroviruses were generated by transient cotransfection of the murine stem cell virus (MSCV) retroviral plasmid and pCL-10A1 packaging plasmid into Phoenix-Ampho packaging cells.
Cell Lines and Culture Conditions.
CCRF-CEM cells were obtained from the American Type Culture Collection. CEM-R cells were a gift from Dr. Margaret Black (Washington State University, Pullman, WA). CEM and CEM-R cells were grown in RPMI-1640 medium (Corning) supplemented with 10% (vol/vol) FBS (Omega Scientific) and 2 mM l-glutamine (Life Technologies). For radioactive probe uptake assays, RPMI-1640 medium supplemented with 10% (vol/vol) dialyzed FBS (Life Technologies) was used to minimize artifacts caused by deoxyribonucleosides present in regular FBS. To generate CEM-R-∆dGK, CEM-R-dCK, and CEM-CDA lines, parental cells underwent spinfection with the respective amphotropic retroviruses and were then sorted by flow cytometry to isolate pure populations of transduced cells.
Immunoblotting.
Immunoblotting was performed as previously described (4) using the primary antibodies anti-dCK (described in ref. 36), anti-dGK (HPA034766; Sigma-Aldrich), anti-Actin (Sigma-Aldrich), and anti-CDA (SAB1300716; Sigma-Aldrich), with the following secondary antibodies: anti-rabbit IgG, HRP-linked (7074; Cell Signaling Technology), and anti-mouse IgG, HRP-linked (7076; Cell Signaling Technology). Chemiluminescent substrates (34077 and 34095; ThermoFisher Scientific) and autoradiography film (Denville) were used for detection.
Radioactive Probe Uptake Assays.
Radioactive probe uptake assays were conducted as previously described (47). Briefly, 5 × 10⁵ CEM and CEM-R isogenic cells were resuspended in 1 mL of media per well in 12-well plates. After 1 h, cells were incubated with the indicated amounts of radioactive probes for an additional hour. Cells were then harvested and washed twice with ice-cold PBS. Radioactivity was measured using a beta-counter (Perkin-Elmer) for [3H]-labeled probes, and a gamma-counter (Packard) for [18F]-labeled probes. All [3H]-labeled probes used were purchased from Moravek Biochemicals.
Radiochemical Synthesis of [18F]-Labeled Probes.
The syntheses of [18F]CFA, [18F]F-AraG, and [18F]FDG were performed as previously described (14, 19, 53).
LC-MS/MS-MRM.
Stock solutions (10 mM) of 13C,15N- (13C10,15N5-dA; 13C10,15N5-dG; 13C9,15N3-dC; and 13C10,15N2-dT; Cambridge Isotope Laboratories) and 15N-labeled (15N5-dA, 15N5-dG, 15N3-dC, and 15N2-dT; Cambridge Isotope Laboratories) dNs were prepared individually in dimethyl sulfoxide (DMSO) and stored at −20 °C. Aliquots of the stock solutions of the 13C,15N-, and 15N-labeled dNs were separately pooled and diluted in methanol. Human plasma samples were obtained from Sigma-Aldrich and from healthy donors. Nonhuman primate (NHP) plasma samples were gifts from Dr. Andrew Pierce (AstraZeneca, Cambridge, UK). Whole blood samples from rodents were obtained by retro-orbital sinus bleed using hematocrit capillary tubes and were immediately centrifuged (2,000 × g, 15 min,) to isolate the plasma supernatant. To 20 µL of culture medium or plasma, a solution of 15N-labeled internal standards (IS) was added (60 µL, 20 nM of 15N-labeled dNs in methanol/DMSO, 100/0.0002, vol/vol). The mixture was vigorously mixed (30 s) and centrifuged (15,000 × g, 10 min, 4 °C), and then 60 µL of the supernatants was transferred into clean vials for LC-MS/MS-MRM analysis. With each batch of biological samples, a series of calibration standards were prepared by diluting the 10 mM solutions of 13C,15N-labeled dNs in either media or plasma from pooled untreated mice to give concentrations in the 10-nM to 10-µM range. To 20 µL of each of these samples, the same amount of IS was added. The calibration standards were processed simultaneously with, and identically to, the biological samples. Twenty microliters of each sample, equivalent to 5 µL of plasma or media, was injected onto a porous graphitic carbon column (2.1 × 100 mm, 5 µm, Hypercarb; Thermo-Scientific,) equilibrated in water/acetonitrile/formic acid, 95/5/0.2, and eluted (200 µL/min) with an increasing concentration of solvent B (acetonitrile/water/formic acid, 90/10/0.2, vol/vol/vol: % B/min/µL per min; 0/0/200, 0/5/200, 15/10/200, 15/20/200, 40/21/200, 50/25/200, 100/26/700, 100/30/700, 0/31/700, 0/34/700, 0/35/200). The effluent from the column was directed to an electrospray ion source (Agilent Jet Stream) connected to a triple quadrupole mass spectrometer (Agilent 6460) operating in the positive ion MRM mode. The intensities of ion transitions for the various isotopomers were recorded using previously optimized conditions [parent m/z (MH+)→fragment m/z were: dA, 252.1→136.1; 15N5-dA, 257.1→141.1; 13C10,15N5-dA, 267.1→146.1; dG, 268.1→152.1; 15N5-dG, 273.1→157.1; 13C10,15N5-dG, 283.1→162.1; dC, 228.1→112.1; 15N3-dC, 231.1→115.1; 13C9,15N3-dC, 240.1→119.1; dT, 243.1→127.1; 15N2-dT, 245.1→129.1; and 13C10,15N2-dT, 255.1→134.1]. Peak areas at the corresponding retention times were recorded using instrument manufacturer-supplied software. Data from the calibration standards were used to construct calibration curves for each dN (ordinate, peak area 13C10,15N5 dN/peak area of the corresponding IS; abscissa, molarity of 13C10,15N5 dN). The molarity of each unlabeled dN in each sample was calculated, after normalization to the corresponding internal standard, by interpolation from the corresponding calibration curve.
Statistical Analyses.
Data are presented as means ± SD. Statistical significance is determined by two-tailed t test. P values below 0.05 were considered significant.
Acknowledgments
We thank Larry Pang for assistance with PET/CT imaging studies, the UCLA Biomedical Cyclotron team for producing [18F]CFA and [18F]FDG, the Nuclear Medicine Clinic for assistance with the clinical study, and the Crump Institute for Molecular Imaging for producing [18F]F-AraG. We also thank Dr. Nagichettiar Satyamurthy for advice regarding the radiochemical synthesis of [18F]CFA. We acknowledge Dr. Andrew Pierce (AstraZeneca) for providing the nonhuman primate (NHP) plasma samples and Dr. Andreea Stuparu and Hank Wright for critical reading of the manuscript. T.M.L. was supported by the UCLA Scholars in Oncologic Molecular Imaging program (National Cancer Institute Award R25 CA098010). This work was funded by In Vivo Cellular and Molecular Imaging Center National Cancer Institute Award P50 CA086306 (to H.R.H.), National Cancer Institute Grant R01 CA187678 (to C.G.R.), US Department of Energy, Office of Science Award DE-SC0012353 (to J.C. and C.G.R.), and a Jonsson Comprehensive Cancer Center Foundation/UCLA Impact Grant (to C.G.R.).
Footnotes
Conflict of interest statement: C.G.R., O.N.W., M.E.P., and J.C. are cofounders of Sofie Biosciences (SB). They and the University of California (UC) hold equity in SB. C.G.R., O.N.W., and J.C. are among the inventors of [18F]CFA and analogs, which were patented by the UC and have been licensed to SB. UC has patented additional intellectual property for small molecule dCK inhibitors invented by C.G.R., J.C., A.L., S.P., and T.M.L. This intellectual property has been licensed by Trethera Corporation, in which C.G.R., J.C., O.N.W., and the UC hold equity.
This article contains supporting information online at www.pnas.org/lookup/suppl/doi:10.1073/pnas.1524212113/-/DCSupplemental.
References
- 1.Reichard P. Interactions between deoxyribonucleotide and DNA synthesis. Annu Rev Biochem. 1988;57:349–374. doi: 10.1146/annurev.bi.57.070188.002025. [DOI] [PubMed] [Google Scholar]
- 2.Sabini E, Hazra S, Ort S, Konrad M, Lavie A. Structural basis for substrate promiscuity of dCK. J Mol Biol. 2008;378(3):607–621. doi: 10.1016/j.jmb.2008.02.061. [DOI] [PMC free article] [PubMed] [Google Scholar]
- 3.Toy G, et al. Requirement for deoxycytidine kinase in T and B lymphocyte development. Proc Natl Acad Sci USA. 2010;107(12):5551–5556. doi: 10.1073/pnas.0913900107. [DOI] [PMC free article] [PubMed] [Google Scholar]
- 4.Austin WR, et al. Nucleoside salvage pathway kinases regulate hematopoiesis by linking nucleotide metabolism with replication stress. J Exp Med. 2012;209(12):2215–2228. doi: 10.1084/jem.20121061. [DOI] [PMC free article] [PubMed] [Google Scholar]
- 5.Murphy JM, et al. Development of new deoxycytidine kinase inhibitors and noninvasive in vivo evaluation using positron emission tomography. J Med Chem. 2013;56(17):6696–6708. doi: 10.1021/jm400457y. [DOI] [PMC free article] [PubMed] [Google Scholar]
- 6.Nathanson DA, et al. Co-targeting of convergent nucleotide biosynthetic pathways for leukemia eradication. J Exp Med. 2014;211(3):473–486. doi: 10.1084/jem.20131738. [DOI] [PMC free article] [PubMed] [Google Scholar]
- 7.Jordheim L, Galmarini CM, Dumontet C. Drug resistance to cytotoxic nucleoside analogues. Curr Drug Targets. 2003;4(6):443–460. doi: 10.2174/1389450033490957. [DOI] [PubMed] [Google Scholar]
- 8.Radu CG, et al. Molecular imaging of lymphoid organs and immune activation by positron emission tomography with a new [18F]-labeled 2′-deoxycytidine analog. Nat Med. 2008;14(7):783–788. doi: 10.1038/nm1724. [DOI] [PMC free article] [PubMed] [Google Scholar]
- 9.Laing RE, et al. Noninvasive prediction of tumor responses to gemcitabine using positron emission tomography. Proc Natl Acad Sci USA. 2009;106(8):2847–2852. doi: 10.1073/pnas.0812890106. [DOI] [PMC free article] [PubMed] [Google Scholar]
- 10.Brewer S, et al. Epithelial uptake of [18F]1-(2′-deoxy-2′-arabinofuranosyl) cytosine indicates intestinal inflammation in mice. Gastroenterology. 2010;138(4):1266–1275. doi: 10.1053/j.gastro.2010.01.003. [DOI] [PMC free article] [PubMed] [Google Scholar]
- 11.Nair-Gill E, et al. PET probes for distinct metabolic pathways have different cell specificities during immune responses in mice. J Clin Invest. 2010;120(6):2005–2015. doi: 10.1172/JCI41250. [DOI] [PMC free article] [PubMed] [Google Scholar]
- 12.Schwarzenberg J, et al. Human biodistribution and radiation dosimetry of novel PET probes targeting the deoxyribonucleoside salvage pathway. Eur J Nucl Med Mol Imaging. 2011;38(4):711–721. doi: 10.1007/s00259-010-1666-z. [DOI] [PMC free article] [PubMed] [Google Scholar]
- 13.Ho DH. Distribution of kinase and deaminase of 1-beta-D-arabinofuranosylcytosine in tissues of man and mouse. Cancer Res. 1973;33(11):2816–2820. [PubMed] [Google Scholar]
- 14.Shu CJ, et al. Novel PET probes specific for deoxycytidine kinase. J Nucl Med. 2010;51(7):1092–1098. doi: 10.2967/jnumed.109.073361. [DOI] [PMC free article] [PubMed] [Google Scholar]
- 15.Mosessian S, et al. INDs for PET molecular imaging probes-approach by an academic institution. Mol Imaging Biol. 2014;16(4):441–448. doi: 10.1007/s11307-014-0735-2. [DOI] [PMC free article] [PubMed] [Google Scholar]
- 16.Verri A, Priori G, Spadari S, Tondelli L, Focher F. Relaxed enantioselectivity of human mitochondrial thymidine kinase and chemotherapeutic uses of L-nucleoside analogues. Biochem J. 1997;328(Pt 1):317–320. doi: 10.1042/bj3280317. [DOI] [PMC free article] [PubMed] [Google Scholar]
- 17.Kamath VG, Hsiung CH, Lizenby ZJ, McKee EE. Heart mitochondrial TTP synthesis and the compartmentalization of TMP. J Biol Chem. 2015;290(4):2034–2041. doi: 10.1074/jbc.M114.624213. [DOI] [PMC free article] [PubMed] [Google Scholar]
- 18.Arnér ES, Eriksson S. Mammalian deoxyribonucleoside kinases. Pharmacol Ther. 1995;67(2):155–186. doi: 10.1016/0163-7258(95)00015-9. [DOI] [PubMed] [Google Scholar]
- 19.Namavari M, et al. Synthesis of 2′-deoxy-2′-[18F]fluoro-9-β-D-arabinofuranosylguanine: A novel agent for imaging T-cell activation with PET. Mol Imaging Biol. 2011;13(5):812–818. doi: 10.1007/s11307-010-0414-x. [DOI] [PubMed] [Google Scholar]
- 20.Jüllig M, Eriksson S. Mitochondrial and submitochondrial localization of human deoxyguanosine kinase. Eur J Biochem. 2000;267(17):5466–5472. doi: 10.1046/j.1432-1327.2000.01607.x. [DOI] [PubMed] [Google Scholar]
- 21.Gower WRJ, Jr, Carr MC, Ives DH. Deoxyguanosine kinase: Distinct molecular forms in mitochondria and cytosol. J Biol Chem. 1979;254(7):2180–2183. [PubMed] [Google Scholar]
- 22.Eriksson S, et al. Properties and levels of deoxynucleoside kinases in normal and tumor cells: Implications for chemotherapy. Adv Enzyme Regul. 1994;34:13–25. doi: 10.1016/0065-2571(94)90006-x. [DOI] [PubMed] [Google Scholar]
- 23.Lotfi K, et al. The pattern of deoxycytidine- and deoxyguanosine kinase activity in relation to messenger RNA expression in blood cells from untreated patients with B-cell chronic lymphocytic leukemia. Biochem Pharmacol. 2006;71(6):882–890. doi: 10.1016/j.bcp.2005.12.007. [DOI] [PubMed] [Google Scholar]
- 24.Owens JK, Shewach DS, Ullman B, Mitchell BS. Resistance to 1-beta-D-arabinofuranosylcytosine in human T-lymphoblasts mediated by mutations within the deoxycytidine kinase gene. Cancer Res. 1992;52(9):2389–2393. [PubMed] [Google Scholar]
- 25.Nomme J, et al. Structure-guided development of deoxycytidine kinase inhibitors with nanomolar affinity and improved metabolic stability. J Med Chem. 2014;57(22):9480–9494. doi: 10.1021/jm501124j. [DOI] [PMC free article] [PubMed] [Google Scholar]
- 26.Dandekar M, Tseng JR, Gambhir SS. Reproducibility of 18F-FDG microPET studies in mouse tumor xenografts. J Nucl Med. 2007;48(4):602–607. doi: 10.2967/jnumed.106.036608. [DOI] [PMC free article] [PubMed] [Google Scholar]
- 27.Tseng JR, et al. Reproducibility of 3′-deoxy-3′-(18)F-fluorothymidine microPET studies in tumor xenografts in mice. J Nucl Med. 2005;46(11):1851–1857. [PMC free article] [PubMed] [Google Scholar]
- 28.Plotnik DA, Emerick LE, Krohn KA, Unadkat JD, Schwartz JL. Different modes of transport for 3H-thymidine, 3H-FLT, and 3H-FMAU in proliferating and nonproliferating human tumor cells. J Nucl Med. 2010;51(9):1464–1471. doi: 10.2967/jnumed.110.076794. [DOI] [PMC free article] [PubMed] [Google Scholar]
- 29.Adams A, Harkness RA. Adenosine deaminase activity in thymus and other human tissues. Clin Exp Immunol. 1976;26(3):647–649. [PMC free article] [PubMed] [Google Scholar]
- 30.Markert ML. Purine nucleoside phosphorylase deficiency. Immunodefic Rev. 1991;3(1):45–81. [PubMed] [Google Scholar]
- 31.Nottebrock H, Then R. Thymidine concentrations in serum and urine of different animal species and man. Biochem Pharmacol. 1977;26(22):2175–2179. doi: 10.1016/0006-2952(77)90271-4. [DOI] [PubMed] [Google Scholar]
- 32.van Waarde A, et al. Selectivity of 18F-FLT and 18F-FDG for differentiating tumor from inflammation in a rodent model. J Nucl Med. 2004;45(4):695–700. [PubMed] [Google Scholar]
- 33.Cooper GM, Greer S. The effect of inhibition of cytidine deaminase by tetrahydrouridine on the utilization of deoxycytidine and 5-bromodeoxycytidine for deoxyribonucleic acid synthesis. Mol Pharmacol. 1973;9(6):698–703. [PubMed] [Google Scholar]
- 34.Zhenchuk A, Lotfi K, Juliusson G, Albertioni F. Mechanisms of anti-cancer action and pharmacology of clofarabine. Biochem Pharmacol. 2009;78(11):1351–1359. doi: 10.1016/j.bcp.2009.06.094. [DOI] [PubMed] [Google Scholar]
- 35.Lee JT, Campbell DO, Satyamurthy N, Czernin J, Radu CG. Stratification of nucleoside analog chemotherapy using 1-(2′-deoxy-2′-18F-fluoro-β-D-arabinofuranosyl)cytosine and 1-(2′-deoxy-2′-18F-fluoro-β-L-arabinofuranosyl)-5-methylcytosine PET. J Nucl Med. 2012;53(2):275–280. doi: 10.2967/jnumed.111.090407. [DOI] [PMC free article] [PubMed] [Google Scholar]
- 36.Bunimovich YL, et al. Deoxycytidine kinase augments ATM-Mediated DNA repair and contributes to radiation resistance. PLoS One. 2014;9(8):e104125. doi: 10.1371/journal.pone.0104125. [DOI] [PMC free article] [PubMed] [Google Scholar]
- 37.Matsuoka S, et al. ATM and ATR substrate analysis reveals extensive protein networks responsive to DNA damage. Science. 2007;316(5828):1160–1166. doi: 10.1126/science.1140321. [DOI] [PubMed] [Google Scholar]
- 38.Yang C, et al. Deoxycytidine kinase regulates the G2/M checkpoint through interaction with cyclin-dependent kinase 1 in response to DNA damage. Nucleic Acids Res. 2012;40(19):9621–9632. doi: 10.1093/nar/gks707. [DOI] [PMC free article] [PubMed] [Google Scholar]
- 39.Pui CH, Jeha S, Kirkpatrick P. Clofarabine. Nat Rev Drug Discov. 2005;4(5):369–370. doi: 10.1038/nrd1724. [DOI] [PubMed] [Google Scholar]
- 40.Cohen JD, Strock DJ, Teik JE, Katz TB, Marcel PD. Deoxycytidine in human plasma: Potential for protecting leukemic cells during chemotherapy. Cancer Lett. 1997;116(2):167–175. doi: 10.1016/s0304-3835(97)00185-7. [DOI] [PubMed] [Google Scholar]
- 41.Osborne WR, et al. Purine nucleoside phosphorylase deficiency: Evidence for molecular heterogeneity in two families with enzyme-deficient members. J Clin Invest. 1977;60(3):741–746. doi: 10.1172/JCI108826. [DOI] [PMC free article] [PubMed] [Google Scholar]
- 42.Hirschhorn R, Roegner V, Rubinstein A, Papageorgiou P. Plasma deoxyadenosine, adenosine, and erythrocyte deoxyATP are elevated at birth in an adenosine deaminase-deficient child. J Clin Invest. 1980;65(3):768–771. doi: 10.1172/JCI109725. [DOI] [PMC free article] [PubMed] [Google Scholar]
- 43.Venner PM, et al. Levels of 2′-deoxycoformycin, adenosine, and deoxyadenosine in patients with acute lymphoblastic leukemia. Cancer Res. 1981;41(11 Pt 1):4508–4511. [PubMed] [Google Scholar]
- 44.Mitchell BS, Edwards NL, Koller CA. Deoxyribonucleoside triphosphate accumulation by leukemic cells. Blood. 1983;62(2):419–424. [PubMed] [Google Scholar]
- 45.King KM, et al. A comparison of the transportability, and its role in cytotoxicity, of clofarabine, cladribine, and fludarabine by recombinant human nucleoside transporters produced in three model expression systems. Mol Pharmacol. 2006;69(1):346–353. doi: 10.1124/mol.105.015768. [DOI] [PubMed] [Google Scholar]
- 46.Fukuda Y, Schuetz JD. ABC transporters and their role in nucleoside and nucleotide drug resistance. Biochem Pharmacol. 2012;83(8):1073–1083. doi: 10.1016/j.bcp.2011.12.042. [DOI] [PMC free article] [PubMed] [Google Scholar]
- 47.Campbell DO, et al. Structure-guided engineering of human thymidine kinase 2 as a positron emission tomography reporter gene for enhanced phosphorylation of non-natural thymidine analog reporter probe. J Biol Chem. 2012;287(1):446–454. doi: 10.1074/jbc.M111.314666. [DOI] [PMC free article] [PubMed] [Google Scholar]
- 48.Shields AF, et al. Imaging proliferation in vivo with [F-18]FLT and positron emission tomography. Nat Med. 1998;4(11):1334–1336. doi: 10.1038/3337. [DOI] [PubMed] [Google Scholar]
- 49.Mukhopadhyay U, Pal A, Gelovani JG, Bornmann W, Alauddin MM. Radiosynthesis of 2′-deoxy-2′-[18F]-fluoro-5-methyl-1-beta-L-arabinofuranosyluracil ([18F]-L-FMAU) for PET. Appl Radiat Isot. 2007;65(8):941–946. doi: 10.1016/j.apradiso.2007.04.003. [DOI] [PubMed] [Google Scholar]
- 50.Alauddin MM, Shahinian A, Gordon EM, Conti PS. Evaluation of 2′-deoxy-2′-flouro-5-methyl-1-beta-D-arabinofuranosyluracil as a potential gene imaging agent for HSV-tk expression in vivo. Mol Imaging. 2002;1(2):74–81. doi: 10.1162/15353500200202100. [DOI] [PubMed] [Google Scholar]
- 51.Tehrani OS, Douglas KA, Lawhorn-Crews JM, Shields AF. Tracking cellular stress with labeled FMAU reflects changes in mitochondrial TK2. Eur J Nucl Med Mol Imaging. 2008;35(8):1480–1488. doi: 10.1007/s00259-008-0738-9. [DOI] [PMC free article] [PubMed] [Google Scholar]
- 52.Shields AF. PET imaging with 18F-FLT and thymidine analogs: promise and pitfalls. J Nucl Med. 2003;44(9):1432–1434. [PubMed] [Google Scholar]
- 53.Hamacher K, Coenen HH, Stöcklin G. Efficient stereospecific synthesis of no-carrier-added 2-[18F]-fluoro-2-deoxy-D-glucose using aminopolyether supported nucleophilic substitution. J Nucl Med. 1986;27(2):235–238. [PubMed] [Google Scholar]


