

Abstract
BRAF and KRAS genes are known to play a similar role in the activation of RAS-RAF-MEK-ERK signaling pathway in colorectal tumorigenesis. However, BRAF-mutated colorectal cancers (CRCs) have distinct clinicopathologic characteristics different from those of the KRAS mutated ones as in comparison the BRAF-mutated CRCs are associated with a much worse prognosis for the afflicted patients. This study aimed to determine the different miRNA expression signatures associated with BRAF-mutated CRCs in comparison to KRAS-mutated ones, and to identify the specific miRNAs possibly mediating the aggressive phenotype of the BRAF-mutated CRCs.
We screened 535 formalin-fixed paraffin-embedded CRC tissue samples for the BRAF V600E mutation, and selected 7 BRAF-mutated and 7 KRAS-mutated CRCs that were tumor size, stage, and microsatellite status-matched. Affymetrix GeneChip® miRNA 4.0 Array was used for detection of miRNA expression differences in the selected samples. We validated the array results by quantitative reverse transcription polymerase chain reaction (qRT-PCR) for selected miRNAs.
A total of 10 differentially expressed (DE) miRNAs associated with BRAF-mutated CRCs were obtained, including miR-31-5p, miR-877-5p, miR-362-5p, and miR-425-3p. miR-31-5p showed the highest fold change (8.3-fold) among all of the miRNAs analyzed. From the analyses of GO biological processes, the DE-miRNAs were functionally relevant to cellular proliferation such as positive regulation of gene expression (P = 1.26 × 10⁻¹⁰), transcription (P = 9.70 × 10⁻¹⁰), and RNA metabolic process (P = 1.97 × 10⁻⁹). Bioinformatics analysis showed that the DE-miRNAs were significantly enriched in cancer-associated pathways including neutrophin signaling (P = 6.84 × 10⁻⁵), pathways in cancer (P = 0.0016), Wnt signaling (P = 0.0027), and MAPK signaling pathway (P = 0.0036).
Our results suggest that the DE-miRNAs in BRAF-mutated CRCs in comparison to KRAS-mutated CRCs are implicated in the aggressive phenotype of the BRAF-mutated CRCs. Further experimental validation is required to confirm these results.
INTRODUCTION
Colorectal cancer (CRC) is the third most common cancer and the fourth for cancer-related deaths in the world population.1 Despite recent multimodal treatments including radical resection with adjuvant chemoradiation therapy, the prognosis of the patients with metastatic disease has not improved greatly and the 5-year survival is less than 15%.2 Recent targeted therapy, especially with antiepidermal growth factor receptor (anti-EGFR) antibodies may have significant therapeutic value, but only 10% to 20% of the patients with metastatic CRC benefit from such therapy.3 Currently, resistance to the EGFR-targeted monoclonal antibodies is largely ascribed to the KRAS mutations,4 and BRAF (V600E) mutation is also considered to be predictive of a negative response to EGFR inhibitors.5,6 As such, patients with CRCs harboring wild-type KRAS and BRAF are considered optimal candidates for EGFR therapies, and this categorization is thought to improve outcome and minimize unnecessary toxicity and cost for this subset of CRC patients.
KRAS mutations occur in about 35% to 45% of CRCs.7,8 The mutation of BRAF, kinase located downstream of KRAS in the EGFR signal transduction pathway, is found in about 10% to 15 % of CRCs in the Western countries.9,10 The prevalence of BRAF mutation is much less in Asian countries, with only about 5% of the CRC cases.11,12 It is known that KRAS and BRAF gene mutations mostly occur in a mutually exclusive pattern, which has been interpreted as representing the functional redundancy of each mutation.13 Although both KRAS and BRAF genes are known to play a common role in the activation of RAS-RAF-MEK-ERK signaling pathway in colorectal tumorigenesis, unlike KRAS-mutated CRCs, BRAF-mutated ones have distinct clinicopathologic characteristics: they are tightly associated with the right-side colon, mucinous histology, CpG island methylator phenotype (CIMP), and/or microsatellite instability (MSI).9,10,14 More importantly, the BRAF mutation has been clearly associated with a poor prognosis.10,14 On the other hand, recent prospective trials demonstrated that KRAS mutation is not a prognostic marker for patients treated with adjuvant 5-FU-based chemotherapy.15,16 However, the reasons for these different clinicopathologic features of KRAS- and BRAF-mutated CRCs are largely unknown.
MicroRNAs (miRNAs), noncoding 18- to 25-nucleotide, are involved in various physiological processes through regulating the translation of genes.17 Altered miRNA expression levels and their significances in tumor initiation and progression have been reported in various human malignancies.18,19 Gene expression profiling studies have revealed that miRNA expression is an excellent biomarker associated with specific tumor subtypes and clinical outcomes.20,21 In CRCs, certain miRNAs such as miR-31 and miR-150 have been implicated in cancer development and progression.22–24 However, our understanding is limited on the different miRNA expression profiles of BRAF-mutated CRCs in comparison to KRAS-mutated CRCs. Previous studies investigated miRNA expression profiles only according to the KRAS or BRAF mutational status,25,26 and they did not consider other factors including rare cases of having both KRAS and BRAF mutations, histological subtypes, and MSI status of the tumors. Therefore, we aimed to determine the miRNA expression signatures associated with BRAF-mutated CRCs in comparison to KRAS-mutated ones, in order to identify specific miRNAs that may be indicative of the aggressive phenotype of BRAF-mutated CRCs.
MATERIALS AND METHODS
Patients and Tissue Samples
Five hundred eighty-three CRC patients who underwent curative surgery at Ajou University Hospital (Suwon, Republic of Korea) from October 2011 to April 2014 were initially considered for the study. After exclusion of 48 CRC patients with those having received neoadjuvant chemo- and/or radiotherapy (n = 28), having multiple occurrences (n = 17), and those with familiar adenomatous polyposis (n = 3), a total of 535 CRC patients were enrolled for the further analysis. Corresponding formalin-fixed paraffin-embedded (FFPE) tissues for each patient was retrieved from the tumor registry. Clinicopathologic characteristics including age, gender, tumor size, tumor location, and TNM stage were obtained from electronic medical records. Tumor locations proximal to the splenic flexure were designated as “proximal,” and those located distal to the splenic flexure were labeled as “distal” for further analysis. Two gastrointestinal pathologists (YBK and DL) without background knowledge of the tissue samples performed microscopic characterization of the samples as tumor histology and differentiation. TNM stages were adjusted according to the AJCC 7th edition.27 This study was carried out in accordance with the code of ethics of the World Medical Association (Declaration of Helsinki), and was approved by the Institutional Review Board (IRB) of Ajou University Hospital.
Genomic DNA Extraction
All the slides of the cases included in this study were reviewed, and the representative tumor blocks were selected for each case. Areas of the representative tumor were marked, and only the tumor tissue was gathered from 10-μm thick sections of FFPE tissues by macrodissection. Genomic DNA was extracted from this tumor tissue using the ReliaPrep™ FFPE gDNA Miniprep system (Promega, Madison, WI). The concentration and purity of the extracted DNA were determined by a NanoDrop ND-1000 spectrophotometer (Thermo Fisher Scientific, Wilmington, DE). The extracted DNA was stored at −20°C until use.
Direct Sequencing for BRAF Mutation
The mutational analysis of BRAF exon 15 was performed by bidirectional sequencing of PCR fragments amplified from genomic DNA. PCR primers sequences and cycling conditions were as follows: exon 15 forward primer 5′-TGCTTGCTCTGATAGGAAAATG-3′; reverse primer 5′-TGATGGGACCCACTCCAT-3′; initial denaturation at 94°C for 15 minutes, followed by 40 cycles at 94°C for 30 seconds, 58°C for 30 seconds, and 72°C for 30 seconds and 1 cycle at 72°C for 5 minutes. After the amplified products were purified, direct DNA sequencing was performed using the Applied Biosystems 3500XL Genetic Analyzer with GeneMapper Software version 4.1 (Applied Biosystems, Life Technologies, Carlsbad, CA).
PNA Clamping Real-Time PCR for KRAS Mutation
The PNA Clamp KRAS Mutation Detection kit (PANAGENE, Daejeon, Korea) was used to detect KRAS mutations in codon 12 and 13 by real-time PCR according to the manufacturer's instructions, as previously described.28 Finally, ΔCt values were calculated as follows: ΔCt1 = [standard Ct]−[sample Ct], and ΔCt2 = [sample Ct]−[non-PNA mix Ct]. A higher ΔCt value meant that the mutant was efficiently amplified. A cut-off value of 2.0 was used to determine the presence of mutant DNA.
Analysis for MSI
MSI analysis was performed with 5 microsatellite markers of the Bethesda consensus panel (D2S123, S17S250, D5S346, BAT25, and BAT26) as described previously.29 From the National Cancer Institute recommendations, the tumors with instability at 2 or more microsatellite loci were defined as MSI-high (MSI-H), while the remaining cases were classified as microsatellite stable (MSS).
RNA Extraction and Quality Check
The miRNeasy FFPE Mini Kit (Qiagen, Valencia, CA) was used to extract total RNA, including miRNA, according to the manufacturer's instruction. The NanoDrop ND-1000 Spectrophotometer (Thermo Fisher Scientific) allowed quantification of RNA. For the quality control, RNA purity and integrity were evaluated by the OD 260/280 ratio, and analyzed by Agilent 2100 Bioanalyzer (Agilent Technologies, Palo Alto, CA).
Affymetrix miRNA Array Methods
The Affymetrix Genechip miRNA array processing was performed according to the manufacturer's protocol. RNA samples at 1 μg were labeled with the FlashTag Biotin RNA Labeling Kit (Genisphere, Hatfield, PA). The labeled RNA was quantified, fractionated, and hybridized to the miRNA microarray according to the standard procedures provided by the manufacturer. The labeled RNA was heated to 99°C for 5 minutes and then incubated at 45°C for 5 minutes. RNA-array hybridization was performed with agitation at 60 rotations per minute for 16 to 18 hours at 48°C on an Affymetrix 450 Fluidics Station (Affymetrix, Santa Clara, CA). The chips were washed and stained using a Genechip Fluidics Station 450 (Affymetrix). The chips were then scanned with an Affymetrix GeneChip Scanner 3000 (Affymetrix). Signal values were computed using the Affymetrix GeneChip Command Console software (Affymetrix).
Raw Data Preparation and Statistic Analysis
Raw data were extracted automatically in Affymetrix data extraction protocol using the software provided by Affymetrix GeneChip Command Console Software (AGCC) (Affymetrix). The CEL files import, miRNA level RMA + DABG-All analysis and result export using Affymetrix Expression Console Software. Array data were filtered by probes annotated species. The comparative analysis between test sample and control sample was carried out using fold-change and independent T test in which the null hypothesis was that no difference existed between the 2 groups. The miRNAs not detected in any samples were excluded from analysis. miRNAs not expressed completely in either group were also excluded. Significance of differential expression between two groups was estimated by t test for those miRNAs of at least a 1.5-fold reduced or increased mean expression between the 2 groups. All statistical tests of differentially expressed (DE) genes were conducted using the R statistical language v. 3.2.2. of the software.
Validation of Microarray Results by Quantitative Reverse Transcription Polymerase Chain Reaction (qRT-PCR)
Microarray expression results of the selected miRNAs including miR-31-5p, miR-362-5p, miR-425-3p, and miR-155-5p were verified by qRT-PCR. miR-155-5p was used as a negative control. Tissue RNA (1 μg) containing miRNA was polyadenylated with ATP by E. coli poly(A)polymerase (NEB) at 37°C for 30 minutes, before reveres transcription. Poly(A) tailed RNA (200 ng) was reverse transcribed to cDNA using PrimeScript Reverse transcriptase (Takara, Otsu, Japan) with oligo-dT adapter primer 5′-GCGAGCACAGAATTAATACGACTCACTATAGGTTTTTTTTTTTT-3′. qRT-PCR was performed using RealHelix qPCR kit (Nanohelix) on CFX96 Touch Real time Detection System (Bio-Rad, Hercules, CA). The following primers were used in combination with the universal primer: U6, 5′-CTCGCTTCGGCAGCACA-3′; hsa-miR-31-5p, 5′-GCAGAGGCAAGATGCTG-3′; hsa-miR-362-5p, 5′-CGCAGAATCCTTGGAACCT-3′; hsa-miR-425-3p, 5′-AGATCGGGAATGTCGTGT-3′; hsa-miR-155-5p, 5′-TTAATGCTAATCGTGATAGGG-3′. Each sample was run in triplicates and the expression levels of miRNAs were normalized to an endogenous control RNU6B (U6). The relative expression levels of miRNAs were calculated by a comparative threshold cycle (Ct) method using the formula: 2−[ΔCt(cancer) − ΔCt(normal colon)].
Selection of High-Confidence miRNA Targets
To obtain high-confidence target genes of DE miRNAs, we combined target information from the most recent versions of four public databases (miRanda, TargetScan, miRDB, and TARBASE), applying cutoff of −0.1, −0.3, 60, and 0.8, respectively as suggested previously.30–32 All the targets from TARBASE were considered high-confidence ones because they were experimentally validated. For the computationally predicted targets from the other 3 databases, only the targets predicted by at least 2 databases were considered to be high confidence ones.
Gene Ontology and KEGG Pathway Enrichment Analysis
To estimate the functions of DE miRNAs, we performed gene ontology (GO) and Kyoto Encyclopedia of Genes and Genomes (KEGG) pathway enrichment analysis using DAVID web application (https://david.ncifcrf.gov). High-confidence targets were provided as an input to this tool. Internally, DAVID performs Fisher exact test to decide whether an input gene set is enriched for a specific gene set of GO terms or KEGG pathways compared to the background information. Only gene sets with P < 0.05 were considered significant when the false discovery rate (FDR) was less than 0.01 (for GO terms) or 0.2 (for KEGG pathway). Fold enrichment (FE) was used to estimate the enrichment degree of a given pathway, which is defined as follows:
 |
where m denotes the number of “hits” (mapped genes) in the pathway, M denotes the number of genes in the pathway, n denotes the number of “hits” in the background, and N denotes the number of total genes in the background. High score indicates more target genes in the corresponding pathway.
RESULTS
Selection of the Tumor Samples
Of the 535 patients initially enrolled in this study, we detected BRAFV600E mutation in only 15 cases (2.8%). For strict comparative analysis matching histology and genetic alterations, the following BRAF-mutated cases were excluded from further analysis: 2 cases of mucinous adenocarcinomas with low tumor content, 2 early stage (T stage 1) small tumors arising from tubular adenoma, 3 cases with MSI-H, and 1 case with KRAS mutation. After exclusion of these 8 cases, the remaining 7 cases of BRAF-mutated CRCs were enrolled for the miRNA array analysis. For comparison, we selected another 7 tumors with MSS, T stage 2 and more, presence of KRAS mutation, and no BRAFV600E mutation. The clinicopathologic characteristics of these 14 cases finally enrolled in this study are summarized in Table 1.
TABLE 1.
The Clinicopathologic Characteristics of 14 Patients With CRCs Either With BRAF or KRAS Mutation

miRNA Expression Profiles of BRAF-Mutated CRCs in Comparison With KRAS-Mutated CRCs
The whole miRNA expression patterns in between BRAF-mutated and KRAS-mutated CRCs are shown in Figure 1. Comparative analysis of miRNA profiles between BRAF-mutated versus KRAS-mutated CRCs revealed a total of 31 DE-miRNAs. Unsupervised hierarchical clustering analysis demonstrated tumor clustering according to the BRAF mutational status (Figure 2). Among these miRNAs, only probesets corresponding to mature forms of miRNAs expressed in humans were selected for further analyses. Finally, we obtained a list of 10 miRNAs, which were significantly over- or underexpressed in BRAF-mutated cancers (Table 2). Among these, miR-31-5p, miR-877-5p, and miR-1237-5p were significantly up-regulated. On the other hand, let-7f-1-3p, miR-362-5p, miR-425-3p, miR-500a-5p, miR-532-5p, miR-660-5p, and miR-1825 were significantly downregulated in BRAF-mutated cancers. miR-532-5p had the highest fold change (−2.326-fold) among the downregulated miRNAs, while miR-31-5p showed the highest fold change of 8.331 among all of these significantly altered miRNAs.
FIGURE 1.
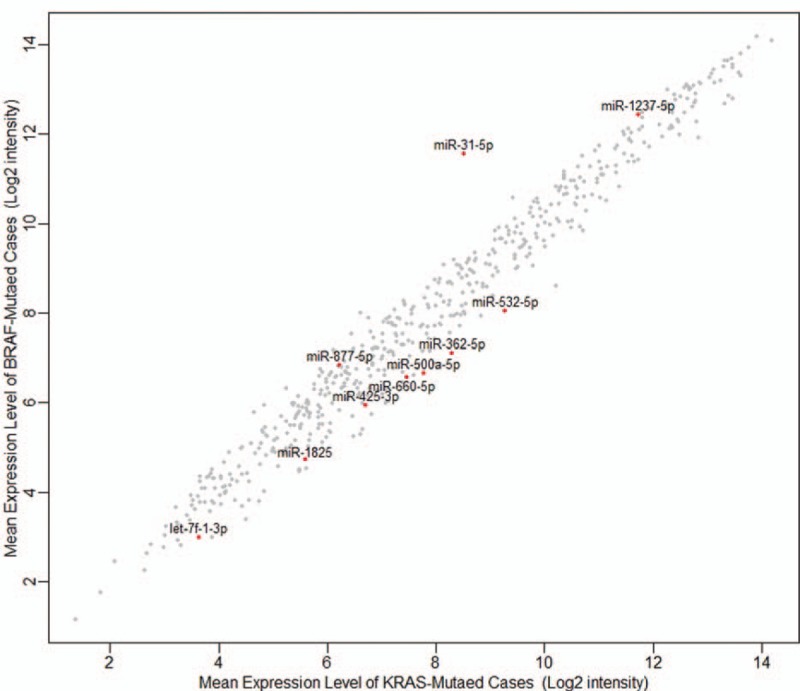
Scatter plot for the microRNA expression between BRAF-mutated and KRAS-mutated colorectal cancers.
FIGURE 2.
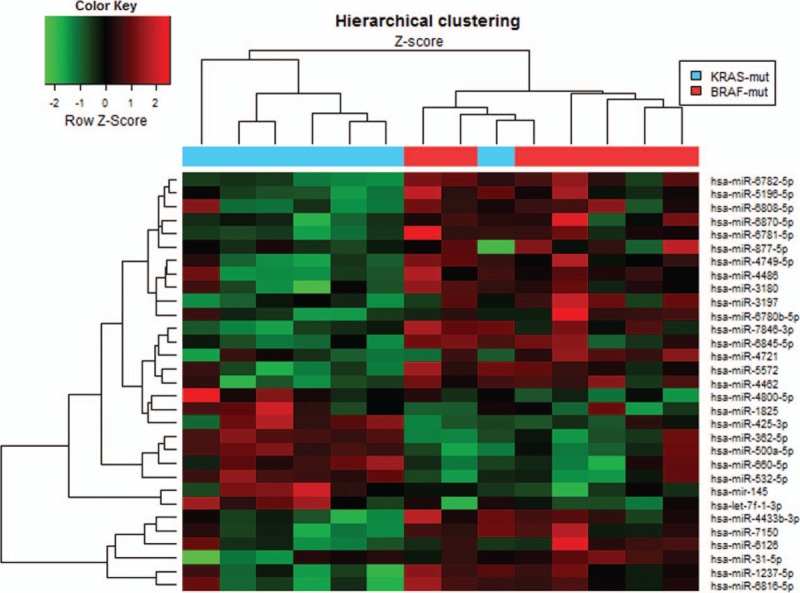
Unsupervised hierarchical clustering using differentially expressed miRNAs in BRAF-mutated versus KRAS-mutated colorectal cancers.
TABLE 2.
Significantly Altered miRNAs in BRAF-Mutated Compared With KRAS-Mutated CRCs by miRNA Array Analysis

Validation of the miRNA Expression Profile by qRT-PCR
The differential expression detected by microarray analysis was evaluated by qRT-PCR for 3 selected miRNAs (Figure 3). This experiment additionally included 14 cases of normal colon epithelium (NCE). In accordance with the array results, we observed significantly higher expression of miR-31-5p (P = 0.008) and significantly lower expression of miR-362-5p (P < 0.001) and miR-425-3p (P = 0.001) in BRAF-mutated CRCs in comparison to KRAS-mutated CRCs. We used miR-155-5p as a negative control since its expression level was similar in both groups by microarray, and we reached substantially the same results by qRT-PCR.
FIGURE 3.
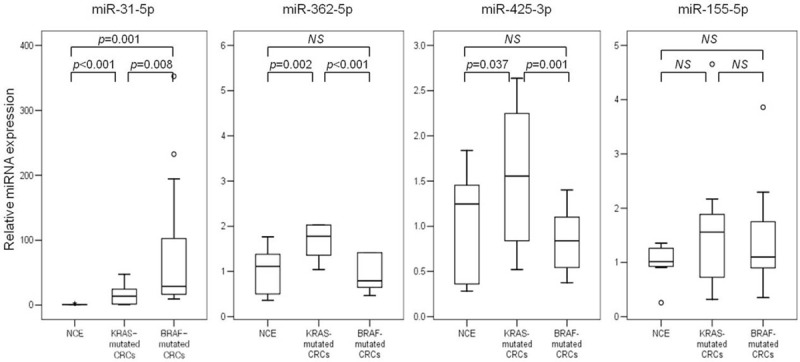
Box plots for the expression of selected microRNAs using quantitative reverse transcription polymerase chain reaction (qRT-PCR). CRC = colorectal cancers; NCE = normal colon epithelium.
miRNA Targets and Relevant Biological Pathways
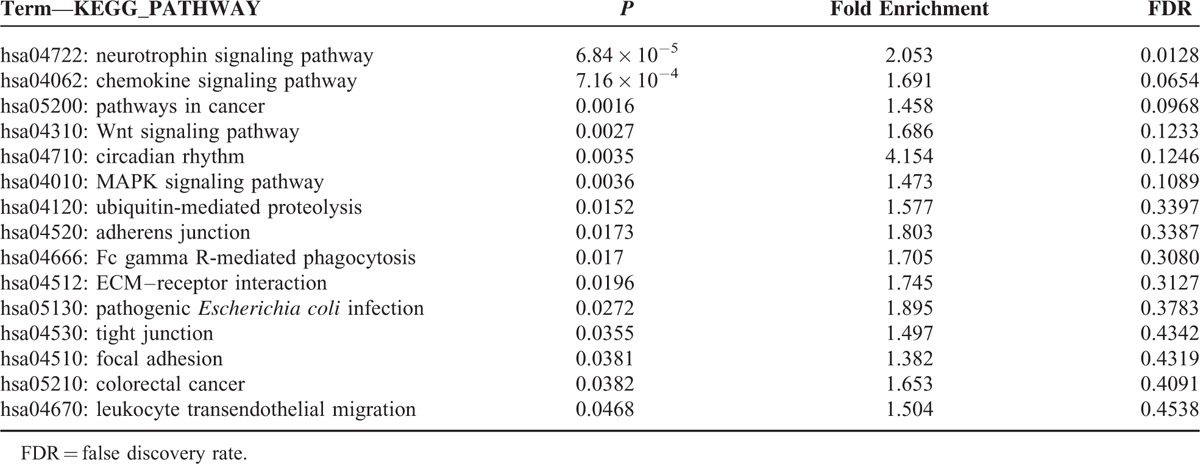
A total of 2408 target genes were predicted for the 10 miRNAs, and the network of miRNA-target genes was constructed (Supplementary Figure 1). When GO enrichment analysis were performed using DAVID, 41 GO terms were significantly enriched (P < 0.05), and 19 terms retained statistical significance by the Benjamini–Hochberg algorithm (FDR < 0.01). These 19 functional terms are summarized in Table 3. Our data revealed that functions relevant to cellular proliferation such as positive regulation of gene expression (FDR = 5.00 × 10⁻⁷), transcription (FDR = 5.34 × 10⁻⁷), and RNA metabolic process (FDR = 1.31 × 10⁻⁶) were distinctively associated. Further analyses of predicted target mRNAs of the DE-miRNAs revealed that 6 biologic pathways were significantly enriched (FDR < 0.2) in BRAF-mutated cancers in comparison to KRAS-mutated cancers (Table 4). These encompassed the well-known cancer-associated signaling pathways including the neutrophin signaling pathway (FDR = 0.0128), pathways in cancer (FDR = 0.0968), Wnt signaling pathway (FDR = 0.1233), and MAPK signaling pathway (FDR = 0.1089). Pathways associated with cell adhesion such as adherens junction (FDR = 0.3387), ECM–receptor interaction (FDR = 0.3127), tight junction (FDR = 0.4342), and focal adhesion (FDR = 0.4319) were also enriched by DE-miRNAs in BRAF-mutated CRCs, although they were not that significant.
TABLE 3.
Enriched Gene Functions Affected by Significantly Altered miRNAs in BRAF-Mutated Colorectal Cancer in Comparison to KRAS-Mutated Colorectal Cancer
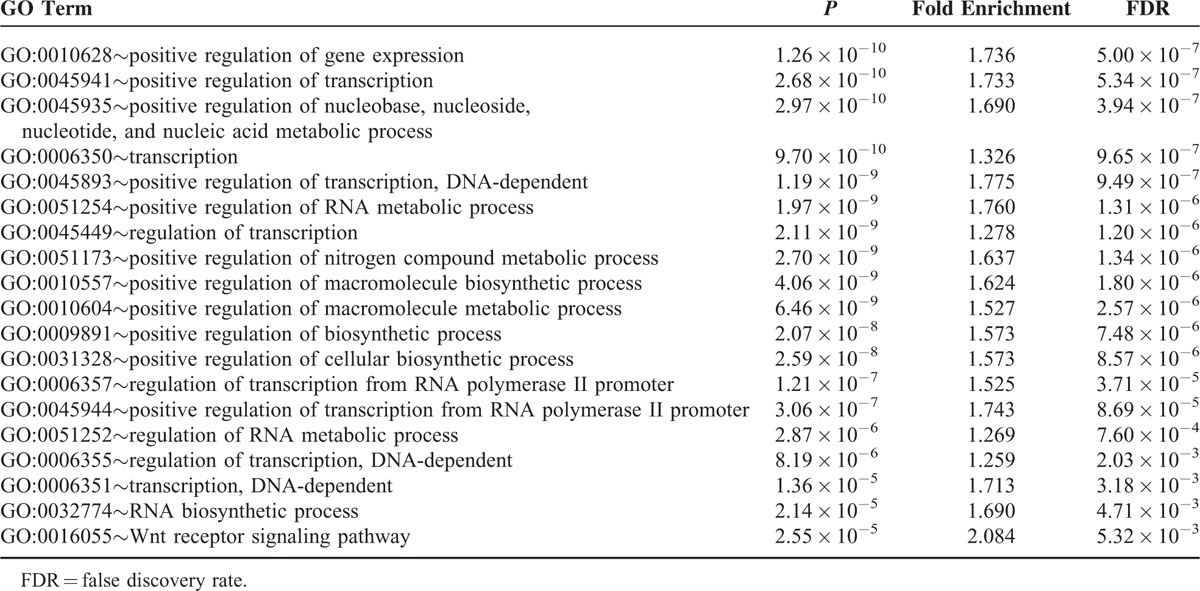
TABLE 4.
Significantly Deleterious Pathways by Altered miRNAs in BRAF-Mutated Colorectal Cancer in Comparison to KRAS-Mutated Colorectal Cancer
DISCUSSION
In search for the different miRNA signatures associated with BRAF-mutated CRCs compared with KRAS-mutated CRCs, we applied strict criteria for tissue selection, and could identify different miRNA expression signature associated with the BRAF mutation. Although a recent study investigated the different miRNA expression profiles in BRAF-mutated CRCs,23 this study compared the miRNA expressions only according to the presence or absence of BRAF mutation. In addition, there has been no such study comparing the miRNA expression profiles associated with BRAF mutation in comparison to KRAS mutation. Furthermore, unlike other previous studies, we tried to minimize possible factors that could affect the expression of miRNAs, such as histology and MSI status. From our analysis, we obtained a total of 10 DE-miRNAs. These included 3 upregulated miRNAs and 7 downregulated miRNAs. Among these, miR-31-5p showed the most significant fold change (FC = 8.331), and this result was in accordance with that of a previous study,23 thus further supporting the validity of our results.
In the analysis of the GO biologic processes, DE-miRNAs exert regulatory effect on target genes functionally associated with cellular proliferation such as positive regulation of gene expression, transcription, and RNA metabolic process. These indicate that these altered miRNAs may generate growth signals in tumor cells and make them proliferate vigorously. In line with this, DE-miRNAs were significantly related to the signaling pathways implicated in cancer development and proliferation, such as pathways in cancer, Wnt signaling, and MAPK signaling. These findings also at least in part explain the much more aggressive biologic behavior of BRAF-mutated CRCs than KRAS-mutated CRCs. In particular, MAPK pathway (also known as the RAS-RAF-MEK-ERK signaling pathway) is classically thought to be activated by mutations in KRAS or BRAF in CRCs, but our results suggest that these DE-miRNAs may also regulate the MAPK pathway, leading to differential activity of the corresponding pathway. In addition, these miRNAs also regulate genes associated with cell adhesion including adherens junction and focal adhesion which play critical roles in tumor progression and metastasis.33 Taken together, the DE-miRNAs in BRAF-mutated CRCs appear to be strongly involved in the aggressive phenotype of BRAF-mutated CRCs, and might be the potential treatment targets.
Among the DE-miRNAs, there is emerging evidence that miR-31-5p is closely associated with BRAF mutation in CRCs.23,26 Nosho et al23 revealed that miR-31-5p was the most upregulated gene in BRAF-mutated CRCs compared with the BRAF wild-type group. They also demonstrated that high miR-31 expression was associated with MSI-high, proximal location, and worse cancer-specific survival.23 Furthermore, a significant decrease of BRAF target proteins was demonstrated regardless of the mutational status after transfection of the miR-31 inhibitor in colon cancer cell lines.23 Therefore, miR-31 may be a promising diagnostic biomarker and the therapeutic target in patients with CRC. Beside miR-31-5p, the function of other miRNAs in our list has not been investigated yet in CRCs in other studies. However, a number of these miRNAs have been implicated for tumorigenesis and metastasis in other cancer types. For example, it was demonstrated that miR-362-5p inhibited proliferation and migration of neuroblastoma cells by targeting phosphatidylinositol 3-kinase-C2β,34 and that decreased expression of miR-425-3p was correlated with a worse prognosis in patients with hepatocellular carcinoma treated with sorafenib.35 It has also been found that miR-877-5p was upregulated in metastatic melanoma.36 As such, the DE-miRNAs associated with the BRAF-mutated CRC cases merit further investigation as to the details of their specific function in this cancer type.
We should note that there were some limitations to the present study. Although we demonstrated a significant enrichment of dysregulated miRNAs in various cancer-related pathways in patients with BRAF-mutated CRC, we did not further validate their expression, nor demonstrated their specific roles in these pathways using functional experiments. Moreover, the low incidence of BRAF mutation in our CRC cases and our strict criteria for selecting cases resulted in small number of samples in this study. Also, the present results were obtained based on microarray analysis and bioinformatics prediction, and needed to be further validated in the future. Nonetheless, this study may be regarded as a preliminary analysis to provide valuable research direction for future studies, especially for treatment of CRCs.
In summary, we identified a specific miRNA expression signature associated with BRAF mutation in comparison to KRAS mutation in CRCs, and identified 10 DE-miRNAs including miR-31-5p, miR-362-5p, and miR-425-3p. These miRNAs were functionally associated with positive regulation of gene expression and transcription, and they exert a regulatory effect on target genes in known major cancer-related pathways such as Wnt and MAPK signaling pathways. Our results suggest that these DE-miRNAs are implicated for the aggressive phenotype of BRAF-mutated CRCs. Further experimental validation is required to confirm these results.
Supplementary Material
Footnotes
Abbreviations: CRC = colorectal cancer, DE = differentially expressed, FDR = false discovery rate, FFPE = formalin-fixed paraffin-embedded, GO = gene ontology, KEGG = Kyoto Encyclopedia of Genes and Genomes, miRNA = microRNA, MSI = microsatellite instability, NCE = normal colon epithelium.
YWC and YSS contributed equally to this work.
This research was supported by Basic Science Research Program through the National Research Foundation of Korea (NRF) funded by the Ministry of Education (2014R1A1A1007905).
The authors have no conflicts of interest to disclose.
REFERENCES
- 1.Siegel R, Naishadham D, Jemal A. Cancer statistics, 2013. CA Cancer J Clin 2013; 63:11–30. [DOI] [PubMed] [Google Scholar]
- 2.Kraus S, Nabiochtchikov I, Shapira S, et al. Recent advances in personalized colorectal cancer research. Cancer Lett 2014; 347:15–21. [DOI] [PubMed] [Google Scholar]
- 3.Cunningham D, Humblet Y, Siena S, et al. Cetuximab monotherapy and cetuximab plus irinotecan in irinotecan-refractory metastatic colorectal cancer. N Engl J Med 2004; 351:337–345. [DOI] [PubMed] [Google Scholar]
- 4.Karapetis CS, Khambata-Ford S, Jonker DJ, et al. K-ras mutations and benefit from cetuximab in advanced colorectal cancer. N Engl J Med 2008; 359:1757–1765. [DOI] [PubMed] [Google Scholar]
- 5.Di Nicolantonio F, Martini M, Molinari F, et al. Wild-type BRAF is required for response to panitumumab or cetuximab in metastatic colorectal cancer. J Clin Oncol 2008; 26:5705–5712. [DOI] [PubMed] [Google Scholar]
- 6.Yuan ZX, Wang XY, Qin QY, et al. The prognostic role of BRAF mutation in metastatic colorectal cancer receiving anti-EGFR monoclonal antibodies: a meta-analysis. PLoS One 2013; 8:e65995. [DOI] [PMC free article] [PubMed] [Google Scholar]
- 7.Baldus SE, Schaefer KL, Engers R, et al. Prevalence and heterogeneity of KRAS, BRAF, and PIK3CA mutations in primary colorectal adenocarcinomas and their corresponding metastases. Clin Cancer Res 2010; 16:790–799. [DOI] [PubMed] [Google Scholar]
- 8.Brink M, de Goeij AF, Weijenberg MP, et al. K-ras oncogene mutations in sporadic colorectal cancer in The Netherlands Cohort Study. Carcinogenesis 2003; 24:703–710. [DOI] [PubMed] [Google Scholar]
- 9.Weisenberger DJ, Siegmund KD, Campan M, et al. CpG island methylator phenotype underlies sporadic microsatellite instability and is tightly associated with BRAF mutation in colorectal cancer. Nat Genet 2006; 38:787–793. [DOI] [PubMed] [Google Scholar]
- 10.Lochhead P, Kuchiba A, Imamura Y, et al. Microsatellite instability and BRAF mutation testing in colorectal cancer prognostication. J Natl Cancer Inst 2013; 105:1151–1156. [DOI] [PMC free article] [PubMed] [Google Scholar]
- 11.Kawazoe A, Shitara K, Fukuoka S, et al. A retrospective observational study of clinicopathological features of KRAS, NRAS, BRAF and PIK3CA mutations in Japanese patients with metastatic colorectal cancer. BMC Cancer 2015; 15:258. [DOI] [PMC free article] [PubMed] [Google Scholar]
- 12.Yuen ST, Davies H, Chan TL, et al. Similarity of the phenotypic patterns associated with BRAF and KRAS mutations in colorectal neoplasia. Cancer Res 2002; 62:6451–6455. [PubMed] [Google Scholar]
- 13.Ahlquist T, Bottillo I, Danielsen SA, et al. RAS signaling in colorectal carcinomas through alteration of RAS, RAF, NF1, and/or RASSF1A. Neoplasia 2008; 10:680–686.682 p following 686. [DOI] [PMC free article] [PubMed] [Google Scholar]
- 14.Pai RK, Jayachandran P, Koong AC, et al. BRAF-mutated, microsatellite-stable adenocarcinoma of the proximal colon: an aggressive adenocarcinoma with poor survival, mucinous differentiation, and adverse morphologic features. Am J Surg Pathol 2012; 36:744–752. [DOI] [PMC free article] [PubMed] [Google Scholar]
- 15.Roth AD, Tejpar S, Delorenzi M, et al. Prognostic role of KRAS and BRAF in stage II and III resected colon cancer: results of the translational study on the PETACC-3, EORTC 40993, SAKK 60-00 trial. J Clin Oncol 2010; 28:466–474. [DOI] [PubMed] [Google Scholar]
- 16.Ogino S, Meyerhardt JA, Irahara N, et al. KRAS mutation in stage III colon cancer and clinical outcome following intergroup trial CALGB 89803. Clin Cancer Res 2009; 15:7322–7329. [DOI] [PMC free article] [PubMed] [Google Scholar]
- 17.Huntzinger E, Izaurralde E. Gene silencing by microRNAs: contributions of translational repression and mRNA decay. Nat Rev Genet 2011; 12:99–110. [DOI] [PubMed] [Google Scholar]
- 18.Volinia S, Calin GA, Liu CG, et al. A microRNA expression signature of human solid tumors defines cancer gene targets. Proc Natl Acad Sci USA 2006; 103:2257–2261. [DOI] [PMC free article] [PubMed] [Google Scholar]
- 19.Schetter AJ, Heegaard NH, Harris CC. Inflammation and cancer: interweaving microRNA, free radical, cytokine and p53 pathways. Carcinogenesis 2010; 31:37–49. [DOI] [PMC free article] [PubMed] [Google Scholar]
- 20.Lu J, Getz G, Miska EA, et al. MicroRNA expression profiles classify human cancers. Nature 2005; 435:834–838. [DOI] [PubMed] [Google Scholar]
- 21.Yanaihara N, Caplen N, Bowman E, et al. Unique microRNA molecular profiles in lung cancer diagnosis and prognosis. Cancer Cell 2006; 9:189–198. [DOI] [PubMed] [Google Scholar]
- 22.Rossi S, Di Narzo AF, Mestdagh P, et al. microRNAs in colon cancer: a roadmap for discovery. FEBS Lett 2012; 586:3000–3007. [DOI] [PubMed] [Google Scholar]
- 23.Nosho K, Igarashi H, Nojima M, et al. Association of microRNA-31 with BRAF mutation, colorectal cancer survival and serrated pathway. Carcinogenesis 2014; 35:776–783. [DOI] [PubMed] [Google Scholar]
- 24.Ma Y, Zhang P, Wang F, et al. miR-150 as a potential biomarker associated with prognosis and therapeutic outcome in colorectal cancer. Gut 2012; 61:1447–1453. [DOI] [PubMed] [Google Scholar]
- 25.Mosakhani N, Sarhadi VK, Borze I, et al. MicroRNA profiling differentiates colorectal cancer according to KRAS status. Genes Chromosomes Cancer 2012; 51:1–9. [DOI] [PubMed] [Google Scholar]
- 26.Ito M, Mitsuhashi K, Igarashi H, et al. MicroRNA-31 expression in relation to BRAF mutation, CpG island methylation and colorectal continuum in serrated lesions. Int J Cancer 2014; 135:2507–2515. [DOI] [PubMed] [Google Scholar]
- 27.American Joint Committee on Cancer. AJCC cancer staging manual. 7th ed.New York: Springer; 2010. [Google Scholar]
- 28.Kwon MJ, Jeon JY, Park HR, et al. Low frequency of KRAS mutation in pancreatic ductal adenocarcinomas in Korean patients and its prognostic value. Pancreas 2015; 44:484–492. [DOI] [PubMed] [Google Scholar]
- 29.Sargent DJ, Marsoni S, Monges G, et al. Defective mismatch repair as a predictive marker for lack of efficacy of fluorouracil-based adjuvant therapy in colon cancer. J Clin Oncol 2010; 28:3219–3226. [DOI] [PMC free article] [PubMed] [Google Scholar]
- 30.Shahab SW, Matyunina LV, Mezencev R, et al. Evidence for the complexity of microRNA-mediated regulation in ovarian cancer: a systems approach. PLoS One 2011; 6:e22508. [DOI] [PMC free article] [PubMed] [Google Scholar]
- 31.Nam JW, Rissland OS, Koppstein D, et al. Global analyses of the effect of different cellular contexts on microRNA targeting. Mol Cell 2014; 53:1031–1043. [DOI] [PMC free article] [PubMed] [Google Scholar]
- 32.Yuen T, Ruf F, Chu T, et al. Microtranscriptome regulation by gonadotropin-releasing hormone. Mol Cell Endocrinol 2009; 302:12–17. [DOI] [PMC free article] [PubMed] [Google Scholar]
- 33.Zhao J, Guan JL. Signal transduction by focal adhesion kinase in cancer. Cancer Metastasis Rev 2009; 28:35–49. [DOI] [PubMed] [Google Scholar]
- 34.Wu K, Yang L, Chen J, et al. miR-362-5p inhibits proliferation and migration of neuroblastoma cells by targeting phosphatidylinositol 3-kinase-C2beta. FEBS Lett 2015; 589:1911–1919. [DOI] [PubMed] [Google Scholar]
- 35.Vaira V, Roncalli M, Carnaghi C, et al. MicroRNA-425-3p predicts response to sorafenib therapy in patients with hepatocellular carcinoma. Liver Int 2015; 35:1077–1086. [DOI] [PubMed] [Google Scholar]
- 36.Qi M, Huang X, Zhou L, et al. Identification of differentially expressed microRNAs in metastatic melanoma using next-generation sequencing technology. Int J Mol Med 2014; 33:1117–1121. [DOI] [PMC free article] [PubMed] [Google Scholar]
Associated Data
This section collects any data citations, data availability statements, or supplementary materials included in this article.