

Abstract
Many people exposed to torture later suffer from torture-related post-traumatic stress disorder (TR-PTSD). The aim of this study was to analyze the morphologic and functional brain changes in patients with TR-PTSD using magnetic resonance imaging (MRI) and positron emission tomography (PET).
This study evaluated 19 subjects. Thirteen subcortical brain structures were evaluated using FSL software. On the T1-weighted images, normalized brain volumes were measured using SIENAX software. The study compared the volume of the brain and 13 subcortical structures in 9 patients suffering from TR-PTSD after torture and 10 healthy volunteers (HV). Diffusion-weighted imaging (DWI) was performed in the transverse plane. In addition, the 18F-FDG PET data were evaluated to identify the activity of the elected regions.
The mean left hippocampal volume for the TR-PTSD group was significantly lower than in the HV group (post hoc test (Bonferroni) P < 0.001). There was a significant difference between the gray matter volume of the patients with TR-PTSD and the HV group (post hoc test (Bonferroni) P < 0.001). The TR-PTSD group showed low significant expansion of the ventricles in contrast to the HV group (post hoc test (Bonferroni) P < 0.001). Diffusion-weighted imaging revealed significant differences in the right frontal lobe and the left occipital lobe between the TR-PTSD and HV group (post hoc test (Bonferroni) P < 0.001).
Moderate hypometabolism was noted in the occipital lobe in 6 of the 9 patients with TR-PTSD, in the temporal lobe in 1 of the 9 patients, and in the caudate nucleus in 5 of the 9 patients. In 2 cases, additional hypometabolism was observed in the posterior cingulate cortex and in the parietal and frontal lobes.
The findings from this study show that TR-PTSD might have a deleterious influence on a set of specific brain structures. This study also demonstrated that PET combined with MRI is sensitive in detecting possible metabolic and structural brain changes in TR-PTSD.
INTRODUCTION
Torture occurs in more than 100 countries worldwide. In torture, the division between physical and psychological methods is not distinct. Physical torture has a number of major physical implications, but its real purpose is the psychological impact. Physical methods also in themselves have long-term psychological consequences, and most torture survivors therefore exhibit both physical and psychological symptoms following torture.1 The symptoms may often be in the form of post-traumatic stress disorder (PTSD) and, due to the widespread use of torture, can be seen as a major global health problem.2–4
Treatment for PTSD can be conducted using a multimodal path, mainly as a combination of psychotherapy and supportive pharmacological therapy including, most commonly, the use of selective serotonin reuptake inhibitors (SSRIs). Psychotherapeutic approaches include different methods such as cognitive behavior therapy (CBT) and eye movement desensitization and reprocessing (EDMR).5 However, these forms of therapy are ineffective in 25% to 50% of patients with PTSD.6
Narrative exposure therapy (NET) is an evidence-based short-term culturally universal intervention for trauma victims and has proven to be successful in various settings.7 A study of responders and nonresponders to NET treatment among refugees in Norway reported that females benefit more from treatment of PTSD than males, and that violent offenders are difficult to treat within the standard treatment programs.8
Differences in structural parts of the brain particularly the amygdala and hippocampus either prior to or resulting from trauma, are relevant in processing stressful events, and are thought to be important factors in the relatively high rate of nonresponders to treatment.
Bryant et al9 found that poor improvement after CBT treatment was associated with greater bilateral amygdala and ventral anterior cingulate activation in response to masked fearful faces. Nardo et al10 found that a decrease in the gray matter density in patients with PTSD was correlated to a decrease in the effectiveness of EDMR therapy.
In Eckart et al's study, using combined magnetic resonance (MR) volumetric and spectroscopic data of hippocampus and insula in traumatized refugees, the authors found a correlation between left hippocampal N-acetyl-aspartate (NAA) and adverse early life experiences that presented a potential adverse effect on the early environment of hippocampal functional integrity.2
Additionally, structural alterations in lateral prefrontal, parietal, and posterior midline regions among males with chronic posttraumatic stress disorder were reported by Eckart et al.11
Gilbertson et al12 found evidence that smaller hippocampi indeed constitute a risk factor for the development of stress-related psychopathology.
Herringa et al13 reported smaller subgenual cingulate, caudate, and insula volumes in unmedicated combat veterans.
In a meta-analysis study being done by Woon and Hedges14 the right amygdala was significantly larger than the left, indicating an asymmetrically lateralized amygdala volume that is preserved in trauma exposure and in PTSD.
The results of the study done by Morey et al15 provided clear evidence of an association between a smaller amygdala volume and PTSD.
Even among highly traumatic events, torture appears to be an especially strong predictor of severe, chronic, and treatment-resistant symptoms,16 and has frequently been demonstrated to be the most important factor for the development of reactive psychiatric symptomatology among refugee populations that have been frequently exposed to a high number of traumatic events.17 That torture survivors are a special group of trauma victims was also underlined by Carlsson et al,18 who reported almost no improvement in the majority of torture survivors who underwent a comprehensive treatment package under optimal naturalistic conditions at a specialized center in a safe country.
DWI generates images that are based on the molecular motion of water, which is altered by disease. Although DWI has been attempted for various organ systems, its primary use has been in the central nervous system. The most widely used clinical application is in detecting hyperacute infarcts and differentiating acute or subacute infarction from chronic infarction. In various disease states, very small changes in fluid balance occur in the brain. To detect these types of changes, DWI is particularly effective and has proven to be very helpful in assessing the pathophysiologies.
Functional and structural brain imaging techniques, developed in the wake of advanced knowledge of disease processes, have furthered biologically oriented research in psychiatry and have been shown to be increasingly useful clinically.
To our knowledge in spite of previous studies there are few studies in literature investigating brain changes in torture survivors. In our study, we combined PET/MRI data to investigate this specific form of post-traumatic stress disorder in regard to torture.
Thus, the aim of this study was to analyze the morphologic and functional brain changes in patients with torture-related post-traumatic stress disorder (TR-PTSD) using the combination of MRI and 18F-FDG PET.
METHODS
Patients
The local ethics committee granted ethical approval for the study, and informed consent was obtained from all subjects. The study was conformed to Declaration of Helsinki. This study evaluated 9 subjects suffering from TR-PTSD: 7 men and 2 women (age range, 20–47 years; mean age ± standard deviation (SD), 38.8 ± 12.2 years). The patient consists of former political prisoners in their countries who were under heavy psychological and physical torture without physical traumatic brain injuries.
The exclusion criteria of our study consisted of having a history of traumatic brain injury or neurological disorder, alcohol (greater than 14 alcoholic drinks per week) or illicit drug abuse or dependence, and having a contraindication for MRI investigation, including the presence of metal clips, heart pacemakers, claustrophobia, and the possibility of pregnancy.
Clinician-Administered PTSD Scale
PTSD symptom scores were established using the Clinician-Administered PTSD Scale (CAPS).
All PTSD patients experienced more than 1 traumatic event that met Criterion A for PTSD. The mean duration of illness was 1 year.
Subjects were Iranian (n = 4), Kurdish (n = 3), and Turkish (n = 2).
The 10 healthy volunteers (HV) for MR imaging included 9 men and 1 woman (age range, 20–62 years; mean age ± standard deviation (SD), 36.7 ± 13.1 years).
The healthy volunteers have not any exposure to violent events. The HV were from Turkey (6) and Iran (4). All subjects were currently unmedicated.
Mini-International Neuropsychiatric Interview
The diagnosis of major depression according to DSM-IV was based on the corresponding sections of the Mini-International Neuropsychiatric Interview (MINI).19 None of the PTSD patients met criteria for other current comorbid disorders.
Exposure to Torture Scale
An Exposure to Torture Scale (ETS), which provided information on 46 different captivity stressors. Each stressor event was rated as present or absent (absent events were coded as zero, indicating no distress experienced with respect to that event category).20
Magnetic Resonance Imaging
In our study, we used a 1.5-T whole-body system (Philips Medical System, Best, The Netherlands) with a 30 mT/m maximum gradient capability. A sagittal T1-weighted localizing sequence (repetition time [TR]/echo time [TE]/excitations, 15/6/1), and an axial T1-weighted (650/15/1) sequence were utilized. Adjustments to the T1-weighted sequence included a section thickness (ST) of 5 mm and a 1-mm intersection gap. The acquisition matrix was 256 × 256, and the field of view (FOV) measured 22 cm. The parameters for diffusion-weighted imaging (DWI) were TR/TE, 3348/73; b = 1000 s/mm2; FOV, 131 mm; matrix 128 × 128 pixels; ST, 5 mm; intersection gap of 1 mm; with 1 signal acquired.
ADC maps were generated automatically. The ADC values of the hippocampus, occipital lobe, frontal lobe, parietal lobe, temporal lobe, thalamus, and caudate nucleus were measured. The b factor with a value of 1000 smm2 was used.
MRI Image Analysis
Image analysis was performed using the FMRIB Software Library (FSL), version 4.1 (Oxford, UK). The FMRIB Image Registration and Segmentation Tool (FIRST) is the FSL tool for segmenting subcortical structures. Thirteen subcortical brain structures were evaluated, which were extracted with FSL FIRST, a method that has been used successfully in many recent investigations.21,22 On the T1-weighted images, normalized brain volumes were measured using SIENAX.23 The SIENAX software utilizes a brain extraction tool for the segmentation of a brain from nonbrain tissue in the head. The extracted brain image was segmented into white matter (WM), gray matter (GM), and central spinal fluid (CSF) to estimate the absolute volume of the brain tissue fraction (Figure 1). SIENAX uses a normalization factor to correct the skull size. The normalization factor is maintained by registering the subject's scan to the Montreal Neurological Institute 152 (MNI152) standard image.
FIGURE 1.
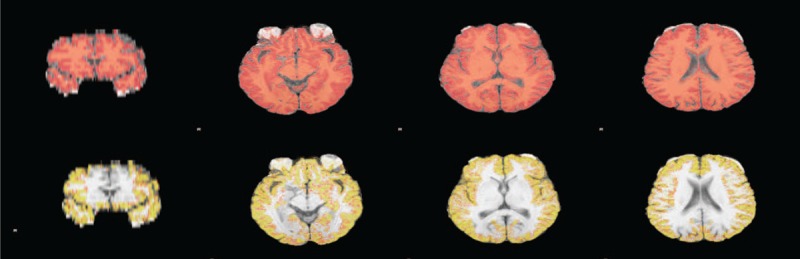
Final SIENAX segmentation results. SIENAX first excludes nonbrain tissue, and then uses the brain and skull images to estimate a scaling factor between the subject images and standard space. Tissue segmentation is then used to estimate the volume of brain tissue, which is then multiplied by the estimated scaling factor to reduce head-size-related variability between subjects: whole-brain segmentation (A); peripheral cortex masked segmentation (B). SIENAX = structural image evaluation using normalization of atrophy cross-sectional.
Our study compared the volume of the brain and 13 subcortical structures (brainstem/4th ventricle, thalamus, caudate nucleus, putamen, globus pallidus, hippocampus, amygdala, and nucleus accumbens) to explore relations between the total brain volume (TBV) and the subcortical brain volume in patients with TR-PTSD compared to the HV group.
As age, sex, and intracranial volume are potential confounders of volumetric measures of brain structures, we considered these parameters as covariates in all structural analyses. Our statistical model included analysis of the potential influence of depression. This parameter was found to be nonsignificant; it was excluded from the final model.
18F-FDG PET Imaging
In addition, the FDG PET data were evaluated to identify the metabolic activity of the different brain regions. The patients fasted overnight. Metabolic images were acquired using a PET scanner (Siemens, EXACT, Knoxville, TN). Thirty minutes after intravenous injection of 180 MBq, 18F-FDG PET images were acquired. Attenuation correction was performed using Ge/Ga-68 transmission rods (Siemens Systems, USA). The images were reconstructed using an OSEM algorithm with 2 iterations and 10 subsets and visualized in 3 slices (coronal, sagittal, and transaxial). A voxel-based analysis of the metabolic data was performed using commercial software on an advantage workstation compared to an age-matched control database (CortexID, GE, USA). The normal database and the present subjects were scanned with closed eyes.
Statistical Analysis
The data obtained from the patients were recorded in a Microsoft Excel file, and the statistical analysis was conducted using SPSS (Version 20, IBM, USA).
For quantitative analysis, we performed Mann–Whitney U tests to assess the differences in the ADC value on DWI between the patients with TR-PTSD and the HV group. In our MRI structural analysis of the subcortical structures and to estimate the volumetric loss of brain tissue, we performed ANOVA tests to assess differences between the TR-PTSD group and the HV group. Probability values of less than 0.05 were considered significant. The Bonferroni correction was used to correct for multiple comparisons. Pearson correlation coefficients were calculated between ETS score, PTSD score, and gray matter volume.
RESULTS
The study was performed prospectively and included 9 patients with TR-PTSD and 10 healthy volunteers. Perceived distress associated with stressors under torture is presented in Table 1.
TABLE 1.
Perceived Distress Associated With Stressors Under Torture
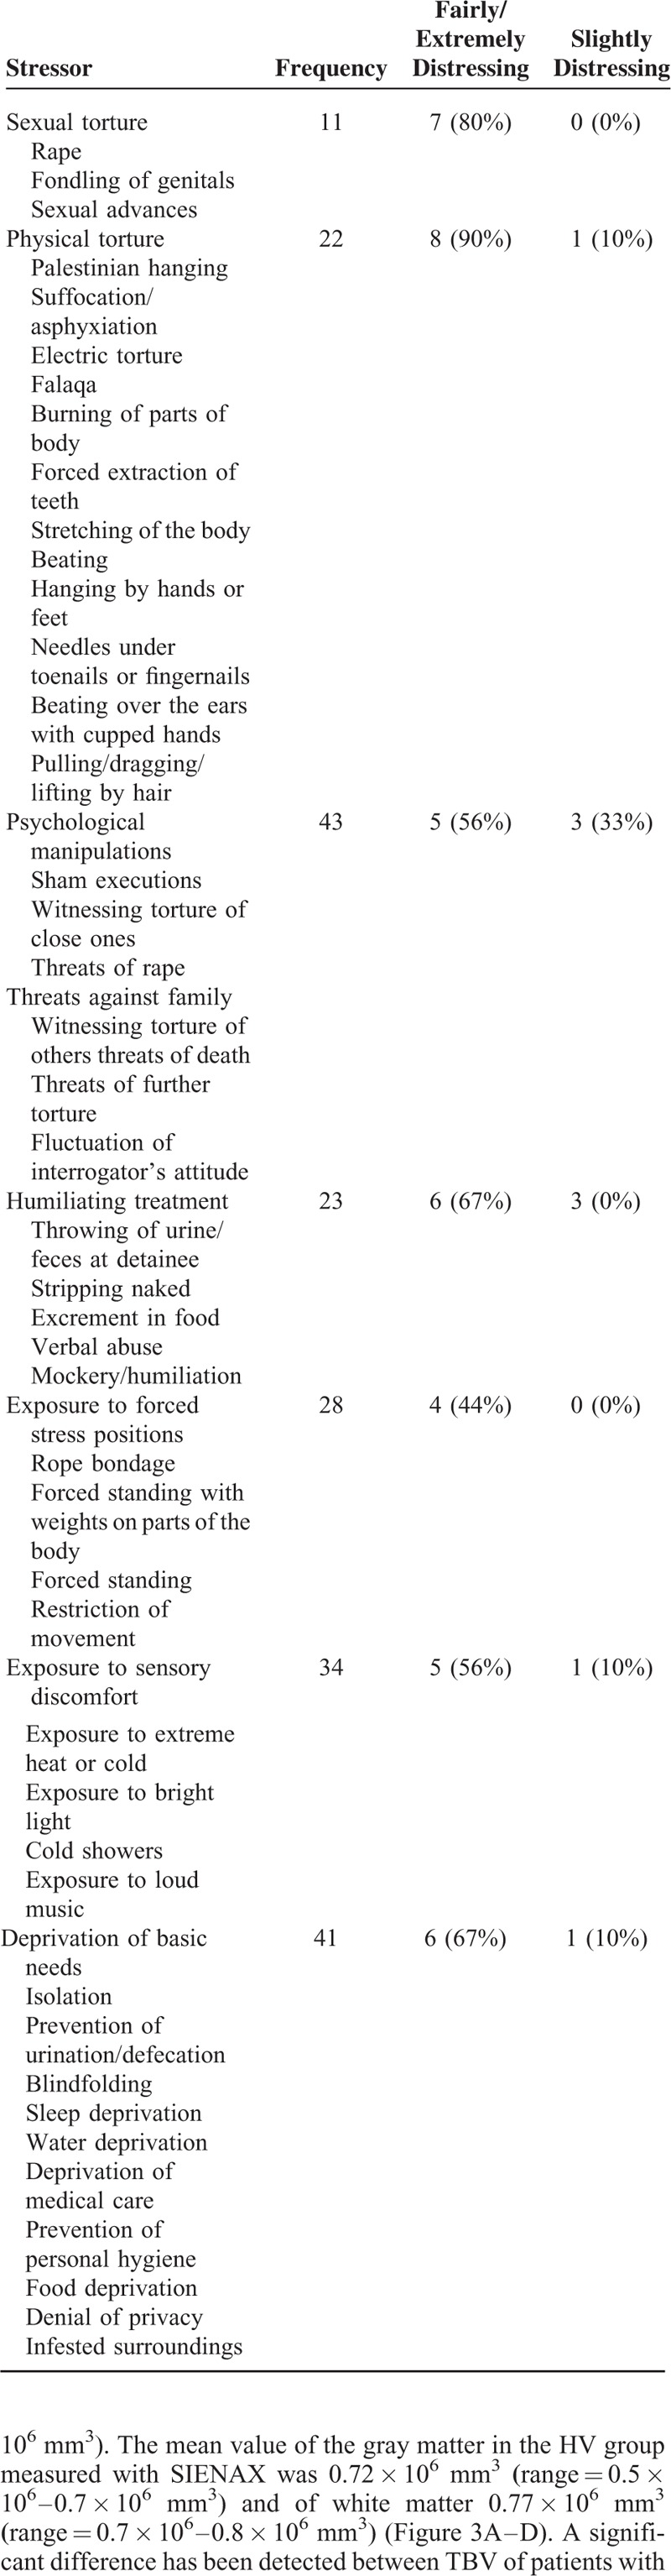
The mean value of the TBV in the patients with TR-PTSD was 1.38 × 106 mm3 (range = 1.8 × 10⁶–0.8 × 106 mm3) and 1.49 × 106 mm3 (range = 1.6 × 10⁶–1.3 × 106 mm3) in the HV group measured with SIENAX software (Figure 2). The mean value of the gray matter volume in the patients with TR-PTSD was 0.67 × 106 mm3 (range = 0.3 × 10⁶–0.7 × 106 mm3) and of white matter 0.72 × 106 mm3 (range = 0.4 × 10⁶–0.9 × 106 mm3). The mean value of the gray matter in the HV group measured with SIENAX was 0.72 × 106 mm3(range = 0.5 × 10⁶–0.7 × 106 mm3) and of white matter 0.77 × 106 mm3(range = 0.7 × 10⁶–0.8 × 106 mm3) (Figure 3A–D). A significant difference has been detected between TBV of patients with TR-PTSD and HV groups. There was a significant difference between the gray matter of the patients with TR-PTSD and that of the HV group. Also significant differences were observed between the white matter value of the patients with TR-PTSD and the HV group. The TR-PTSD group showed a significant expansion of the ventricles in contrast to the HV group. The mean value was 0.03 × 106 mm3 (range = 0.01 × 10⁶–0.04 × 106 mm3) in the HV group ((post hoc test (Bonferroni) P < 0.001). After performing the Bonferroni correction for multiple comparisons, the differences in white matter values observed between the patients with TR-PTSD and the HV groups were not significant. The mean PTSD score was 96.43 ± 15.8 (51–116). PTSD participants showed a mean ETS score (SD) of 20 (±7).
FIGURE 2.
SIENAX analysis of brain volumes average (cm3) of patients with TR-PTSD (N = 9) and without TR-PTSD (N = 10). There was a significant difference between the gray matter of the patients with TR-PTSD and that of the HV group (post hoc test (Bonferroni) P < 0.001). The TR-PTSD group showed low significant expansion of the ventricles in contrast to the HV group (post hoc test (Bonferroni) P < 0.001). HV = healthy volunteers, SIENAX = structural image evaluation using normalization of atrophy cross-sectional, TR-PTSD = torture-related post-traumatic stress disorder.
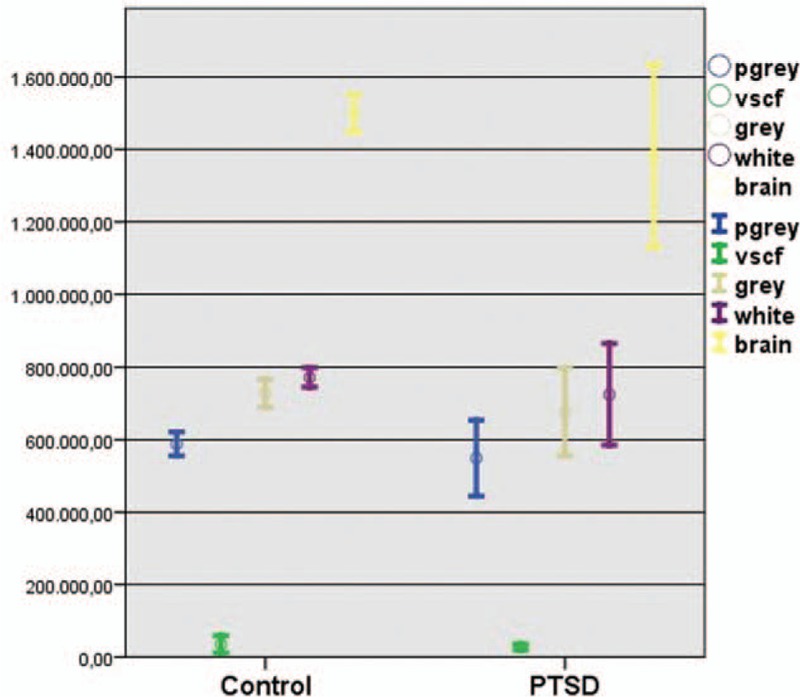
FIGURE 3.
The scatter plots show 2 main groups of data points. A, There was a significant difference between the gray matter volume of patients with TR-PTSD and that of the HV group. B, After performing the Bonferroni correction for multiple comparisons, the differences observed between the white matter values of patients with TR-PTSD and the HV group were nonsignificant. C, A significant difference was found between the TBV of patients with TR-PTSD and the HV group. D, The TR-PTSD group showed significant ventricular expansion compared with the HV group. HV = healthy volunteers; TBV = total brain volume; TR-PTSD = torture-related post-traumatic stress disorder.
Pearson correlation indicated a positive association between ETS and PTSD scores (r = 0.260, P = 0.045). The results showed a significant correlation between ETS score and gray matter volume (r = 0.195, P = 0.041). No significant correlation was found between ETS score and the other brain regions.
The inclusion of age, sex, and ICV as covariates did not alter these results.
To segment and quantify the subcortical brain structures between the TR-PTSD group and the HV group, we performed brain volumetry using the software FSL.
The left hippocampal volume mean value of the TR-PTSD group was 0.003 × 106 mm3 (range = 0.003 × 10⁶–0.005 × 106 mm3). This value was significantly lower than in the HV group. In contrast, no differences were evident in other subcortical regions ((post hoc test (Bonferroni) P < 0.001, Figure 4)).
FIGURE 4.
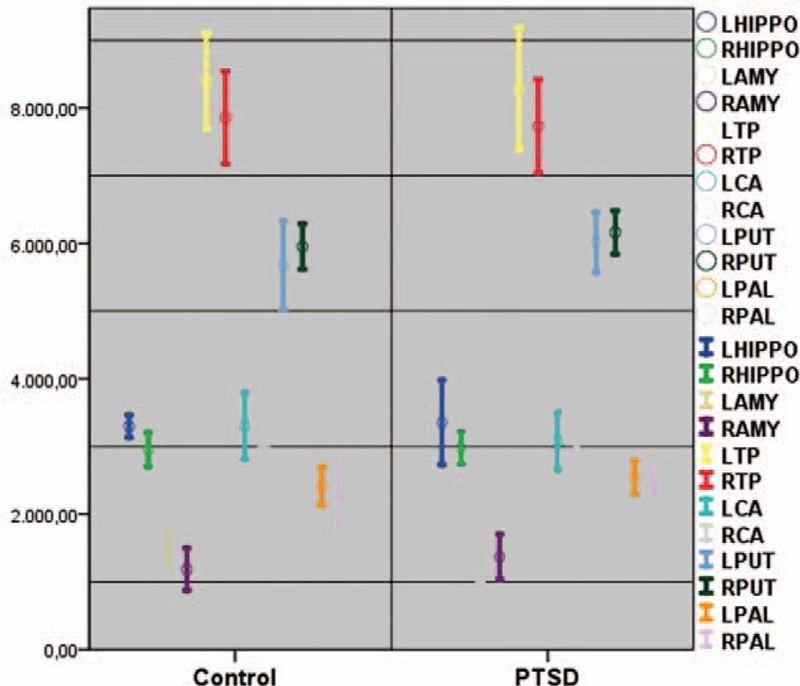
Subcortical structure volume average differences (cm3) in patients with TR-PTSD (N = 9) and the HV group (N = 10). This left hippocampal value was significantly lower in patients with TR-PTSD than in the HV group (post hoc test (Bonferroni) P < 0.001). HV = healthy volunteers, TR-PTSD = torture-related post-traumatic stress disorder.
The image quality of the DW images was adequate in all patients. In the hippocampus, the mean ADC values were 0.7 ± 0.02 × 10⁻³ mm2/s (range, 0.7–0.9 × 10⁻³ mm2/s) in the right frontal lobe, 0.7 ± 0.04 × 10⁻³ mm2/s (range, 0.5–0.8 × 10⁻³ mm2/s) in the right cerebellum, and 0.9 ± 0.1 × 10⁻³ mm2/s (range, 0.7–1 × 10⁻³ mm2/s) in the left occipital lobe in the patients with TR-PTSD. The ADC values in the HV group were 0.7 ± 0.03 × 10⁻³ mm2/s (range, 0.6–0.9 × 10⁻³ mm2/s) in the right frontal lobe, 0.9 ± 0.14 mm2/s (range, 0.7–1.2 × 10⁻³ mm2/s) in the left occipital lobe, and 0.7 ± 0.07 × 10⁻³ mm2/s (range, 0.5–0.9 × 10⁻³ mm2/s) in the right cerebellum (Table 2). Statistically significant differences were found in the right frontal lobe, in the left occipital lobe, and in the right cerebellum between TR-PTSD patients and the HV group. No statistically significant differences were found between the other cortical regions ((post hoc test (Bonferroni) P < 0.001; Figure 5).
TABLE 2.
Comparison of Brain Volume (106 mm3) and ADC Values (10−3 mm2/s) Between Health Volunteers and Patients With TR-PTSD
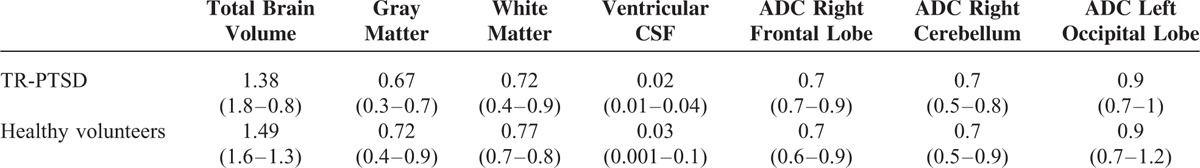
FIGURE 5.
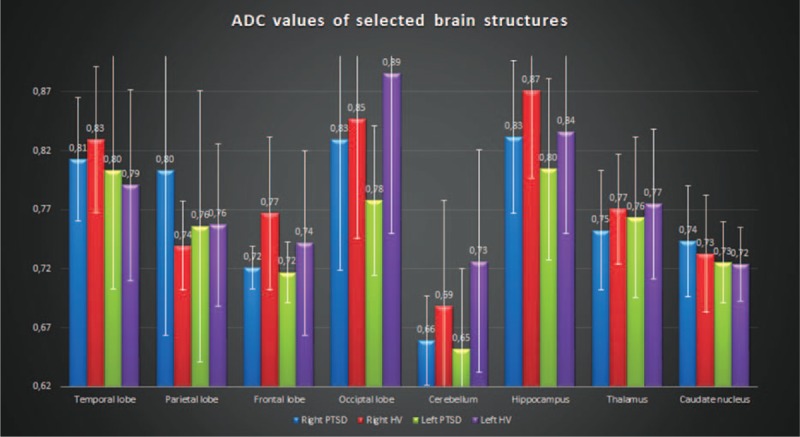
Comparison of the ADC values (mm2/s) of selected brain structures in patients with TR-PTSD (N = 9) and the HV group (N = 10). Diffusion-weighted imaging showed significant differences in the right frontal lobe and the left occipital lobe between the TR-PTSD and HV group (post hoc test (Bonferroni) P < 0.001). No statistically significant differences were found between the other various cortical regions. ADC = apparent diffusion coefficient, HV = healthy volunteers, TR-PTSD = torture-related post-traumatic stress disorder.
Inclusion of age, sex, and ICV as covariates did not alter these results.
After performing the Bonferroni correction for multiple comparisons, the differences observed between the right cerebellum values of patients with TR-PTSD and the HV group were not significant.
Moderate hypometabolism (reduction of >1.7 SD) was noted in the occipital lobe in 6 of the 9 patients with TR-PTSD, in the temporal lobe in 1 of the 9 patients, and in the caudate nucleus in 5 of the 9 patients. In 2 cases, additional hypometabolism was observed in the posterior cingulate cortex and in the parietal and frontal lobes. All affected sites were in both hemispheres (Figure 6).
FIGURE 6.
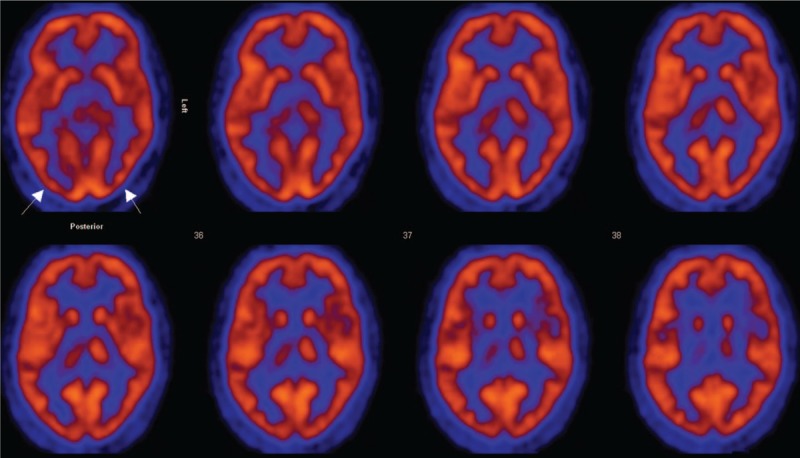
FDG PET data were evaluated to identify the metabolic activity of the selected regions in TR-PTSD patients (N = 9). Moderate hypometabolism (arrows) was noted in the occipital lobe in 6 of the 9 patients with TR-PTSD, in the temporal lobe in 1 of the 9 patients, and in the caudate nucleus in 5 of the 9 patients. FDG PET = fluorodeoxyglucose positron emission tomography, TR-PTSD = torture-related post-traumatic stress disorder.
DISCUSSION
Individuals with severe PTSD are known to have high rates of symptoms, including hyperarousal, vigilance, sleep disorders, and explosiveness. Changes in the organism's biologic response to stress can occur even years after the original insult.
Our study examines the metabolic and structural brain changes in individual with and without TR-PTSD.
In our study, brain structural variability in the patients with TR-PTSD was noted most markedly in the hippocampus. These results are similar to those of a previous study conducted by Bremner et al,24 who reported that hippocampal activation failed and the volume of the hippocampus was smaller in women who had experienced abuse and PTSD. However, Eckart et al2 found no PTSD-related difference in the volumes or neurometabolite levels of bilateral hippocampus or insula.
In contrast to the previous study, we did not find additional brain structural changes, particularly in the subcortical region of the brain in the TR-PTSD group. However, significant changes in the gray matter volume of the patients with TR- PTSD were observed with SIENAX analysis.
We found a significant correlation between ETS and PTSD scores, which supports the findings of Winkler et al.3 Additionally, we found a significant correlation between ETS and gray matter volume of PTSD patients.
Liu25 reported that the ADC value among coal mine disaster survivors with PTSD was obviously higher in the right superior temporal gyrus and right corpus callosum.
Using diffusion-weighted sequences in our study, significant changes in ADC were observed in areas of the right frontal lobe, the left occipital lobe, and the right cerebellum. The reason for the ADC value changes remains unclear at this time, and merits further studies. The brain regions examined in the present study were selected due to previous reports of specific effects of PTSD on these selected areas.26–29 In our study, we did not observe any significant ADC value changes in other selected cortical and subcortical regions of the brain by this method when we compared the groups.
In contrast to the MRI structural analysis and DWI results, metabolic examination using FDG PET revealed hypometabolism in the occipital region of the brain in 6 patients with TR-PTSD and hypometabolism in 1 patient with TR-PTSD in the temporal region. Moderate hypometabolism was noted in the caudate nucleus in 5 patients. Two patients showed additional hypometabolism in the posterior cingulate cortex and in the parietal and frontal lobes.
Schaller et al discussed different imaging techniques with respect to their visualizing effect of biochemical, cellular, and/or structural changes in dementia. The pathophysiology is becoming increasingly understood by revealing the underlying basis of neuropsychological changes with current imaging techniques, genetic and pathological features, which suggest that alterations of neurovascular regulatory mechanisms may lead to brain dysfunction and disease. The cerebrovascular deregulation could be seen as a contributor to cerebrovascular pathologies, such as neurodegenerative conditions.30
In our study, the results demonstrate that analyzing the structural MRI together with PET could discriminate between patients with TR-PTSD and the HV group.
From the previous study, we know that not all patients with TR-PTSD show well-defined brain structural alterations on MRI. Our pattern of results provides preliminary support for the evaluation of combination of MRI and PET data in combination, as a clinical diagnostic tool in patients with TR-PTSD.
This combination could potentially be used in the future in a clinical routine to inform the clinical evaluation of those difficult to categorize using traditional methods of clinical assessment alone. However, further research with larger patient groups might help to identify individuals at risk of (or resilient to) developing TR-PTSD following traumatic events.
Furthermore, neuroimaging studies of patients suffering from PTSD after trauma also produced potentially important findings with possible implications for therapeutic interventions. It was suggested that the metabolic changes might explain a neurological component of the patients’ symptoms in addition to morphological abnormalities. In this context, Shin Lm shows in his FDG-PET study regional cerebral blood flow increases in orbitofrontal cortex and anterior temporal poles in childhood sexual abuse-related PTSD.31
The findings suggest a correlation between changes in the brain and the TR-PTSD symptoms. The present findings should be considered in the context of a number of limitations. A limitation of the present study was the lack of follow-up data for the patients with TR-PTSD, and the small number of participants with this specific form of PTSD. Another limitation was the MRI slice thickness of 5 mm; a slice of smaller thickness could influence the measurement accuracy, but the investigation time would be longer and would lead to a lower tolerance degree of the MRI examination in these specific forms of population.
Additional research is needed to improve our understanding of why some individuals develop TR-PTSD in response to a stressor, whereas others do not.
CONCLUSION
TR-PTSD is a common consequence of psychological trauma in survivors of torture and extreme violence. We investigated the brain changes in torture survivors by PET and MRI. In our study, the mean left hippocampal volume for the TR-PTSD group was significantly lower than in the HV group, and there was a significant difference between the gray matter volume of the patients with TR-PTSD and the HV group. The TR-PTSD group showed significantly lower expansion of the ventricles in contrast to the HV group. Diffusion-weighted imaging revealed significant differences in the right frontal lobe and the left occipital lobe between the TR-PTSD and HV groups. In addition, a moderate hypometabolism was noted in the occipital lobe in 6 of the 9 patients with TR-PTSD; in the temporal lobe in 1 of the 9 patients; and in the caudate nucleus in 5 of the 9 patients.
The findings from this study suggest that TR-PTSD might have a deleterious influence on a set of specific brain structures. These TR-PTSD-related brain changes may play a potential role in chronic, unremitting psychiatric symptoms, even decades after exposure to torture. Healthcare professionals and human rights workers must consider the potential mental health impact of TR-PTSD in torture survivors. This study also demonstrated that PET, in combination with MRI, is sensitive in detecting possible metabolic and structural brain changes in TR-PTSD, and quantitative MRI may be important for assessing the effects of TR-PTSD on the brain. This will allow researchers to gain a better understanding of the disease, with possible treatment implications.
Footnotes
Abbreviations: 18F-FDG-PET = 18F-Fluor-Desoxyglucose positron emission tomography, ADC = apparent diffusion coefficient, AUC = area under the curve, CAPS = Clinician-Administered PTSD Scale, CBT = cognitive behavior therapy, CSF = central spinal fluid, DWI = diffusion-weighted imaging, EDMR = eye movement desensitization and reprocessing, ETS = Exposure to Torture Scale, FIRST = FMRIB Image Registration and Segmentation Tool, FOV = field of view, FSL = FMRIB Software Library, GM = gray matter, HV = healthy volunteers, MINI = Mini-International Neuropsychiatric Interview, MNI152 = Montreal Neurological nstitute 152, MRI = magnetic resonance imaging, NAA = N-acetyl-aspartate, NET = Narrative exposure therapy, ROC = receivers operating characteristic curve, SD = standard deviation, SSRIs = selective serotonin reuptake inhibitors, TBV = total brain volume, TR-PTSD = torture-related post-traumatic stress disorder, WM = white matter.
Supplementary research is required to improve our understanding of why some individuals develop TR-PTSD in response to a stressor.
SZ conceived the study and design. SZ and RB undertook acquisition of data. SZ, RB, analyzed and interpreted the data and drafted the manuscript. JH, PK, K Hergan, K Hittmair, SM performed critical revision of the manuscript. SM supervised the study. All authors read and approved the final manuscript. I attest that this work has been approved by all co-authors.
The authors have no conflicts of interest to disclose.
REFERENCES
- 1.Vesti P, Somnier F, Kastrup M. Vesti P, Somnier F, Kastrup M. Psychological reactions of victims during torture. Psychotherapy with Torture Survivors. Glostrup: Dyva Bogtryk Aps; 1992. 18–26. [Google Scholar]
- 2.Eckart C, Kaufmann J, Kanowski M, et al. Magnetic resonance volumetry and spectroscopy of hippocampus and insula in relation to severe exposure of traumatic stress. Psychophysiology 2012; 49:261–270. [DOI] [PubMed] [Google Scholar]
- 3.Winkler N, Ruf-Leuschner M, Ertl V, et al. From war to classroom: PTSD and depression in formerly abducted youth in Uganda. Front Psychiatry 2015; 6:2. [DOI] [PMC free article] [PubMed] [Google Scholar]
- 4.Wenzel T. Torture. Curr Opin Psychiatry 2007; 20:491–496. [DOI] [PubMed] [Google Scholar]
- 5.Foa EB. Psychosocial treatment of posttraumatic stress disorder. J Clin Psychiatry 2006; 67:40–45. [PubMed] [Google Scholar]
- 6.Bradley R, Greene J, Russ E, et al. A multidimensional meta-analysis of psychotherapy for PTSD. Am J Psychiatry 2005; 162:214–227. [DOI] [PubMed] [Google Scholar]
- 7.Stenmark H, Guzey IC, Elbert T, et al. Gender and offender status predicting treatment success in refugees and asylum seekers with PTSD. Eur J Psychotraumatol 2014; 5:20803. [DOI] [PMC free article] [PubMed] [Google Scholar]
- 8.Stenmark H, Catani C, Neuner F, et al. Treating PTSD in refugees and asylum seekers within the general health care system. A randomized controlled multicenter study. Behav Res Ther 2013; 51:641–647. [DOI] [PubMed] [Google Scholar]
- 9.Bryant RA, Felmingham K, Kemp A, et al. Amygdala and ventral anterior cingulate activation predicts treatment response to cognitive behaviour therapy for post-traumatic stress disorder. Psychol Med 2008; 38:555–561. [DOI] [PubMed] [Google Scholar]
- 10.Nardo D, Högberg G, Looi JC, et al. Gray matter density in limbic and paralimbic cortices is associated with trauma load and EMDR outcome in PTSD patients. J Psychiatr Res 2010; 44:477–485. [DOI] [PubMed] [Google Scholar]
- 11.Eckart C, Stoppel C, Kaufmann J, et al. Structural alterations in lateral prefrontal, parietal and posterior midline regions of men with chronic posttraumatic stress disorder. J Psychiatry Neurosci 2011; 36:176–186. [DOI] [PMC free article] [PubMed] [Google Scholar]
- 12.Gilbertson MW, Shenton ME, Ciszewski A, et al. Smaller hippocampal volume predicts pathologic vulnerability to psychological trauma. Nat Neurosci 2002; 5:1242–1247. [DOI] [PMC free article] [PubMed] [Google Scholar]
- 13.Herringa R, Phillips M, Almeida J, et al. Post-traumatic stress symptoms correlate with smaller subgenual cingulate, caudate, and insula volumes in unmedicated combat veterans. Psychiatry Res 2012; 203:139–145. [DOI] [PMC free article] [PubMed] [Google Scholar]
- 14.Woon FL, Hedges DW. Amygdala volume in adults with posttraumatic stress disorder: a meta-analysis. J Neuropsychiatry Clin Neurosci 2009; 21:5–12. [DOI] [PubMed] [Google Scholar]
- 15.Morey RA, Gold AL, LaBar KS, et al. Amygdala volume changes in posttraumatic stress disorder in a large case-controlled veterans group. Arch Gen Psychiatry 2012; 69:1169–1178. [DOI] [PMC free article] [PubMed] [Google Scholar]
- 16.Johnson H, Thompson A. The development and maintenance of post-traumatic stress disorder (PTSD) in civilian adult survivors of war trauma and torture: a review. Clin Psychol Rev 2008; 28:36–47. [DOI] [PubMed] [Google Scholar]
- 17.Willard CL, Rabin M, Lawless M. The prevalence of torture and associated symptoms in United States Iraqi refugees. J Immigr Minor Health 2014; 16:1069–1076. [DOI] [PubMed] [Google Scholar]
- 18.Carlsson JM, Olsen DR, Kastrup M, et al. Late mental health changes in tortured refugees in multidisciplinary treatment. J Nerv Ment Dis 2010; 198:824–828. [DOI] [PubMed] [Google Scholar]
- 19.Sheehan DV, Lecrubier Y, Sheehan KH, et al. The mini-international neuropsychiatric interview (M.I. N. I.): the development and validation of a structured diagnostic psychiatric interview for DSM-IV and ICD-10. J Clin Psychiatry 1998; 59 ((Suppl 20)):22–33. [PubMed] [Google Scholar]
- 20.Başoğlu M, Livanou M, Crnobarić C. Torture vs other cruel, inhuman, and degrading treatment: is the distinction real or apparent? Arch Gen Psychiatry 2007; 64:277–285. [DOI] [PubMed] [Google Scholar]
- 21.Jenkinson M, Beckmann CF, Behrens TE, et al. FSL. NeuroImage 2012; 62:782–790. [DOI] [PubMed] [Google Scholar]
- 22.Woolrich MW, Jbabdi S, Patenaude B, et al. Bayesian analysis of neuroimaging data in FSL. NeuroImage 2009; 45:173–186. [DOI] [PubMed] [Google Scholar]
- 23.Smith SM, Jenkinson M, Woolrich MW, et al. Advances in functional and structural MR image analysis and implementation as FSL. NeuroImage 2004; 23:208–219. [DOI] [PubMed] [Google Scholar]
- 24.Bremner JD, Vythilingam M, Vermetten E, et al. MRI and PET study of deficits in hippocampal structure and function in women with childhood sexual abuse and posttraumatic stress disorder. Am J Psychiatry 2003; 160:924–932. [DOI] [PubMed] [Google Scholar]
- 25.2012; Liu Y. The research in coal mine disaster survivors with post-traumatic stress disorder based on multi-modality MRI. R7495. [Google Scholar]
- 26.Koenigs M, Grafman J. Posttraumatic stress disorder: the role of medial prefrontal cortex and amygdala. Neuroscientist 2009; 15:540–548. [DOI] [PMC free article] [PubMed] [Google Scholar]
- 27.Chao LL, Lenoci M, Neylan TC. Effects of post-traumatic stress disorder on occipital lobe function and structure. Neuroreport 2012; 23:412–419. [DOI] [PubMed] [Google Scholar]
- 28.Baldaçara L, Jackowski AP, Schoedl A, et al. Reduced cerebellar left hemisphere and vermal volume in adults with PTSD from a community sample. J Psychiatr Res 2011; 45:1627–1630. [DOI] [PubMed] [Google Scholar]
- 29.Gilbertson MW, Shenton ME, Ciszewski A, et al. Smaller hippocampal volume predicts pathologic vulnerability to psychological trauma. Nat Neurosci 2002; 5:1242–1247. [DOI] [PMC free article] [PubMed] [Google Scholar]
- 30.Schaller BJ. Strategies for molecular imaging dementia and neurodegenerative diseases. Neuropsychiatr Dis Treat 2008; 4:585–612. [DOI] [PMC free article] [PubMed] [Google Scholar]
- 31.Shin LM, McNally RJ, Kosslyn SM, et al. Regional cerebral blood flow during script-driven imagery in childhood sexual abuse-related PTSD: a PET investigation. Neuropsychobiology 2001; 43:260–264. [DOI] [PubMed] [Google Scholar]