Supplemental Digital Content is available in the text
Abstract
Several recipient biomarkers are reported to predict graft dysfunction, but these are not useful in decision making for the acceptance or allocation of deceased donor kidneys; thus, it is necessary to develop donor biomarkers predictive of graft dysfunction. To address this issue, we prospectively enrolled 94 deceased donors and their 109 recipients who underwent transplantation between 2010 and 2013 at 4 Korean transplantation centers. We investigated the predictive values of donor urinary neutrophil gelatinase-associated lipocalin (NGAL), kidney injury molecule-1 (KIM-1), and L-type fatty acid binding protein (L-FABP) for reduced graft function (RGF). We also developed a prediction model of RGF using these donor biomarkers. RGF was defined as delayed or slow graft function. Multiple logistic regression analysis was used to generate a prediction model, which was internally validated using a bootstrapping method. Multiple linear regression analysis was used to assess the association of biomarkers with 1-year graft function. Notably, donor urinary NGAL levels were associated with donor AKI (P = 0.014), and donor urinary NGAL and L-FABP were predictive for RGF, with area under the receiver-operating characteristic curves (AUROC) of 0.758 and 0.704 for NGAL and L-FABP, respectively. The best-fit model including donor urinary NGAL, L-FABP, and serum creatinine conveyed a better predictive value for RGF than donor serum creatinine alone (P = 0.02). In addition, we generated a scoring method to predict RGF based on donor urinary NGAL, L-FABP, and serum creatinine levels. Diagnostic performance of the RGF prediction score (AUROC 0.808) was significantly better than that of the DGF calculator (AUROC 0.627) and the kidney donor profile index (AUROC 0.606). Donor urinary L-FABP levels were also predictive of 1-year graft function (P = 0.005). Collectively, these findings suggest donor urinary NGAL and L-FABP to be useful biomarkers for RGF, and support the use of a new scoring system based on donor biomarkers to facilitate decision-making in acceptance and allocation of deceased donor kidneys and contribute to maximal organ utilization.
INTRODUCTION
The number of end-stage renal disease patients on the waiting lists for deceased donor kidney transplantation (DDKT) has grown extensively while that of available kidneys remains static. As a result, the waiting time for DDKT is increasing. Several strategies have been developed to increase the supply of organs, including the use of suboptimal donors – such as expanded criteria donors (ECDs). However, donors with acute kidney injury (AKI) at the time of organ procurement are often rejected for kidney transplantation because of variable outcomes. The quality of the donor kidney affects short- and long-term allograft outcomes.1,2 Although various algorithms or scoring systems have been developed to evaluate kidneys from deceased donors,3–8 arbitrary risk categorizations, unclear decision thresholds, excessive variables, and small differences in overall scores limit their usefulness. Serum creatinine or estimated glomerular filtration rate (eGFR) are commonly considered as assessment tools for evaluating deceased donor kidneys; however, during AKI, these levels do not represent the steady-state, and these values do not predict posttransplant outcomes very well.9,10
Recently, new biomarkers such as urinary neutrophil gelatinase-associated lipocalin (uNGAL), urinary kidney injury molecule-1 (uKIM-1), and urinary L-type fatty acid-binding protein (uL-FABP) reflecting early pathological processes have been developed for the early diagnosis of AKI or ischemic injury.11–16 Several attempts have been made to use recipient biomarker data for the prediction of graft dysfunction.9,14,16–18 However, surveying recipient biomarkers is not useful in decision making for the acceptance or allocation of deceased donor kidneys before DDKT. In contrast, donor biomarker analysis could serve as a valuable assessment tool for the quality of donor kidneys because these reflect multiple potential events for donor kidney injuries before kidney donation. Early graft dysfunction – defined as delayed or slow graft function (SGF) – has increasingly occurred since kidneys from ECD and those with acute injuries were used.1 Early graft dysfunction is associated with a higher incidence of acute rejection, worse early posttransplant renal function, and poorer long-term graft survival.19–23 Therefore, we investigated the usefulness of donor uNGAL, uKIM-1, and uL-FABP levels in predicting early graft dysfunction. Additionally, we developed a prediction model of early graft dysfunction using these donor biomarkers.
METHODS
Patients
We prospectively enrolled deceased donors after brain death who successfully donated their kidneys between July 2010 and June 2013 at 4 Korean transplantation centers (Seoul National University Hospital, Chonbuk National University Hospital, Samsung Medical Center, and Inje University Busan Paik Hospital). All kidneys from the deceased donors were transplanted; however, 79 kidneys were delivered to hospitals that did not participate in this study. As a result, 94 deceased donors and 109 their recipients were enrolled. The Institutional Review Board approved the study protocol (H-1105-110-363), and informed consent was obtained from the legal guardians of donors. This study was performed in accordance with the Helsinki Declaration of 2000 and the Declaration of Istanbul 2008.
Data Collection
All clinical data were obtained from medical records. Donor renal function was evaluated at admission for organ donation and in the morning on the day of transplantation. eGFR was estimated using the Modification of Diet in Renal Disease (MDRD) equation for GFR24 in adults and the Schwartz equation25 in the 10 pediatric donors. ECDs were defined as previously described.26 Recipient renal function was evaluated on 1 week and 1, 3, 6, and 12 months posttransplantation. Acute rejection episodes were defined as either biopsy-proven rejection or clinically suspected acute rejection improved by empirical steroid pulse therapy. Allograft loss was defined as the need to return to dialysis. Early graft function was classified as delayed graft function (DGF) for recipients requiring dialysis within the 7 days after transplantation, SGF or immediate graft function (IGF) for patients with serum creatinine levels ≥2.5 mg/dL2 or ≤2.5 mg/dL without dialysis 7 days after transplantation, respectively. Several studies reported that not only patients with DGF but also patients with SGF showed worse short- and long-term outcomes than those with IGF, with the increased incidence of acute rejection in the first 6 months and a negative impact on long-term graft and patient survival rates.19–23 Therefore, we adopted reduced graft function (RGF) which includes DGF and SGF as our primary outcome.23 Donor AKI was defined on the basis of final serum creatinine as ≥2.0 mg/dL.27 The primary outcome was the incidence of RGF, and the secondary outcome was donor AKI and 1-year graft function.
Measurement of uNGAL, uKIM-1, and uL-FABP Levels
Pretransplant urine samples were obtained from all deceased donors at admission for organ donation and in the morning on the day of operation (D0). Fresh urine samples from both donors and recipients were immediately centrifuged at 5000 × g to remove insoluble elements. Aliquots of the supernatant were stored at −80 °C and thawed at 37 °C before analysis. Urine creatinine levels were measured by standard enzymatic methods with an automated analyzer. All donor biomarker values were normalized to urine creatinine levels.
Enzyme-linked immunosorbent assays (ELISAs) were performed in duplicate using the neutrophil gelatinase-associated lipocalin (NGAL) ELISA kit (BioPorto Diagnostics, Gentofte, Denmark), the human TIM-1/kidney injury molecule-1(KIM-1)/HAVCR Quantikine ELISA kit (R&D System, Minneapolis, MN), and the L-type fatty acid-binding protein (L-FABP) human ELISA kit (Hycult, Biotech, Uden, The Netherlands).
Immunohistochemical Staining for NGAL, KIM-1, and L-FABP
Zero time (D0) protocol biopsies were performed before perfusion and collected at 1 center. Specimens were graded according to the Banff’ 2007 classification.28 Renal graft tissue immunostaining was performed with antibodies against NGAL (Sigma Aldrich, St. Louis, MO), KIM-1 (R&D Systems), and L-FABP (R&D Systems). Their expression levels were evaluated based on the proportion of immunopositive cells in the total tubular area as previously described.14,15,29
Statistical Analysis
Chi-squared tests were used for categorical variables and Student's t-tests were used for continuous variables. Mann–Whitney U-tests were used for continuous variables with a skewed distribution. Correlations between urine biomarkers and continuous variables were assessed by Spearman correlation. The relationship between biomarkers and donor AKI was analyzed by multiple logistic regression analyses. Multiple linear regression analysis with a stepwise variable selection was used to assess the relationship between biomarkers and eGFR at 1 year after transplantation. The diagnostic performances of biomarkers to predict RGF were evaluated by receiver-operating characteristic (ROC) curves analyses. Multiple logistic regression analyses with a backward variable selection were used to assess the association between biomarkers and RGF in the presence of covariates and to produce the best-fit model for predicting RGF. First, we produced a full model including biomarkers and all relevant clinical factors as covariates. Then, we estimated Akaike information criterion in the each model of the backward selection process, and reduced the model until Akaike information criterion no longer improved to minimize the overfitting of the models and select the best-fit model.30 Validation and calibration of the best-fit model were performed, internally in the full model with 1000 bootstrap resamples drawn using the 0.632 bootstrap resampling technique.31,32 The bootstrap resampling technique is an effective technique for internal validation and calibration of a prediction model.31 Validation and calibration using bootstrap resampling would estimate the likely performance of the model on a new sample of patients from a similar clinical setting, and measure the degree of error between the predictive probability and observed probability of the model. The estimate of optimism and the amounts of errors between the predicted probability and the actual probability of RGF in the best-fit model were calculated through the validation and calibration procedure previously described.33
The RGF prediction score was established using the best-fit model, and the nomogram points for the score were depicted proportionally to the unstandardized β coefficients of the significant predictors in the best-fit model. The points of all significant predictors were summed to a total point. ROC curve analyses were used to assess diagnostic performances of the score and the cut-off point for RGF occurrence was determined using the Youden-J index. The goodness of fit of the scoring method was determined by Hosmer–Lemeshow test and Levenberg–Marquardt nonlinear regression analysis. The diagnostic performance of the score was compared with that of the kidney donor profile index (KDPI)34 and the DGF risk calculator7 using the DeLong test.35 All statistical analyses were performed using R.v.3.1.3 for Windows and designated R packages including rms, pROC, ROCR and OptimalCutpoints for logistic regression analysis, validation, calibration, identifying optimal cut-off values, and comparisons between ROC curves.
RESULTS
Characteristics of the Study Population
The multicenter, prospective, and observational study enrolled 94 deceased donors and 109 corresponding recipients. The clinical characteristics of the donors are shown in Table 1, recipient characteristics and transplantation details are summarized in Table 2. Ten pediatric donors (14–20 years old) were included, and there was no en bloc transplantation. DGF and SGF occurred in 15.6% and 4.6% of recipients, respectively. The overall 1-year patient and graft survival rate was 99.1%, and 95.4%, respectively. Acute rejection occurred in 21.1% of recipients. Mean cold ischemic time was 177 minutes, which was markedly shorter than that in other western countries.
TABLE 1.
Baseline Characteristics of Donors
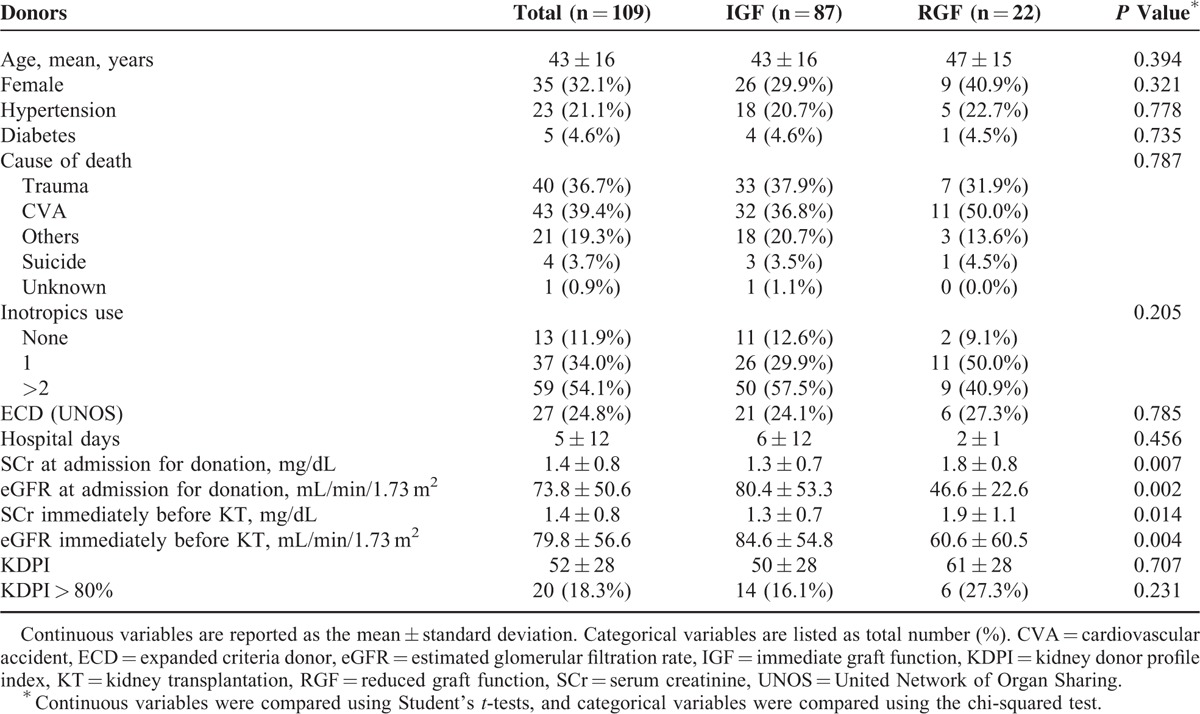
TABLE 2.
Baseline Characteristics of Recipient
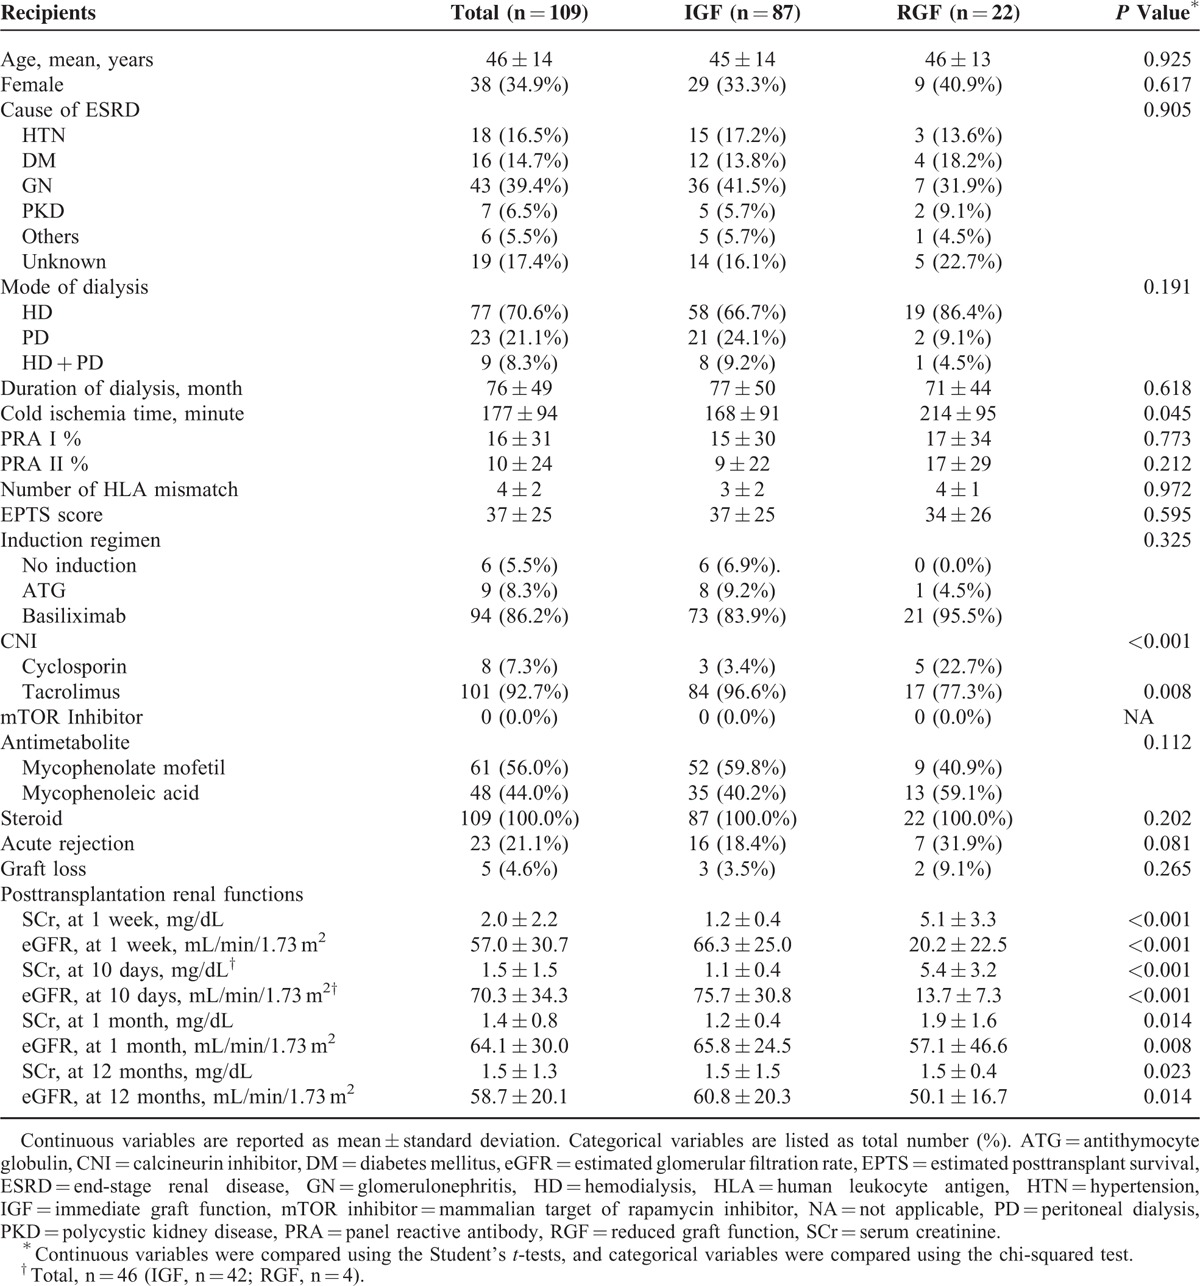
The renal function of donors at admission for organ donation and D0 was significantly lower in the RGF group than in the IGF group (Table 1). Cold ischemic time was longer, and tacrolimus was used less often in the RGF group than in the IGF group (Table 2). Posttransplant renal functions during the 1st year after transplantation were also significantly worse in the RGF group than in the IGF group (Table 2). However, there were no significant differences between the RGF group and the IGF group in other characteristics of donor, recipient, or transplantation-related characteristics (Tables 1 and 2).
Expression of Biomarkers in D0 Protocol Biopsies
D0 protocol biopsies were collected from 46 recipients. There were no abnormalities in 80.4% of patients. Mild interstitial infiltration and acute tubular necrosis were found in 2.2% and 8.7% of patients, respectively. No significant difference in Remuzzi score was observed between the RGF and the IGF groups (data not shown).36
NGAL, KIM-1, and L-FABP were detected in 66.7%, 14.3%, and 95.2% of samples, respectively (Supplemental Figure 1). Overall, 90.5% of the samples had a KIM-1 expression score of 0.5, 81.0% had a score of 1, 66.7% had a score of 2, and 14.3% had a score of 3. However, tubular expression of NGAL, KIM-1, or L-FABP was not significantly different between the RGF and IGF groups. Furthermore, no correlation was observed between renal function and NGAL or L-FABP staining intensity or KIM-1 score at any time point after transplantation.
Urine Biomarkers of Donors
Donor uNGAL and uL-FABP levels were significantly higher in the RGF group than in the IGF group at admission for organ donation and D0; however, the statistical strength of associations at admission for organ donation was lower than those at D0 (Table 3). Furthermore, both uNGAL at D0 (r = −0.419, P < 0.001) and uL-FABP at D0 (r = −0.190, P = 0.048) were correlated with donor eGFR at D0. Moreover, donor uNGAL, uKIM-1, and uL-FABP levels were not affected by donor age, donor history of hypertension, recipient gender, duration of dialysis, recipient body mass index (BMI), recipient diabetes, or immunosuppressant use (data not shown).
TABLE 3.
Comparison of Urinary Biomarkers Between the Immediate Graft Function Group and the Reduced Graft Function Group

Association of Biomarkers with Donor Acute Kidney Injury
Before transplantation, 18% of donors had AKI on the basis of final serum creatinine level.27 In univariate logistic regression analyses, uNGAL at D0 was significantly associated with donor AKI (odds ratio [OR] 2.22, 95% confidence interval [CI] 1.13–4.37, P = 0.021). Neither uKIM-1 at D0 nor uL-FABP at D0 was associated with donor AKI in univariate analyses (OR 1.32, 95% CI 0.44–3.98, P = 0.624 and OR 1.18, 95% CI 0.50–2.78, P = 0.700, respectively). Multiple logistic regression analyses adjusted for donor age, donor height, donor weight, history of hypertension, history of diabetes, and stroke as cause of death37 showed that donor uNGAL was also significantly associated with donor AKI (OR 8.99, 95% CI 1.25–7.14, P = 0.014).
Predictive Performances of Biomarkers for RGF
The diagnostic performances of biomarkers for predicting RGF was assessed using ROC curve analysis. uNGAL, uL-FABP, and donor serum creatinine levels at D0 were significant predictors of RGF, whereas uKIM-1 was not (Figure 1). Diagnostic performance of uNGAL (area under the receiver-operating characteristic curves [AUROC] = 0.758, 95% CI 0.645–0.871) and uL-FABP (AUROC = 0.704, 95% CI 0.592–0.817) were slightly larger than that for serum creatinine (AUROC = 0.670, 95% CI 0.531–0.808), but the differences were not significant (uNGAL vs serum creatinine, P = 0.330; uL-FABP vs serum creatinine, P = 0.730; DeLong test).
FIGURE 1.
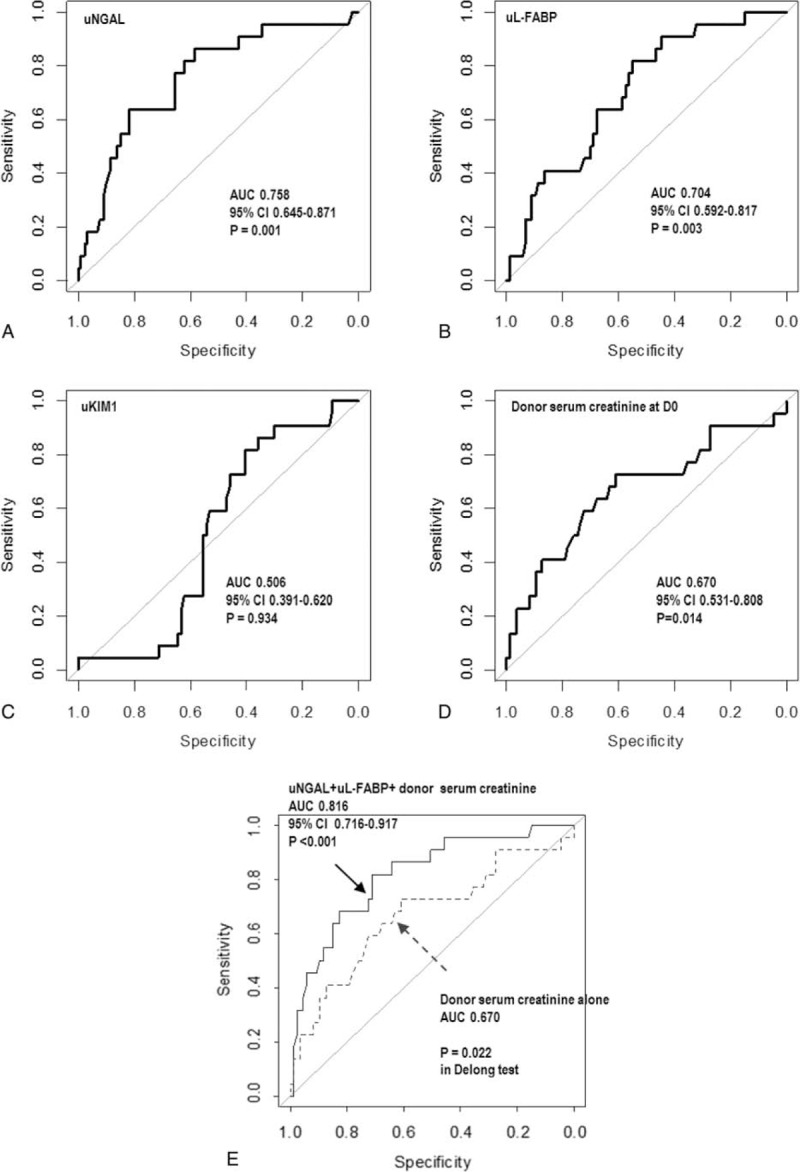
The ROC curve indicating performance for donor biomarkers at D0 in discriminating between patients with immediate graft function and reduced graft function. The ROC curves of uNGAL at D0 (A), urine uL-FABP at D0 (B), uKIM-1 at D0 (C), and serum creatinine at D0 (D). (E) The ROC curve of the model including donor uNGAL, donor uL-FABP, and serum creatinine of donor at D0. The 95% CI is shown. Diagnostic performance of the best-fit model including uNGAL, uL-FABP, and serum creatinine (solid line) was significantly better than that of the model including serum creatinine alone (dashed line) (P = 0.022; DeLong test). CI = confidence interval, ROC = receiver-operating characteristic, uKIM-1 = urinary kidney injury molecule-1, uL-FABP = L-type fatty acid-binding protein, uNGAL = urinary neutrophil gelatinase-associated lipocalin.
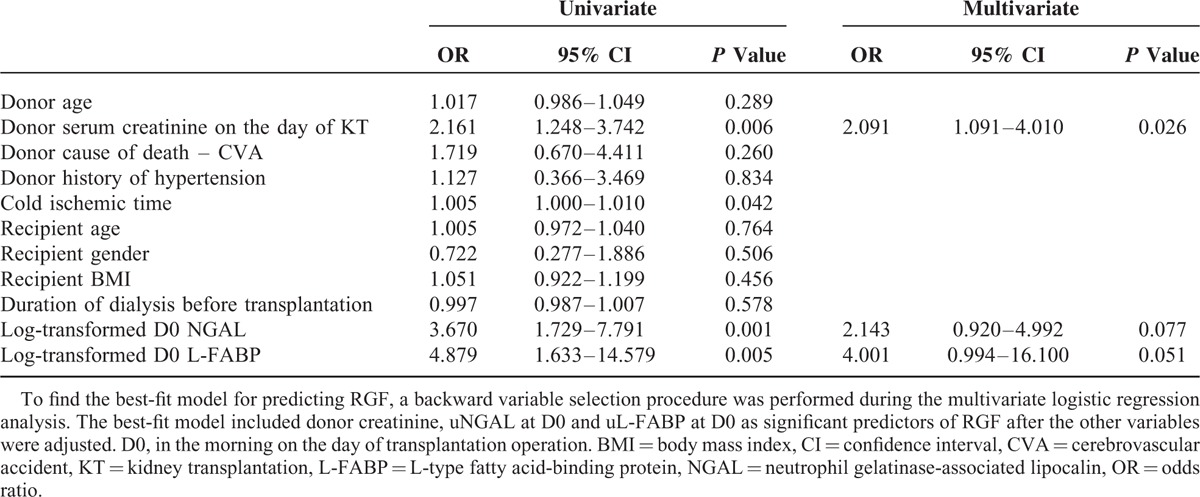
To evaluate the usefulness of the donor biomarkers as pretransplant RGF predictors, we generated a prediction model that included donor biomarkers and other relevant clinical factors already known to be predictive for RGF.4–7,34 Univariate logistic regression analyses showed that donor serum creatinine, cold ischemic time, and uNGAL and uL-FABP at D0 were significantly associated with RGF. Multivariate logistic regression analysis demonstrated that the reduced best-fit model still included donor serum creatinine, and uNGAL and uL-FABP at D0 as RGF predictors after other variables were adjusted (Table 4).
TABLE 4.
Univariate and Multivariate Logistic Regression Analyses for the Predictors of Reduced Graft Function
Validation of the Model Including Biomarkers for RGF
Using predictors relatively associated with RGF as indicated by the multivariate logistic regression analysis, we performed ROC curve analysis to assess the diagnostic performance of the best-fit model for RGF development. The AUROC of the best-fit model was 0.816 (95% CI 0.716–0.917, P < 0.001), which was significantly better than the diagnostic performance of donor creatinine alone for RGF (Figure 1E, Table 4). Validation of the best-fit model with 1000 bootstrap resamples showed that the estimate of optimism was 0.064 and the bias-adjusted AUROC of the best-fit model was 0.752 (Supplemental Figure 2). The estimates of both models were generally linear and agreed well with the ideal line. The mean absolute error and 0.9 quantile absolute error of the predicted probability were 0.029 and 0.039, respectively, suggesting only a small degree of bias from overfitting.
Prediction Score for RGF
Using the best-fit model, we generated a nomogram for a scoring method predictive for RGF (Figure 2, Table 5). uNGAL and uL-FABP were log10-transformed before they were included in the model. The prediction score ranged from 0 to 220. The AUROC of the prediction score was 0.808 (95% CI 0.707–0.909, P < 0.001). We compared our model with other well-known models, including the DGF calculator7 and KDPI.34 Notably, the AUROCs of the DGF calculator and KDPI for predicting RGF were 0.627 (95% CI 0.481–0.772, P = 0.016) and 0.606 (95% CI 0.471–0.740, P = 0.190), respectively. The diagnostic performance of the RGF prediction score was significantly better than those for both the DGF calculator and KDPI (P = 0.046 and 0.019, respectively; DeLong tests). The optimal cut-off value of the prediction score was ≥144 points, as determined by the maximum values of the Youden-J indexes. The sensitivity and the specificity of the prediction score at this value were 86.4% and 65.5%, respectively. Since the prevalence of RGF was 20.2%, the positive and negative predictive values of the prediction score were 38.7% and 95.0%, respectively (Figure 3). The Hosmer–Lemeshow goodness-of-fit test showed a P value of 0.85 for the prediction score. When the patients were equally divided into 5 groups based on their prediction score, the observed probability of RGF corresponding to the average prediction score of each group was also well-matched with the probability predicted from the average prediction score (Levenberg–Marquardt nonlinear regression coefficient R2 = 0.967; Figure 3).
FIGURE 2.
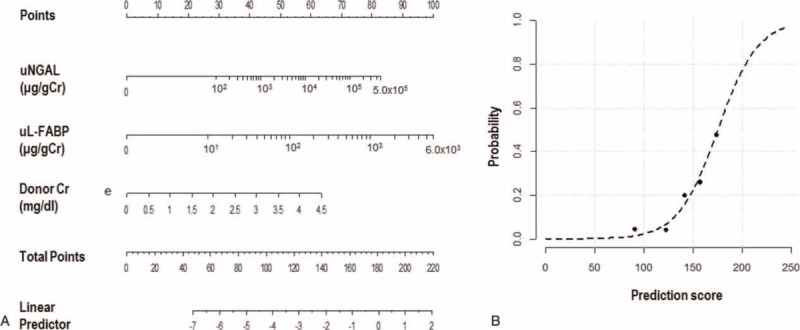
The prediction score of RGF. (A) The prediction score included donor uNGAL, uL-FABP, and serum creatinine. The score for each patient was the sum of the points designated to the 3 predictors. The gradations between 2 numbers in the rulers designated to uNGAL and uL-FABP equally divided the differences between the 2 numbers (e.g., the gradation next to 102 indicates 2 × 10²). (B) Goodness of fit of the prediction score for RGF. The dashed line indicates the predicted probability according to the score, and the black dots indicate the observed frequency of the RGF at the mean scores of each quintile. The observed frequency agreed well with the predicted probability according to the score. (Levenberg–Marquardt nonlinear regression coefficient R2 = 0.967). RGF = reduced graft function, uKIM-1 = urinary kidney injury molecule-1, uL-FABP = L-type fatty acid-binding protein, uNGAL = urinary neutrophil gelatinase-associated lipocalin.
TABLE 5.
Score for the Prediction of Reduced Graft Function
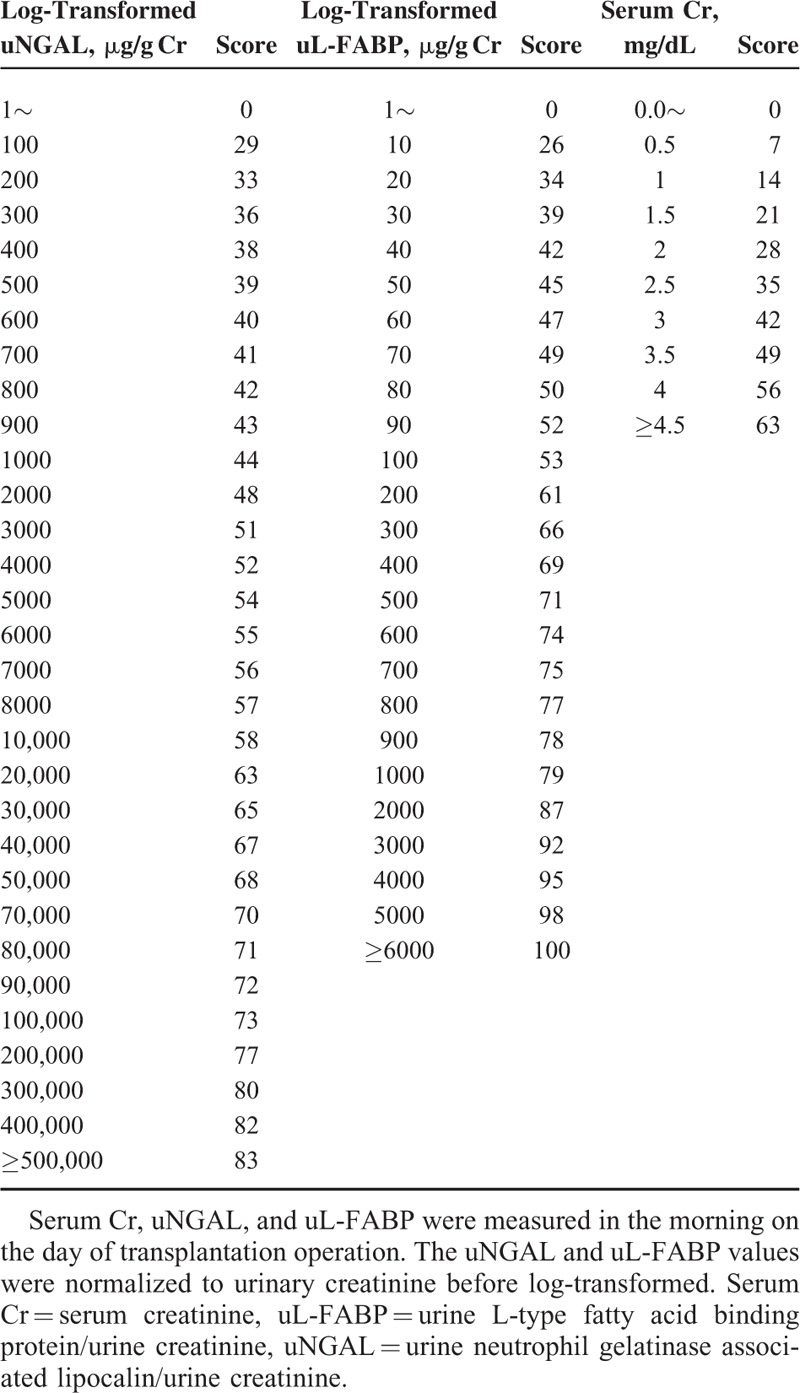
FIGURE 3.
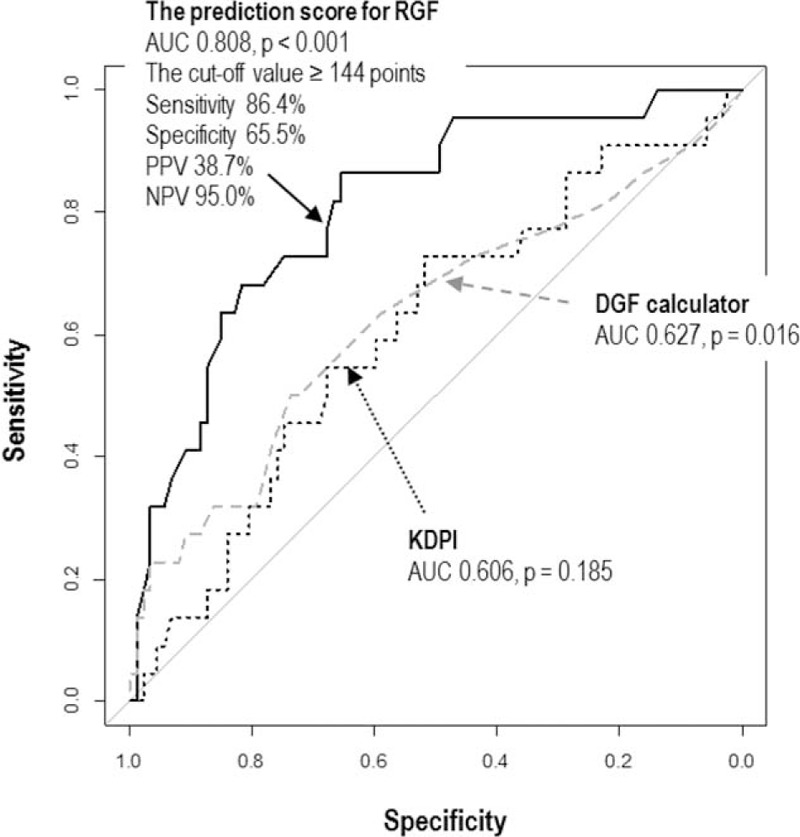
The ROC curves comparing the prognostic capacity of the prediction score with other tools. (A) Score for prediction of RGF (black solid line), (B) DGF risk calculator (gray dashed line), and (C) KDPI (black dotted line). The 95% CI is shown. The area under the ROC curve of the prediction score for RGF is significantly larger than those of the DGF calculator (P = 0.046; DeLong tests) and the KDPI (P = 0.019; DeLong tests). CI = confidence interval, DGF = delayed graft function, KDPI = kidney donor profile index, RGF = reduced graft function, ROC = receiver-operating characteristic,.
Predictive Performances of Biomarkers for Graft Function at 1 Year After Transplantation
The uNGAL levels at D0 were negatively correlated with eGFR at 3, 6, and 12 months after transplantation (r = −0.249, P = 0.01; r = −0.261, P = 0.007; and r = −0.193, P = 0.047, respectively). The uL-FABP levels at D0 were negatively correlated with eGFR at 1, 6, and 12 months after transplantation (r = −0.242, P = 0.012; r = −0.256, P = 0.008; and r = −0.343, P < 0.001, respectively).
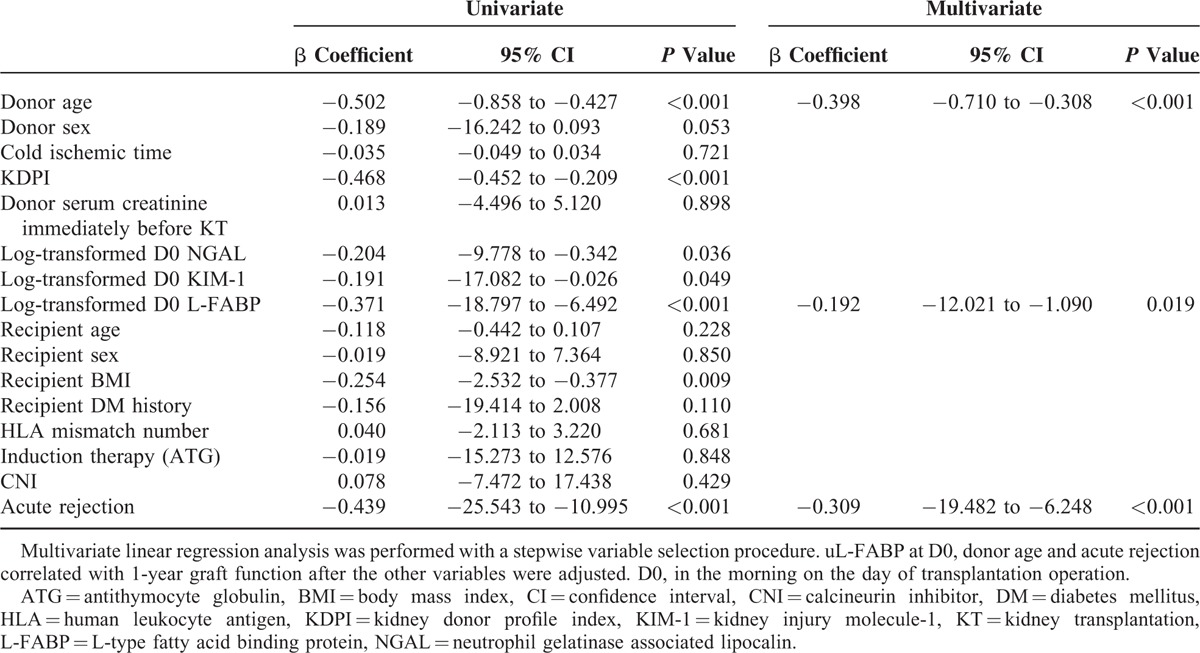
In the univariate linear regression analyses, donor age, KDPI, recipient BMI, acute rejection, uNGAL at D0, uKIM-1 at D0, and uL-FABP at D0 were significantly associated with 1-year eGFR. Multiple linear regression analyses adjusting for donor age, donor gender, KDPI, cold ischemic time, recipient age, recipient gender, recipient BMI, recipient diabetes history, number of HLA mismatches, induction therapy, use of calcineurin inhibitor, acute rejection, and donor urinary biomarkers at D0 showed that donor uL-FABP, donor age, and acute rejection were significant predictors of 1-year graft function (Table 6).
TABLE 6.
Univariate and Multivariate Linear Regression Analyses for the Prediction of 1-year Graft Function
DISCUSSION
Both uNGAL and uL-FABP of donors were reliable for RGF prediction and correlated with donor renal function. The best-fit model including donor uNGAL, uL-FABP, and serum creatinine at D0 provided better predictive values for RGF than donor serum creatinine alone. Based on the best-fit model, we generated a nomogram for predicting RGF. The diagnostic performance of the prediction score for RGF was significantly better than those for the DGF calculator and KDPI. Donor urinary NGAL levels at D0 were also associated with donor AKI. Furthermore, uL-FABP at D0 was predictive for 1-year allograft function.
Because of organ shortages, kidneys from deceased donors with high risk for graft dysfunction and graft failure have been increasingly used.1,2 Patients with RGF, including DGF or SGF, showed poorer short- and long-term outcomes than those with IGF, with a higher incidence of acute rejection episode, diminished posttransplant graft function, and an increased risk of graft failure.19–23 Therefore, it is important to predict graft dysfunction with an early and reliable biomarker when determining the acceptance or allocation of deceased donor kidneys. Several studies have identified early biomarkers for predicting graft dysfunction.9,12,14,16–18 Urinary biomarkers directly reflect tubule damage in kidneys, and sampling is easy and noninvasive. The recipient urinary NGAL levels within the 1st week after transplantation are an early marker of DGF and are independently associated with 1-year graft function.9 The recipient urinary L-FABP level can serve as an early indicator of ischemia and a predictor of early allograft function.17 However, while previous studies have demonstrated the prognostic value of recipient urinary biomarkers for DGF,9,17 these cannot be used to assess deceased donor kidneys with AKI before DDKT. Therefore, there is still a need for good donor markers.
A recent study reported that the uNGAL levels in AKI group were higher than those in non-AKI group in stable hospitalized patients awaiting cardiac surgery.38 Reese et al37 also showed a significant association between donor urinary NGAL and donor AKI. Thus, our findings on the association between donor uNGAL levels and donor AKI are in agreement with these previous studies.37,38 Based on the previous studies, donor urinary biomarker reflected the multiple potential pathways associated with acute kidney injuries including trauma, hypotension, and exposure to nephrotoxic agents.
Recently, Hollmen et al12 investigated the prognostic value of the uNGAL levels in deceased donors for the 1st time. In patients with high donor uNGAL (≥18 ng/mL), prolonged DGF (≥14 days) occurred more often than in those with low uNGAL (<18 ng/mL), and 1-year graft survival was worse. uNGAL was an independent risk factor for prolonged DGF, but failed to predict DGF itself. Reese et al37 also analyzed the associations between biomarkers in deceased donors and outcomes including donor AKI, DGF, and 6-month eGFR. Notably, uNGAL, uKIM-1, and uL-FABP in donors were strongly associated with donor AKI, and uNGAL was associated with DGF. Furthermore, both uNGAL and uL-FABP were associated with 6-month eGFR only among recipients without DGF. In this study, DGF incidence was lower (15.6%) than those in the previous studies (31%–39.8%), most likely because both donors and recipients were younger, ECDs were less common, and cold ischemic time was shorter.12,37 We used RGF as an outcome in this study due to this low DGF incidence. In contrast, the duration of dialysis before transplantation was longer, donor serum creatinine was higher, and uNGAL levels were higher in this study. Both the D0 biopsy findings and 1-year graft survival rates were similar between this study and the study by Hollmen et al.12 Despite differences in donor characteristics of each study population or country, our findings that donor uNGAL or uL-FABP can be associated with donor AKI, as well as predict RGF and posttransplant graft function were in agreement with those of previous studies.12,37 As such, donor urinary biomarkers, including uNGAL and uL-FABP, may sufficiently predict posttransplant graft outcomes irrespective of DGF incidence.
KIM-1 levels in recipients have been reported to correlate with renal graft function.16,18 However, the prognostic values of KIM-1 were modest, and the combination of KIM-1 with other biomarkers rather than KIM-1 alone showed a strong ability to predict AKI.39 This study demonstrated that donor uKIM-1 failed to predict RGF or correlate with 1-year allograft function. KIM-1 is upregulated at 48 hours after ischemia-reperfusion injury and peaks at 2–3 days after injury, persisting thereafter.40 Both uNGAL and uL-FAPB are elevated within 3 hours of injury, and peak within 6 hours.41 Although the increased levels of NGAL and L-FABP represent a response to kidney injury, increased KIM-1 might indicate ongoing recovery and regeneration after injury. These differences may have contributed to the poor predictability of uKIM-1 for RGF in contrast to uNGAL and uL-FABP.
Increased NGAL expression in renal allograft tissues was associated with poor graft function after transplantation,14 whereas KIM-1 did not predict DGF.29 In this study, tissue biomarkers expression in D0 biopsies did not discriminate between patients with RGF and IGF. Superficial wedge biopsy sampling often results in markedly variable samples, and hamper the evaluation of injuries in the outer medulla, the main area of acute injury. Thus, relatively mild tissue injury and the lower sample sizes of this study might contribute to the negative results for tissue biomarkers.
We further proposed a simple scoring system to predict RGF based on only 3 donor parameters available before transplantation, which were selected based on their contribution to the AUROC and P value. The diagnostic performance of the RGF prediction score was better than that for the DGF calculator and KDPI. Additionally, we proposed additional cutoffs for medical decision-making based on these predictive values. Among kidneys with a prediction score for RGF < 144, 95% will likely have IGF after KT. This information could be useful for clinicians when deciding whether to accept or discard a donor kidney and when deciding to whom the kidney should be allocated.
In this study, donor urine biomarkers were measured at admission and in the morning on the day of operation. Because donors may experience several kidney injuries, including trauma, hypotension, and exposure to nephrotoxic agents, before and during hospitalization, biomarker levels on the day of operation may be better to assess the quality of the donor kidney than those obtained at admission. However, biomarker levels on the day of operation might be impractical for organ allocation decision. Unfortunately, we did not evaluate the exact longitudinal changes of donor biomarkers between the time of admission and organ procurement; thus, further longitudinal studies are needed to decide the best time-point for the measurement of donor urinary biomarkers.
To our knowledge, this study is the 1st to investigate the association of donor urinary and tissue biomarkers with RGF and 1-year graft function in DDKT, and introduce a practical scoring method including donor urinary biomarkers to predict RGF. This study is also unique in that it was based on an Asian population with short cold ischemic times and a low overall incidence of DGF, unlike Western populations investigated in previous studies. Further, larger-scale, long-term studies including external validation are needed to confirm our results.
In conclusion, both urinary NGAL and L-FABP of donors are useful biomarkers for RGF after DDKT, and a new score based on donor biomarkers can predict RGF well. The prediction score for RGF can help guide allocation of deceased donors, and acceptance of kidneys from deceased donors by clinicians and transplant candidates, and can contribute to maximal organ utilization.
Supplementary Material
Acknowledgements
The authors thank Myung-gyu Kim and Han Ro for their critical review of the manuscript; and also thank the Biobank of Chonbuk National University Hospital, a member of the Korea Biobank Network, which is supported by the Ministry of Health, Welfare and Family Affairs, for providing samples.
Footnotes
Abbreviations: AKI = acute kidney injury, AUROC = area under the receiver-operating characteristic curves, BMI = body mass index, CI = confidence interval, DDKT = deceased donor kidney transplantation, DGF = delayed graft function, ECD = expanded criteria donor, IGF = immediate graft function, KDPI = kidney donor profile index, KIM-1 = kidney injury molecule-1, L-FABP = L-type fatty acid-binding protein, NGAL = neutrophil gelatinase-associated lipocalin, RGF = reduced graft function, ROC = receiver-operating characteristic, SGF = slow graft function, uKIM-1 = urinary kidney injury molecule-1, uL-FABP = urinary L-type fatty acid-binding protein, uNGAL = urinary neutrophil gelatinase-associated lipocalin
This research was supported by Basic Science Research Program through the National Research Foundation of Korea (NRF) funded by the Ministry of Science, ICT and Future Planning (2012R1A1A2003471), and a grant from the SK Telecom Research Fund (3420130130).
The study sponsors did not participate in any aspect of this study.
The authors have no conflicts of interest to disclose.
Supplemental Digital Content is available for this article.
REFERENCES
- 1.Port FK, Bragg-Gresham JL, Metzger RA, et al. Donor characteristics associated with reduced graft survival: an approach to expanding the pool of kidney donors. Transplantation 2002; 74:1281–1286. [DOI] [PubMed] [Google Scholar]
- 2.Zeraati AA, Naghibi M, Kianoush S, et al. Impact of slow and delayed graft function on kidney graft survival between various subgroups among renal transplant patients. Transplant Proc 2009; 41:2777–2780. [DOI] [PubMed] [Google Scholar]
- 3.Nyberg SL, Matas AJ, Rogers M, et al. Donor scoring system for cadaveric renal transplantation. Am J Transplant 2001; 1:162–170. [PubMed] [Google Scholar]
- 4.Nyberg SL, Matas AJ, Kremers WK, et al. Improved scoring system to assess adult donors for cadaver renal transplantation. Am J Transplant 2003; 3:715–721. [DOI] [PubMed] [Google Scholar]
- 5.Schold JD, Kaplan B, Baliga RS, et al. The broad spectrum of quality in deceased donor kidneys. Am J Transplant 2005; 5 (4 Pt 1):757–765. [DOI] [PubMed] [Google Scholar]
- 6.Irish WD, McCollum DA, Tesi RJ, et al. Nomogram for predicting the likelihood of delayed graft function in adult cadaveric renal transplant recipients. J Am Soc Nephrol 2003; 14:2967–2974. [DOI] [PubMed] [Google Scholar]
- 7.Irish WD, Ilsley JN, Schnitzler MA, et al. A risk prediction model for delayed graft function in the current era of deceased donor renal transplantation. Am J Transplant 2010; 10:2279–2286. [DOI] [PubMed] [Google Scholar]
- 8.Israni AK, Salkowski N, Gustafson S, et al. New national allocation policy for deceased donor kidneys in the United States and possible effect on patient outcomes. J Am Soc Nephrol 2014; 25:1842–1848. [DOI] [PMC free article] [PubMed] [Google Scholar]
- 9.Fonseca I, Oliveira JC, Almeida M, et al. Neutrophil gelatinase-associated lipocalin in kidney transplantation is an early marker of graft dysfunction and is associated with one-year renal function. J Transplant 2013; 2013:650123. [DOI] [PMC free article] [PubMed] [Google Scholar]
- 10.Hall IE, Yarlagadda SG, Coca SG, et al. IL-18 and urinary NGAL predict dialysis and graft recovery after kidney transplantation. J Am Soc Nephrol 2010; 21:189–197. [DOI] [PMC free article] [PubMed] [Google Scholar]
- 11.Hall IE, Doshi MD, Poggio ED, et al. A comparison of alternative serum biomarkers with creatinine for predicting allograft function after kidney transplantation. Transplantation 2011; 91:48–56. [DOI] [PubMed] [Google Scholar]
- 12.Hollmen ME, Kyllonen LE, Inkinen KA, et al. Deceased donor neutrophil gelatinase-associated lipocalin and delayed graft function after kidney transplantation: a prospective study. Crit Care 2011; 15:R121. [DOI] [PMC free article] [PubMed] [Google Scholar]
- 13.Zhang PL, Rothblum LI, Han WK, et al. Kidney injury molecule-1 expression in transplant biopsies is a sensitive measure of cell injury. Kidney Int 2008; 73:608–614. [DOI] [PMC free article] [PubMed] [Google Scholar]
- 14.Mishra J, Ma Q, Kelly C, et al. Kidney NGAL is a novel early marker of acute injury following transplantation. Pediatr Nephrol 2006; 21:856–863. [DOI] [PubMed] [Google Scholar]
- 15.Yamamoto T, Noiri E, Ono Y, et al. Renal L-type fatty acid-binding protein in acute ischemic injury. J Am Soc Nephrol 2007; 18:2894–2902. [DOI] [PubMed] [Google Scholar]
- 16.Sureshkumar KK, Marcus RJ. Urinary biomarkers as predictors of long-term allograft function after renal transplantation. Transplantation 2010; 90:688–689. [DOI] [PubMed] [Google Scholar]
- 17.Pajek J, Skoberne A, Sosteric K, et al. Non-inferiority of creatinine excretion rate to urinary L-FABP and NGAL as predictors of early renal allograft function. BMC Nephrol 2014; 15:117. [DOI] [PMC free article] [PubMed] [Google Scholar]
- 18.Malyszko J, Koc-Zorawska E, Malyszko JS, et al. Kidney injury molecule-1 correlates with kidney function in renal allograft recipients. Transplant Proc 2010; 42:3957–3959. [DOI] [PubMed] [Google Scholar]
- 19.Park JH, Yang CW, Kim YS, et al. Comparisons of clinicopathological correlations between immediate and slow graft function in renal transplant recipients. Clin Transplant 2002; 16 Suppl 8:18–23. [DOI] [PubMed] [Google Scholar]
- 20.Humar A, Ramcharan T, Kandaswamy R, et al. Risk factors for slow graft function after kidney transplants: a multivariate analysis. Clin Transplant 2002; 16:425–429. [DOI] [PubMed] [Google Scholar]
- 21.Rodrigo E, Fernandez-Fresnedo G, Ruiz JC, et al. Similar impact of slow and delayed graft function on renal allograft outcome and function. Transplant Proc 2005; 37:1431–1432. [DOI] [PubMed] [Google Scholar]
- 22.Lee SY, Chung BH, Piao SG, et al. Clinical significance of slow recovery of graft function in living donor kidney transplantation. Transplantation 2010; 90:38–43. [DOI] [PubMed] [Google Scholar]
- 23.Johnston O, O’Kelly P, Spencer S, et al. Reduced graft function (with or without dialysis) vs immediate graft function – a comparison of long-term renal allograft survival. Nephrol Dial Transplant 2006; 21:2270–2274. [DOI] [PubMed] [Google Scholar]
- 24.Levey AS, Bosch JP, Lewis JB, et al. A more accurate method to estimate glomerular filtration rate from serum creatinine: a new prediction equation. Modification of Diet in Renal Disease Study Group. Ann Intern Med 1999; 130:461–470. [DOI] [PubMed] [Google Scholar]
- 25.Schwartz GJ, Haycock GB, Edelmann CM, Jr, et al. A simple estimate of glomerular filtration rate in children derived from body length and plasma creatinine. Pediatrics 1976; 58:259–263. [PubMed] [Google Scholar]
- 26.Metzger RA, Delmonico FL, Feng S, et al. Expanded criteria donors for kidney transplantation. Am J Transplant 2003; 3 Suppl 4:114–125. [DOI] [PubMed] [Google Scholar]
- 27.Kayler LK, Garzon P, Magliocca J, et al. Outcomes and utilization of kidneys from deceased donors with acute kidney injury. Am J Transplant 2009; 9:367–373. [DOI] [PubMed] [Google Scholar]
- 28.Solez K, Colvin RB, Racusen LC, et al. Banff 07 classification of renal allograft pathology: updates and future directions. Am J Transplant 2008; 8:753–760. [DOI] [PubMed] [Google Scholar]
- 29.Schroppel B, Kruger B, Walsh L, et al. Tubular expression of KIM-1 does not predict delayed function after transplantation. J Am Soc Nephrol 2010; 21:536–542. [DOI] [PMC free article] [PubMed] [Google Scholar]
- 30.Akaike H. A new look at the statistical model identification. IEEE Trans Autom Contr 1974; 19:716–723. [Google Scholar]
- 31.Harrell FE. Regression Modeling Strategies: With Applications to Linear Models, Logistic Regression, and Survival Analysis. New York: Springer; 2001. [Google Scholar]
- 32.Efron B, Tibshirani R. Improvements on cross-validation: the .632+ bootstrap method. J Am Stat Assoc 1997; 92:548–560. [Google Scholar]
- 33.Lee Y, Shin JH, Park HC, et al. A prediction model for renal artery stenosis using carotid ultrasonography measurements in patients undergoing coronary angiography. BMC Nephrol 2014; 15:60. [DOI] [PMC free article] [PubMed] [Google Scholar]
- 34.Stahl CC, Wima K, Hanseman DJ, et al. Organ quality metrics are a poor predictor of costs and resource utilization in deceased donor kidney transplantation. Surgery 2015; 158:1635–1641. [DOI] [PMC free article] [PubMed] [Google Scholar]
- 35.Delong ER, Delong DM, Clarkepearson DI. Comparing the areas under 2 or more correlated receiver operating characteristic curves – a nonparametric approach. Biometrics 1988; 44:837–845. [PubMed] [Google Scholar]
- 36.Remuzzi G, Grinyo J, Ruggenenti P, et al. Early experience with dual kidney transplantation in adults using expanded donor criteria. Double Kidney Transplant Group (DKG). J Am Soc Nephrol 1999; 10:2591–2598. [DOI] [PubMed] [Google Scholar]
- 37.Reese PP, Hall IE, Weng FL, et al. Associations between deceased-donor urine injury biomarkers and kidney transplant outcomes. J Am Soc Nephrol 2015; [Epub ahead of print]. [DOI] [PMC free article] [PubMed] [Google Scholar]
- 38.Parikh CR, Devarajan P, Zappitelli M, et al. Postoperative biomarkers predict acute kidney injury and poor outcomes after pediatric cardiac surgery. J Am Soc Nephrol 2011; 22:1737–1747. [DOI] [PMC free article] [PubMed] [Google Scholar]
- 39.Arthur JM, Hill EG, Alge JL, et al. Evaluation of 32 urine biomarkers to predict the progression of acute kidney injury after cardiac surgery. Kidney Int 2014; 85:431–438. [DOI] [PMC free article] [PubMed] [Google Scholar]
- 40.Parikh CR, Thiessen-Philbrook H, Garg AX, et al. Performance of kidney injury molecule-1 and liver fatty acid-binding protein and combined biomarkers of AKI after cardiac surgery. Clin J Am Soc Nephrol 2013; 8:1079–1088. [DOI] [PMC free article] [PubMed] [Google Scholar]
- 41.Parikh CR, Coca SG, Thiessen-Philbrook H, et al. Postoperative biomarkers predict acute kidney injury and poor outcomes after adult cardiac surgery. J Am Soc Nephrol 2011; 22:1748–1757. [DOI] [PMC free article] [PubMed] [Google Scholar]
Associated Data
This section collects any data citations, data availability statements, or supplementary materials included in this article.


