Summary
In a state of caloric restriction (CR), improved insulin action was associated with the activation of AMP‐activated kinase (AMPK). Here, we verified whether AMPK was involved in impaired β‐cell function in islets from rats subjected to CR for 21 days.
Eight‐week‐old male rats were distributed into a control (CTL) group that was fed an isocaloric diet ad libitum or a CR group that received 60% of the food consumed by the CTL group. From days 18–21, CTL and CR rats were treated with sense (CTLS and CRS) or antisense (CTLAS and CRAS) AMPKα2 oligonucleotides.
Caloric restriction was associated with decreased body weight, perigonadal fat pads and insulinaemia, while higher glucose tolerance was observed in CRS rats. Antisense treatment normalized insulinaemia and glucose tolerance in CRAS rats and increased cholesterolaemia in CRAS and CTLAS groups. These effects were associated with reduced pAMPK/AMPK protein expression in the liver of rats treated with antisense oligonucleotides. Additionally, CRS islets showed higher pAMPK/AMPK content and lower glucose‐induced insulin release. As expected, antisense oligonucleotides against AMPKα2 efficiently reduced pAMPK/AMPK protein in CRAS and CTLAS islets. The lower AMPK content in CRAS islets normalized the insulin secretion in islets exposed to 16.7 mM glucose. In addition, CTLAS islets presented higher insulin secretion at 2.8 and 16.7 mM glucose. These findings support the hypothesis that higher AMPK protein expression is involved in impaired β‐cell function in islets from rats subjected to CR for 21 days.
Keywords: AMP‐activated kinase, caloric restriction, insulin secretion, β‐cell
Caloric restriction (CR) modulates molecular and biochemical pathways that delay physiopathological alterations associated with ageing and prevent diseases such as hypertension, obesity and diabetes (Cantó & Auwerx 2009). We previously demonstrated that a 40% reduction in food restriction decreases insulin secretion stimulated by glucose and depolarizing agents, an effect associated with lower glucose oxidation and a reduction in the expression of the silent information regulator‐T1 (SIRT1) protein (do Amaral et al. 2011). However, increased SIRT1 was associated with the effects of chronic calorie restriction, and a relationship between SIRT1 and AMP‐activated kinase (AMPK) was reported (Chen et al. 2010; Wang et al. 2012; Chen et al. 2013). SIRT1 overexpression was observed to result in the deacetylation of the AMPK kinase LKB1 (liver kinase 1), favouring its translocation from the nucleus to the cytoplasm, where it activates AMPK (Lan et al. 2008). In addition, AMPK enhances SIRT1 activity indirectly by increasing the cellular NAD+/NADH ratio and by deacetylation and regulation of the activity of SIRT1 targets (Cantó et al. 2009). During caloric restriction, AMPKα2 enhances the insulin sensitivity in skeletal muscle (Wang et al. 2012); however, its effect in pancreatic islets is not known. AMPK activation may regulate insulin secretion, although this protein was reported to exert contradictory effects on glucose‐induced insulin secretion (Salt et al. 1998; da Silva Xavier et al. 2000; Richards et al. 2005; Lim et al. 2009; Okazaki et al. 2010; Düfer et al. 2010; Langelueddecke et al. 2012; Beall et al. 2013). Here, using an antisense oligonucleotide against AMPKα2, we assessed whether AMPK is involved in the reduced insulin secretion in islets isolated from rats subjected to CR for 21 days.
Materials and methods
Materials
125I human insulin was purchased from Genesis (São Paulo, SP, Brazil), and routine reagents were purchased from Sigma Chemical (St Louis, MO, USA).
Experimental groups
Male Wistar rats (8 weeks old) from the Centro Universitário Hermínio Ometto (UNIARARAS) were obtained from the Animal Breeding Center and separated into two groups: control rats (CTL) that were fed an isocaloric commercial diet ad libitum and a CR group that received 60% of the food ingested by CTL, with free access to water (do Amaral et al. 2011). All of the experiments were approved by the Ethical Committee on Animal Experimentation at UNIARARAS. From day 18–21 of the treatment, CTL and CR received 3 nM AMPKα2 mismatch oligonucleotides (CTLS and CRS groups) or antisense oligonucleotides (CTLAS and CRAS) two times per day via intraperitoneal injection at 12‐h intervals (Santos et al. 2013). The mismatch (5′‐ACCACCAAGAATCACAACCACAGAGC‐3′) and antisense (5′‐GCCUUGGTGTTTGGATTTCTGUGGGU‐3′) oligonucleotides were designed based on the GenBank Accession no. NM_023991 (Rattus norvegicus AMPKα2 sequence) (Prodimol Biotecnologia, Belo Horizonte, MG, Brazil). All oligonucleotides were diluted in buffer containing 10 mM Tris‐HCl and 1 mM EDTA.
General nutritional parameters
At the end of the experimental period, all rats were fasted for 12 h, weighed and subsequently euthanized in a CO2 chamber followed by decapitation. Rat blood was collected in heparinized tubes (5000 IU diluted 1:1000) and centrifuged at 10,600 g. The plasma was used for insulin determination by radioimmunoassay (Ribeiro et al. 2010) and total cholesterol (CHOL) measurement using colorimetric kits according to the manufacturer's instructions (Roche Diagnostics, Mannheim, Germany). Liver and perigonadal fat pads were removed and weighted. Glycogen content was measured in liver samples (15–20 mg) by the phenol‐sulphuric method (Lo et al. 1970) after KOH digestion and glycogen precipitation with ethanol. The glycogen content in the liver was calculated using a standard curve of d‐glucose.
Oral glucose tolerance test (oGTT)
An oGTT was performed on CTL and CR rats treated with AMPKα2 mismatch or antisense oligonucleotides. After a 12‐h fasting period, glucose was administered orogastrically through a catheter [1 g/kg body weight (BW)]. Blood samples were obtained from the cut tip of the tail at 0, 30, 60, 90 and 120 min after glucose administration for glucose determination using a glucose analyser (Accu‐Chek Advantage; Roche Diagnostics, Rotkreuz, Switzerland) (do Amaral et al. 2011).
Static insulin secretion
Pancreatic islets were isolated by collagenase digestion of the exocrine pancreas. Groups of four islets were first incubated for 30 min at 37°C in Krebs’ bicarbonate solution containing 115 mM NaCl, 5 mM KCl, 10 mM NaHCO3, 2.56 mM CaCl2, 1 mM MgCl2 and 15 mM HEPES; supplemented with 0.3% (w/v) bovine serum albumin (BSA) and 5.6 mM glucose; and equilibrated with 95% O2: 5% CO2, pH 7.4. After 30 min, the solution was replaced with fresh buffer, and the islets were further incubated for 1 h in the presence of 2.8 or 16.7 mM glucose. At the end of the incubation period, the insulin content of the medium was measured by radioimmunoassay (Ribeiro et al. 2010).
Western blotting
For protein extraction, isolated islets (300 islets) and liver fragments from CTL and CR rats treated with AMPKα2 mismatch or antisense oligonucleotides were processed and homogenized with a Polytron homogenizer (PTA 20S model PT 10/35; Brinkmann Instruments, Westbury, NY, USA) in buffer containing 10 mM EDTA, 100 mM Trizma base, 10 mM sodium pyrophosphate, 100 mM sodium fluoride, 100 mM sodium orthovanadate, 2 mM PMSF, 0.1 mg/ml aprotinin (Sigma) and deionized water at maximum speed for 40 s. The extract was then centrifuged at 14,100 g for 20 min at 4°C for the removal of insoluble material. The supernatant was collected for the determination of protein concentration by the biuret method (Protal colorimetric method; Laborlab, São Paulo, Brazil). Aliquots of the supernatant were treated with Laemmli buffer containing 100 mM DTT (Sigma). Samples containing 70 μg protein were boiled for 5 min and loaded onto 10% SDS‐PAGE. The molecular mass standard used was Spectra Multicolor Broad Range Protein Ladder (Fermentas #1841). The gels were run in a Mini‐Protean® apparatus (Bio‐Rad, Hercules, CA, USA) and then transferred to nitrocellulose membranes (Hybond ECL, 0.45 μm). The membranes were washed in basal solution (1 M Trizma base, 5 M NaCl, 0.005% Tween 20 and deionized water) and incubated in blocking solution (basal solution plus 5% Molico® skim milk) to reduce non‐specific protein binding. Membranes were incubated with a polyclonal antibody against AMPKα (1:1000, cat # 2532, Cell Signaling, Danvers, MA, USA) and pAMPKαThr172 (1:1000, cat # 2535, Cell Signaling).Visualization of specific protein bands was performed by incubating the membranes with appropriate secondary antibodies (1:10,000; Zymed Laboratories, Inc., CA, USA), followed by exposure to X‐ray films. The band intensities were quantified by optical densitometry using the free software Image J (http://rsbweb.nih.gov/ij).
Statistical analysis
The results are presented as the mean ± SEM. The statistical analyses were carried out using one‐way analysis of variance (anova) followed by Duncan's post‐test (P ≤ 0.05) using the statistica 5.0 software (Statsoft, Tulsa, OK, USA).
Ethical approval statement
The study was approved by the Institutional Ethics Committee on Animal Experimentation (Centro Universitario Hermi?nio Ometto, FHO/UNIARARAS) – Protocol No. 017–2008).
Results
Rat features
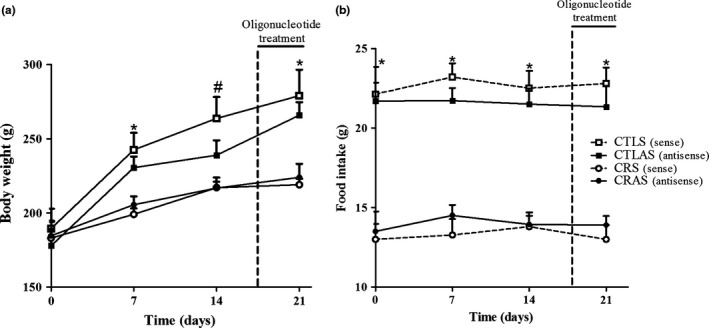
Calorie‐restricted rats displayed a lower BW at 7 days after the beginning of the treatment when compared with the CTL group (P < 0.01; Figure 1a). Treatment with the AMPKα2 antisense oligonucleotide did not alter BW or food consumption in the CTLAS and CRAS groups compared with their respective controls (Figure 1a, b). At the end of the experimental period, the final BW was lower in the CRS and CRAS rats compared with their respective controls (P < 0.005; Table 1). In addition, CRS rats showed lower insulinaemia (P < 0.008) and perigonadal fat depots (P < 0.002); however, no differences in liver glycogen, glycaemia or CHOL plasma levels were observed compared with the CTLS group (Table 1). Treatment with the antisense oligonucleotide normalized insulinaemia and partially decreased fat depots in CRAS; however, this treatment increased CHOL plasma concentrations in the CTLAS and CRAS groups (P < 0.01 and P < 0.05 respectively) and decreased glycogen content only in the liver of CRAS rats (P < 0.02; Table 1).
Figure 1.

Body weight (a) and food intake (b) in rats treated with sense (S) (CTLS and CRS) and antisense (AS) (CTLAS and CRAS) oligonucleotides. The data are the mean ± SEM (n = 3–5 rats). *Significant difference between CTLS and CTLAS vs. caloric restriction groups. #CTLS significantly differed from CRS and CRAS rats (P < 0.05).
Table 1.
Final body weight (BW), perigonadal fat pad and biochemical parameters in fasted caloric restriction and CTL rats treated with AMPKα2 sense or antisense oligonucleotide
| CTLS | CTLAS | CRS | CRAS | |
|---|---|---|---|---|
| BW (g) | 279 ± 18a | 266 ± 9a | 219 ± 4b | 224 ± 9b |
| Perigonadal fat pad (mg/ g BW) | 879 ± 8a | 618 ± 82b | 641 ± 41b | 489 ± 29c |
| Glycaemia (mg/dl) | 88 ± 4 | 85 ± 7 | 108 ± 31 | 88 ± 9 |
| Insulin (pg/ml) | 623 ± 54a | 750 ± 40a | 387 ± 18b | 623 ± 18a |
| Liver Glycogen (g/100 g tissue) | 5.7 ± 0.2a | 5.3 ± 0.04a | 5.4 ± 0.8a | 3.8 ± 0.2b |
| CHOL (mg/dl) | 107 ± 4a | 153 ± 15b | 92 ± 9a | 138 ± 16b |
| Protein (g/l) | 1.7 ± 0.15 |
Data are means ± SEM (n = 4–5 rats).
Different letters (a, b and c) indicate significant differences (P < 0.05).
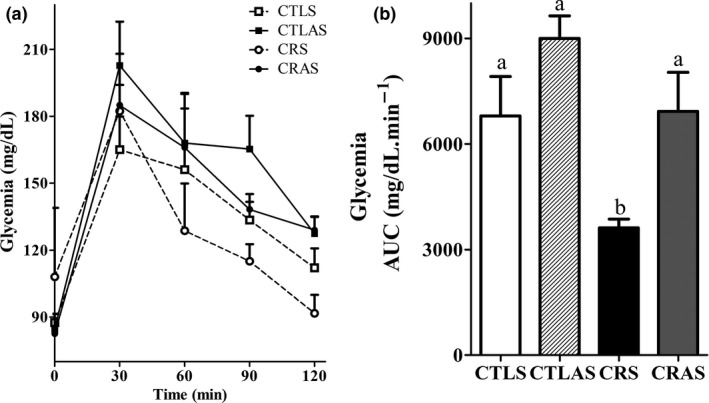
In the oGTT, after glucose injection, the glycaemia reached maximal levels at 30 min in all groups (Figure 2a). Total glycaemia, as determined by the area under the curve (AUC), was lower in CRS rats (P < 0.05; Figure 2b), and treatment with the antisense oligonucleotide normalized glycaemia in CRAS (Figure 2b).
Figure 2.

Changes in glycaemia during an oral glucose tolerance test (oGTT) in CTLS (open squares), CTLAS (black squares), CRS (open circles) and CRAS (black circles) rats. Total plasma glucose concentration during the oGTT, expressed as area under the curve (b). The data are the mean ± SEM (n = 3–6 rats). Different letters over the bars represent significant differences, P < 0.05.
Glucose‐induced insulin secretion
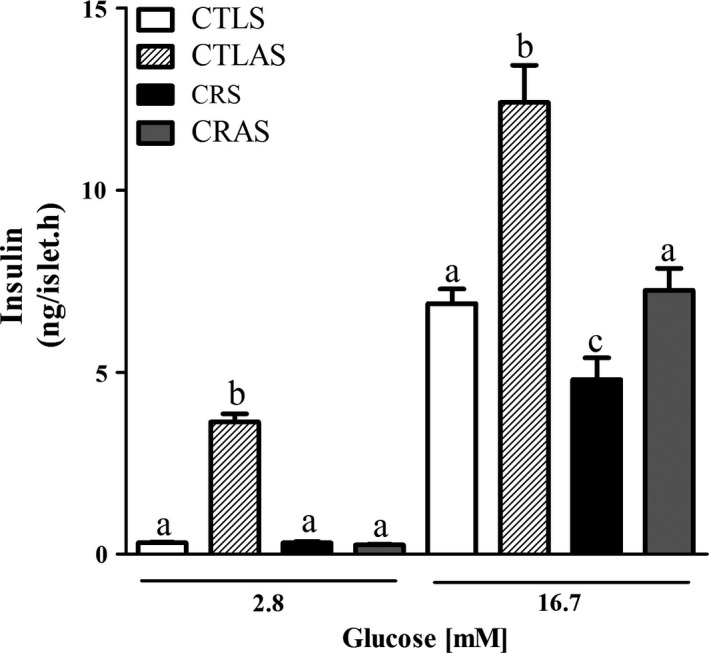
At non‐stimulatory glucose concentrations (2.8 mM), insulin secretion was similar between the CRS and CTLS groups. Islets from CTLAS rats secreted higher amounts of insulin in response to 2.8 mM glucose compared with CTLS (P < 0.0001). Treatment with the antisense oligonucleotide did not alter insulin release in CRAS islets at substimulatory glucose concentrations (Figure 3). Islets from CRS rats secreted less insulin at 16.7 mM glucose than CTLS islets (P = 0.05; Figure 3). Administration of the AMPKα2 antisense oligonucleotide increased insulin secretion in CTLAS islets in the presence of 16.7 mM glucose (P < 0.0001; Figure 3) and normalized glucose‐induced secretion in CRAS islets (Figure 3).
Figure 3.

Glucose‐induced insulin secretion in isolated islets from CTLS, CTLAS, CRS and CRAS rats. Groups of 4 islets were incubated for 1 h with different glucose (G) concentrations as indicated by horizontal lines. Each bar represents the mean ± SEM of 12–35 groups of islets. Different letters (a, b and c) represent significantly different results using the indicated glucose concentrations, P < 0.05.
AMPKα protein expression
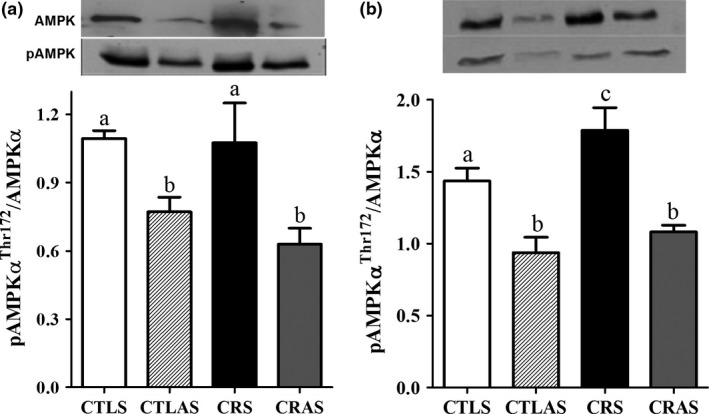
Pancreatic islets from CRS rats displayed higher pAMPKα/AMPKα protein levels (P = 0.05; Figure 4b), compared with CTLS. However, no alterations were observed in pAMPKα/AMPKα protein content in the liver of CRS compared with the CTLS group (Figure 4a). Antisense treatment efficiently reduced the pAMPKα/AMPKα ratio in both liver and isolated islets of CRAS and CTLAS rats, compared with CRS and CTLS groups respectively (P < 0.02 and P < 0.01, respectively; Figure 4a, b).
Figure 4.

Phospho (p)‐AMPKαThr172/AMPKα protein expression in the liver (a) and isolated islets (b) from CTLS, CTLAS, CRS and CRAS rats. Protein extracts were processed for Western blot. The bars represent the mean ± SEM (n = 5–7). Different letters (a, b and c) indicate significant differences (P < 0.05).
Discussion and conclusion
Here, in accordance with our previous observations (do Amaral et al. 2011), we show that CR for 21 days efficiently lowered BW, perigonadal fat depots and insulinaemia, and enhanced glucose tolerance in CRS rats.
Although not significantly different, a marginal increase in the AUC in CTLAS compared with CRAS was observed. However, antisense treatment decreased glycogen content in the liver of CRAS rats. It is known that AMPK is involved in the inhibition of the hepatic glucose output by downregulating gluconeogenic enzymes; in skeletal muscle, it increases glucose uptake by enhancing GLUT‐4 translocation to the cell surface (Viollet et al. 2009; Cantó & Auwerx 2010). The low level of glycogen content in the liver of CRAS rats indicates that a systematic reduction in AMPK protein is occurring. With the prolongation of antisense treatment, this reduction may lead to the disruption of whole body glucose homeostasis.
In addition, AMPKα2 antisense treatment efficiently decreased pAMPK/AMPK protein content in the liver of CRAS and CTLAS rats. This effect may account for the increase in total plasma CHOL in these groups, because it is known that AMPK blocks the conversion of HMG‐CoA (3‐hydroxy‐3‐methylglutaryl‐coenzyme A) to mevalonate, consequently decreasing CHOL synthesis (Viollet et al. 2009).
Our results demonstrate that AMPK is involved in the reduced glucose‐induced insulin secretion in rats submitted to CR for 21 days because antisense treatment normalized the hormone release and insulinaemia in CRAS rats. Although previous studies have reported that AMPK exerts contradictory effect on β‐cell secretion (Salt et al. 1998; da Silva Xavier et al. 2000; Richards et al. 2005; Lim et al. 2009; Okazaki et al. 2010; Düfer et al. 2010; Langelueddecke et al. 2012), our data support the hypothesis that increased AMPK protein levels and activation in CRS islets decrease insulin secretion in response to glucose. In accordance, enhanced AMPK activation is associated with a loss in glucose responsiveness in high‐passage hamster insulinoma (HIT) cells (Salt et al. 1998). Transfection of a constitutively active AMPK in islets isolated from mice and rats reduces glucose oxidation and insulin secretion (Richards et al. 2005). In addition, AMPK activation is involved in KATP channel regulation. Glucose deprivation leads to increased Kir6.2 protein levels on the surface of β‐cell membranes. AMPK is involved in this process because the translocation of Kir6.2 to the membrane was inhibited in the presence of compound C and by the use of a small interfering RNA for AMPK (Lim et al. 2009). Moreover, in response to decreased glucose, whole β‐cell recording experiments showed that increased AMPK activity opens the KATP channel, an effect associated with a decrease in the transfer of the mitochondrial‐derived ADP signals to plasma membrane KATP by phosphotransfer cascades (Beall et al. 2013). Therefore, enhanced AMPK activity decreases β‐cell electrical activity, resulting in decreased insulin secretion at non‐stimulatory glucose concentrations.
Additionally, it is important to state that AMPKα2 antisense treatment increased insulin secretion at 2.8 mM glucose in CTLAS islets, demonstrating that in normal feeding rats, the action of AMPK on the KATP channel may be impaired when AMPK islet content and activation is disrupted at lower glucose concentrations. However, we could not explain why the same effect did not occur in CRAS islets. It is possible that the damage in β‐cell electrical activity induced by the CR treatment was not fully restored at 3 days after AMPKα2 antisense administration. Our data demonstrate that the reduced capacity of β‐cells to secrete insulin after 21 days of CR is associated with enhanced AMPK content and activation in rat islets.
Author contributions
MECA, RAR, ECV and HCB‐S performed the experiments, analysed and interpreted the data and wrote the manuscript.
Conflicts of interest
The authors declare no conflict of interest.
Acknowledgements
This work was partly supported by the following Brazilian foundations: Conselho Nacional de Pesquisa (CNPq), Fundação de Amparo à Pesquisa do Estado de São Paulo (FAPESP, no 2007/08405‐9) and Fundação Hermínio Ometto.
References
- do Amaral M.E., Ueno M., Oliveira C.A. et al (2011) Reduced expression of SIRT1 is associated with diminished glucose‐induced insulin secretion in islets from calorie‐restricted rats. J. Nutr. Biochem. 22, 554–559. [DOI] [PubMed] [Google Scholar]
- Beall C., Watterson K.R., McCrimmon R.J., Ashford M.L.J. (2013) AMPK modulates glucose‐sensing in insulin‐secreting cells by altered phosphotransfer to KATP channels. J. Bioenerg. Biomembr. 45, 229–241. [DOI] [PubMed] [Google Scholar]
- Cantó C. & Auwerx J. (2009) Caloric restriction, SIRT1 and longevity. Trends Endocrinol. Metab. 20, 325–331. [DOI] [PMC free article] [PubMed] [Google Scholar]
- Cantó C. & Auwerx J. (2010) AMP‐activated protein kinase and its downstream transcriptional pathways. Cell. Mol. Life Sci. 67, 3407–3423. [DOI] [PMC free article] [PubMed] [Google Scholar]
- Cantó C., Gerhart‐Hines Z., Feige J.N. et al (2009) AMPK regulates energy expenditure by modulating NAD+ metabolism and SIRT1 activity. Nature 458, 1056–1060. [DOI] [PMC free article] [PubMed] [Google Scholar]
- Chen Y.‐R., Fang S.‐R., Fu Y.‐C., Zhou X.‐H., Xu M.‐Y., Xu W.‐C. (2010) Calorie restriction on insulin resistance and expression of SIRT1 and SIRT4 in rats. Biochem. Cell Biol. 88, 715–722. [DOI] [PubMed] [Google Scholar]
- Chen Y.‐R., Lai Y.‐L., Lin S., Li X.‐T., Fu Y.‐C., Xu W.‐C. (2013) SIRT1 interacts with metabolic transcriptional factors in the pancreas of insulin‐resistant and calorie‐restricted rats. Mol. Biol. Rep. 40, 3373–3380. [DOI] [PubMed] [Google Scholar]
- Düfer M., Noack K., Krippeit‐Drews P., Drews G. (2010) Activation of the AMP‐activated protein kinase enhances glucose‐stimulated insulin secretion in mouse β‐cells. Islets 2, 156–163. [DOI] [PubMed] [Google Scholar]
- Lan F., Cacicedo J.M., Ruderman N., Ido Y. (2008) SIRT1 modulation of the acetylation status, cytosolic localization, and activity of LKB1 Possible role in AMP‐activated protein kinase activation. J. Biol. Chem. 283, 27628–27635. [DOI] [PMC free article] [PubMed] [Google Scholar]
- Langelueddecke C., Jakab M., Ketterl N. et al (2012) Effect of the AMP‐kinase modulators AICAR, metformin and compound C on insulin secretion of INS‐1E rat insulinoma cells under standard cell culture conditions. Cell. Physiol. Biochem. 29, 75–86. [DOI] [PubMed] [Google Scholar]
- Lim A., Park S.H., Sohn J.W. et al (2009) Glucose deprivation regulates KATP channel trafficking via AMP‐activated protein kinase in pancreatic beta‐cells. Diabetes 58, 2813–2819. [DOI] [PMC free article] [PubMed] [Google Scholar]
- Lo S., Russell J.C., Taylor A.W. (1970) Determination of glycogen in small tissue samples. J. Appl. Physiol. 28, 234–236. [DOI] [PubMed] [Google Scholar]
- Okazaki Y., Eto K., Yamashita T. et al (2010) Decreased insulin secretion and accumulation of triglyceride in beta cells overexpressing a dominant‐negative form of AMP‐activated protein kinase. Endocr. J. 57, 141–152. [DOI] [PubMed] [Google Scholar]
- Ribeiro R.A., Vanzela E.C., Oliveira C.A.M., Bonfleur M.L., Boschero A.C., Carneiro E.M. (2010) Taurine supplementation: involvement of cholinergic/phospholipase C and protein kinase A pathways in potentiation of insulin secretion and Ca2+ handling in mouse pancreatic islets. Br. J. Nutr. 104, 1148–1155. [DOI] [PubMed] [Google Scholar]
- Richards S.K., Parton L.E., Leclerc I., Rutter G.A., Smith R.M. (2005) Over‐expression of AMP‐activated protein kinase impairs pancreatic {beta}‐cell function in vivo. J. Endocrinol. 187, 225–235. [DOI] [PubMed] [Google Scholar]
- Salt I.P., Johnson G., Ashcroft S.J., Hardie D.G. (1998) AMP‐activated protein kinase is activated by low glucose in cell lines derived from pancreatic beta cells, and may regulate insulin release. Biochem. J. 335, 533–539. [DOI] [PMC free article] [PubMed] [Google Scholar]
- Santos G.A., Pereira V.D., Roman E.A. et al (2013) Hypothalamic inhibition of acetyl‐CoA carboxylase stimulates hepatic counter‐regulatory response independent of AMPK activation in rats. PLoS One 8, e62669. [DOI] [PMC free article] [PubMed] [Google Scholar] [Retracted]
- da Silva Xavier G., Leclerc I., Salt I.P. et al (2000) Role of AMP‐activated protein kinase in the regulation by glucose of islet beta cell gene expression. Proc. Natl Acad. Sci. USA 97, 4023–4028. [DOI] [PMC free article] [PubMed] [Google Scholar]
- Viollet B., Guigas B., Leclerc J. et al (2009) AMP‐activated protein kinase in the regulation of hepatic energy metabolism: from physiology to therapeutic perspectives. Acta. Physiol. (Oxf.) 196, 81–98. [DOI] [PMC free article] [PubMed] [Google Scholar]
- Wang P., Zhang R.Y., Song J. et al (2012) Loss of AMP‐activated protein kinase‐α2 impairs the insulin‐sensitizing effect of calorie restriction in skeletal muscle. Diabetes 61, 1051–1061. [DOI] [PMC free article] [PubMed] [Google Scholar]


