

Valid biomarkers of motor system function after stroke would assist with tailoring and optimisation of treatment. Wu et al. show that EEG measures of motor cortical connectivity – particularly between ipsilesional M1 and ipsilesional frontal-premotor regions – correlate strongly with motor deficits and their improvement over the course of intensive therapy.
Keywords: stroke, motor, connectivity, coherence

Valid biomarkers of motor system function after stroke would assist with tailoring and optimisation of treatment. Wu et al. show that EEG measures of motor cortical connectivity – particularly between ipsilesional M1 and ipsilesional frontal-premotor regions – correlate strongly with motor deficits and their improvement over the course of intensive therapy.
Abstract
Valid biomarkers of motor system function after stroke could improve clinical decision-making. Electroencephalography-based measures are safe, inexpensive, and accessible in complex medical settings and so are attractive candidates. This study examined specific electroencephalography cortical connectivity measures as biomarkers by assessing their relationship with motor deficits across 28 days of intensive therapy. Resting-state connectivity measures were acquired four times using dense array (256 leads) electroencephalography in 12 hemiparetic patients (7.3 ± 4.0 months post-stroke, age 26–75 years, six male/six female) across 28 days of intensive therapy targeting arm motor deficits. Structural magnetic resonance imaging measured corticospinal tract injury and infarct volume. At baseline, connectivity with leads overlying ipsilesional primary motor cortex (M1) was a robust and specific marker of motor status, accounting for 78% of variance in impairment; ipsilesional M1 connectivity with leads overlying ipsilesional frontal-premotor (PM) regions accounted for most of this (R2 = 0.51) and remained significant after controlling for injury. Baseline impairment also correlated with corticospinal tract injury (R2 = 0.52), though not infarct volume. A model that combined a functional measure of connectivity with a structural measure of injury (corticospinal tract injury) performed better than either measure alone (R2 = 0.93). Across the 28 days of therapy, change in connectivity with ipsilesional M1 was a good biomarker of motor gains (R2 = 0.61). Ipsilesional M1–PM connectivity increased in parallel with motor gains, with greater gains associated with larger increases in ipsilesional M1–PM connectivity (R2 = 0.34); greater gains were also associated with larger decreases in M1–parietal connectivity (R2 = 0.36). In sum, electroencephalography measures of motor cortical connectivity—particularly between ipsilesional M1 and ipsilesional premotor—are strongly related to motor deficits and their improvement with therapy after stroke and so may be useful biomarkers of cortical function and plasticity. Such measures might provide a biological approach to distinguishing patient subgroups after stroke.
Introduction
Motor deficits are the most common impairments after stroke, present in 85% of patients acutely and persisting in ∼50% of stroke survivors (Rathore et al., 2002). Many different brain states can produce the same pattern of motor deficits; however, it is likely that a subset of these is more likely to respond favourably to restorative therapies (Cramer, 2008b). Identifying accurate neural markers of motor impairment could maximize therapeutic effects by informing individualization of therapy selection, timing, and duration (Burke and Cramer, 2013). Furthermore, an examination of how neural markers differ across therapies could provide insight into differences in the neurobiology that underlie specific therapeutic approaches.
In the search for neuroimaging markers of motor status after stroke, prior studies have generally emphasized measures of injury or regional brain function. For example, measures of white matter integrity or of lesion load within descending motor tracts have been found to correlate with degree of motor impairment in patients with chronic hemiparetic stroke (Lindenberg et al., 2010; Zhu et al., 2010). In addition, gains in motor status resulting from experimental therapies have been associated with increased activity in secondary sensorimotor regions (Johansen-Berg et al., 2002a; Schaechter et al., 2012). However, such approaches do not directly evaluate network interactions, which can provide key insights on heterogeneity in stroke recovery (Carter et al., 2012b) and are the focus of the current study.
Convergent evidence supports the value of a network-based approach for understanding the relationship between dysfunctional neural activity and behavioural deficit after stroke (Grefkes and Fink, 2011). This has been well demonstrated in connectivity studies using functional MRI, where greater motor deficits were associated with reduced connectivity across cortical motor regions (Grefkes et al., 2008; Carter et al., 2010). Thus, reduced connectivity between key nodes of the cortical motor system could serve as a marker of reduced efficiency in processing sensorimotor signals in the stroke-injured brain (de Vico Fallani et al., 2009). Consistent with this, rat models report motor dysfunction after experimental stroke is paralleled by reduced connectivity between cortical motor regions, and behavioural recovery is related to restoration of functional connectivity between cortical motor areas (van Meer et al., 2010). Similarly, human functional MRI studies report that individuals with persistent motor deficits demonstrate significantly reduced connectivity across ipsilesional cortical motor regions during movement (Grefkes et al., 2008; Sharma et al., 2009), and that behavioural recovery occurs in concert with increased connectivity among cortical motor regions (James et al., 2009). Together, these findings suggest that measures of cortical motor connectivity may be good biomarkers of post-stroke sensorimotor signal processing.
The current study approached these issues using dense array EEG, which has advantages such as low cost, high safety, and high accessibility in complex medical settings. In addition, the high temporal resolution of EEG may be particularly salient in studies of the motor system, as it permits measurement of connectivity in the beta (20–30 Hz) range, a frequency range that is associated with motor system function (Pfurtscheller et al., 1996; Roopun et al., 2006; Deeny et al., 2009). The current study examined a resting-state EEG measure of functional connectivity, coherence with ipsilesional primary motor cortex in the beta band, as a neural marker of motor impairment and a biomarker of change in motor status across a period of intensive therapy in patients with chronic stroke. The study hypothesized that this motor system measure of resting-state EEG functional connectivity would: (i) perform better than MRI measures of structural injury such as total infarct volume and corticospinal tract lesion load as a neural marker of baseline motor impairment; (ii) demonstrate specificity, i.e. correlate with motor behaviour but not non-motor behaviours; and (iii) change in parallel with motor gains over 28 days of intensive therapy.
Additional hypotheses were focused on neurobiological insights based on the spatial distribution of this EEG connectivity measure. Studies using PET and functional MRI in patients with stroke have found that greater activation within ipsilesional premotor areas is associated with better motor outcomes (Seitz et al., 1998; Carey et al., 2006), and that larger increases in ipsilesional premotor activation parallel better motor recovery (Johansen-Berg et al., 2002a; Mihara et al., 2013). Conversely, greater activation within contralesional primary motor areas is associated with poorer motor outcomes (Johansen-Berg et al., 2002b; Ward et al., 2003a), and larger increases in contralesional primary motor area activation parallel worse motor recovery (Loubinoux et al., 2003; Wei et al., 2013). Therefore, the current study further hypothesized that: (i) greater connectivity between ipsilesional primary motor cortex (M1) and ipsilesional premotor cortex (PM) would be associated with better baseline motor status, and furthermore that increases in connectivity between ipsilesional M1 and ipsilesional PM would parallel greater gains with therapy; and (ii) greater connectivity between ipsilesional M1 and contralesional M1 would be associated with poorer baseline motor status, and furthermore that increases in connectivity between ipsilesional M1 and contralesional M1 would parallel reduced motor gains with therapy. Additional analyses explored EEG coherence as a predictor of motor gains across therapy.
Materials and methods
Study design
Subjects with hemiparesis and chronic stroke were recruited. All subjects signed informed consent in accordance with the University of California, Irvine Institutional Review Board.
Inclusion criteria included age >18 years, stroke that occurred 3–24 months prior to first behavioural assessment, Fugl-Meyer score of 22–55 (normal = 66), and English speaking. Exclusion criteria included deficits in communication or attention that would interfere with reasonable study participation, contraindication to MRI scanning, active major neurological or psychiatric disease, or another diagnosis substantially affecting the arm. A skull defect that could result in an EEG breach rhythm was not a specific exclusion criterion but was not present in any subject.
Approximately 1 week after the initial screening visit, subjects returned for structural MRI and EEG assessments. As previously described (Takahashi et al., 2008), after the initial screening, subjects underwent two baseline assessments of upper extremity motor status to insure behavioural recovery was at a stable plateau, i.e. any difference between Baseline 1 and Baseline 2 Fugl-Meyer scores was <3 points, smaller than the minimal detectable change (See et al., 2013).
Treatment protocol
The protocol included 28 days of intensive home-based rehabilitation targeting the upper extremity (Dodakian et al., 2014) (Fig. 1A). In sum, each day, subjects completed a 2-h session focused on arm motor rehabilitation therapy. The daily therapy sessions included standard physical therapy and occupational therapy exercises guided by slide show diagrams, as well as virtual reality computer games designed to emphasize control of range, speed, timing and accuracy of hand movements. Content of therapy was adjusted according to individual deficits.
Figure 1.

Experimental setup. (A) Experiment timeline. Behavioural and EEG assessments were performed at baseline, then after 2 weeks of therapy, following the 1 week break, and at end of 28 days of therapy. A baseline structural MRI scan was also acquired. (B) The group showed statistically and clinically significant gains in upper-extremity motor status, as measured by the Fugl-Meyer Arm Motor Assessment (FM) (mean ± standard error), across therapy [t(11) = 5.89, P = 0.0001].
EEG recording and signal processing
Three minutes of awake, eyes-open, resting-state brain activity was acquired by dense array surface EEG using the 256-lead Hydrocel net (Electrical Geodesics, Inc.). The netted design of the Hydrocel system allows for rapid application of the 256 leads. For the typical subject, net preparation (including head measurement, net preparation in saline solution, net placement, and net adjustments) was <10 min, recording time was 3 min, and net removal was <5 min. As a result, average start-to-finish time for a complete EEG exam was 15–20 min, with no EEG exam exceeding 30 min.
Participants were seated upright with feet flat on the floor. During recording, lights were dimmed, and participants were requested to minimize movements/speaking and to focus their gaze at the centre of a fixation cross displayed on a laptop. An investigator in the room visually confirmed subject compliance with these instructions. Data were collected with a high input impedance amplifier (Net Amp 300, EGI) using Net Station 4.5.3 (EGI) at 1000 Hz sampling rate.
Preprocessing
EEG data were exported to MATLAB 7.8.0 (MathWorks, Inc.) for subsequent preprocessing and analysis steps. For 3 min of recording time, 180 1-s epochs of EEG data were collected. Data were re-referenced offline to the mean signal across all electrodes. Preprocessing steps to remove extra-brain artefacts were applied, as described previously (Wu et al., 2014). In sum, continuous EEG data were low-pass filtered at 50 Hz, segmented into non-overlapping 1-s epochs, and then mean detrended. Next, visual inspection removed epochs contaminated by muscle activity, including neck and face movements. EEG data then underwent independent component analysis decomposition, in which components representing eye blinks, eye movements, and cardiac rhythms were removed (Delorme and Makeig, 2004; Delorme et al., 2007). The remaining components were transformed back to channel space before undergoing an additional round of visual inspection to ensure absence of all extra-brain artefacts in the remaining data. Across all EEG recordings (12 subjects × 4 EEG exams/subject), 171.4 ± 12.0 [mean ± standard deviation (SD)] of the 180 epochs per EEG exam (93.6%), were retained for subsequent analyses.
Coherence
Functional connectivity between brain regions was estimated from EEG coherence between electrodes overlying the corresponding regions (Nunez and Srinivasan, 2006). Coherence ranges from zero to one, with a coherence value near one indicating EEG signals have similar phase and amplitude difference at all time points, and a coherence value near zero indicating signals have a random difference in phase and amplitude. Although coherence has been widely adopted in EEG studies as a surrogate marker of communication between cortical neural sources (Nunez and Srinivasan, 2006), there is potential that an observed increase in coherence may result from increased input from a tertiary common neural source (Saltzberg et al., 1986).
The high beta (20–30 Hz) frequencies are associated with function of the motor system (Pfurtscheller et al., 1996; Roopun et al., 2006). Therefore, the primary metric in the present study was mean coherence in the high beta frequency range using a seed region over ipsilesional M1, a central motor execution node of the cortical motor system (Hardwick et al., 2013). For the 256-lead system used, the M1 seed was defined as either C3 or C4 (left or right M1, respectively), which some studies have suggested largely reflects activity from the precentral gyrus (Homan et al., 1987), and its six immediately surrounding leads. Coherence matrices from individuals with infarcts in the right hemisphere were flipped across the midline for subsequent analyses.
Partial least squares modelling
Partial least squares (PLS) analyses are particularly well suited for analysing very large data sets that contain many predictors, for which multiple comparisons would reduce statistical power, as is common in neuroimaging data (Krishnan et al., 2011), and for analysing data sets that have multicollinearity among predictors. Similar to previous studies from our group (Krishnan et al., 2013; Wu et al., 2014), the current study used the N-way Toolbox for MATLAB (Andersson and Bro, 2000) to implement PLS analyses. The resultant PLS model from each analysis was then used to identify electrodes of interest for characterizing brain function–behaviour relationships.
The mathematics of PLS can be conceptualized as a variant of independent component analysis. With both PLS and independent component analysis, a multivariate signal such as EEG is reduced to a series of additive subcomponents. In independent component analysis, the objective is to maximize representation of variance in the independent variable in as few components as possible. Conversely, in PLS, the objective is to maximize representation of variance in the dependent variable in as few components as possible. This is accomplished by optimizing a least squares fit for a partial correlation matrix between the independent and dependent variables. For the present analyses, the independent variable was EEG coherence and the dependent variable was Fugl-Meyer score. As preprocessing steps, data were first mean detrended and then underwent a direct orthogonal signal correction to allow for more efficient PLS models with fewer components (Westerhuis et al., 2001). From the PLS regression, a series of models with successively more components were generated that maximally accounted for variance in the dependent variable. The fitted PLS model included as many components as were required to achieve 80% of variance in the dependent variable explained.
To test predictive strength of each PLS connectivity model, cross-validation was performed using a leave-one-out and predict approach. With this validation method, data from each subject are iteratively removed from the PLS model, and the removed subject’s behavioural data are predicted from his/her EEG coherence data using the PLS model generated from the remaining n − 1 subjects. This method of cross-validation was selected because a leave-one-out and predict validation scheme has established utility for accurately assessing generalization of results to an independent data set, particularly with smaller sample sizes (Huang et al., 2011; Kang et al., 2013).
Leads where coherence with ipsilesional M1 was most strongly related to behavioural status were identified by setting an arbitrary threshold for each model using the approach described by Menzies et al. (2007): correlation coefficients were thresholded at |ri| > 0.8 × rmax, where ri is the correlation coefficient at the ith lead and rmax is the largest |ri| value across all 249 leads (256 total electrodes minus the seven seed leads overlying M1).
Magnetic resonance imaging
High resolution T1-weighted images were acquired with a Philips Achieva 3 T MRI scanner using a 3D magnetization-prepared rapid gradient echo (MPRAGE) sequence (repetition time = 8.5 ms; echo time = 3.9 ms; slices = 150; voxel size = 1 × 1 × 1 mm3). Infarct volume and the per cent of the corticospinal tract affected by stroke (corticospinal tract injury) were calculated using previously described methods (Burke, et al., 2014b). Infarct volume was outlined by hand on a T1-weighted MRI image. Corticospinal tract injury was quantified by overlapping each subject’s infarct in MNI stereotaxic space with a normal M1 corticospinal tract generated from healthy controls (Dawes et al., 2008; Zhu et al., 2010; Riley et al., 2011).
Statistical analyses
Change in motor impairment score was analysed by a two-tailed paired t-test, with statistical significance set at P < 0.05. Simple bivariate analyses between a clinical measure (behaviour or demographic) and brain state (MRI injury or EEG coherence) were performed using two-tailed linear regression models with statistical significance set at P < 0.05. Parametric statistical methods were used, as all measures were normally distributed or could be transformed to a normal distribution. Statistical tests were performed using the MATLAB 7.8.0 statistical package.
Results
Subjects
Twelve subjects, age 26–75 (mean = 54.0 ± 16.6 years), six male and six female, in the chronic phase of stroke recovery (mean time post-stroke = 7.3 ± 4.0 months) with persistent hemiparesis were recruited. All 48 EEG exams (four exams/subject × 12 subjects, Fig. 1A) were completed successfully, with no EEG exam excluded for reasons such as excessive movement or muscle artefact during data acquisition or hardware malfunction.
The patient group showed heterogeneity in both size and location of brain infarcts (Table 1). Overall, the group showed mild-moderate arm motor impairment at Exam 1 (mean Fugl-Meyer = 39 ± 12, range 23–56, normal = 66). At baseline, motor deficits were stable, as the group did not show a significant change in Fugl-Meyer score across the two baseline behavioural assessments [t(11) = −0.20, P = 0.85]. Across therapy, motor deficits improved significantly, as Fugl-Meyer scores increased by 4.5 ± 2.7 points (Fig. 1B), achieving statistical significance [t(11) = 5.89, P = 0.0001] and exceeding the minimal clinically important difference (See et al., 2013).
Table 1.
Subject characteristics
| Patient No. | Age (years) | Gender | Affected arm | Infarct volume (cm3) | Infarct site | Months post-stroke | Baseline Fugl-Meyer score |
|---|---|---|---|---|---|---|---|
| 1 | 66 | M | R | 3.0 | Left pontine | 8.4 | 55 |
| 2 | 39 | M | L | 21.5 | Right cingulate | 5.4 | 42 |
| 3 | 75 | F | R | 5.0 | Left frontal | 5.5 | 51 |
| 4 | 68 | M | L | 100.6 | Right frontal | 6.3 | 39 |
| 5 | 39 | M | R | 0.4 | Left internal capsule/temporal | 4.8 | 56 |
| 6 | 47 | M | R | 10.3 | Left temporal | 8.5 | 49 |
| 7 | 43 | F | L | 59.1 | Right frontal | 10.2 | 25 |
| 8 | 65 | F | R | 1.2 | Left internal capsule | 3.6 | 38 |
| 9 | 70 | F | L | 32.2 | Right parietal | 5.6 | 23 |
| 10 | 26 | F | R | 30.1 | Left parietal | 18.4 | 36 |
| 11 | 70 | F | L | 25.7 | Right parietal | 4.7 | 23 |
| 12 | 40 | M | L | 0.8 | Right pontine | 5.6 | 36 |
Connectivity is a robust and specific cross-sectional marker of motor status
The PLS connectivity model at Exam 1 (‘Exam 1 PLS model’) identified a pattern of beta coherence with M1 that correlated strongly with Exam 1 Fugl-Meyer score (fitted R2 = 0.96). Cross-validation using the leave-one-out approach found that the Exam 1 PLS model remained highly accurate (validated R2 = 0.78, Fig. 2A), i.e. connectivity between ipsilesional M1 and the rest of the scalp accounted for 78% of the variance in Exam 1 Fugl-Meyer score across the 12 subjects.
Figure 2.
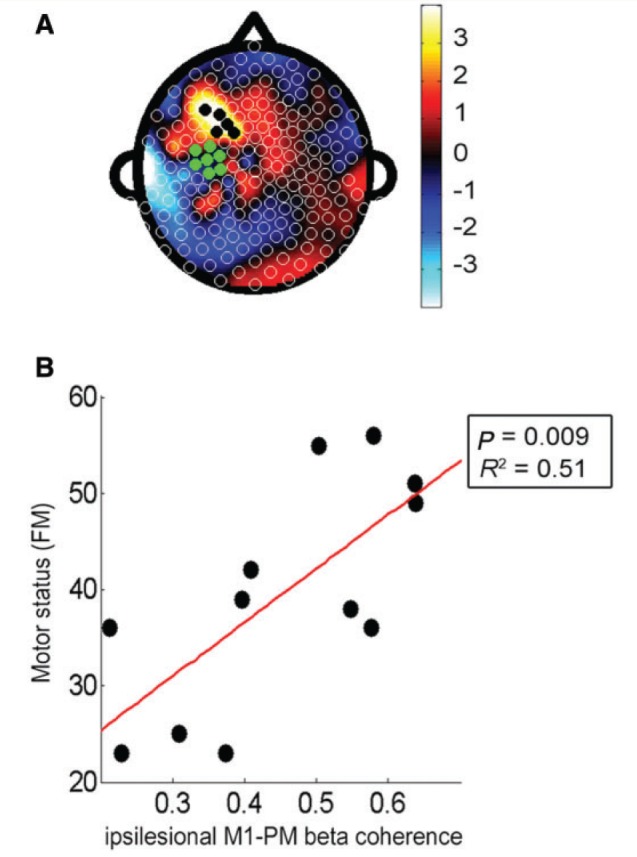
Cortical connectivity with ipsilesional M1 was a good marker of Fugl-Meyer score at baseline. (A) Topographic map of correlation coefficients of PLS model correlating baseline ipsilesional M1 connectivity across whole scalp and baseline Fugl-Meyer (FM) score (fitted R2 = 0.96, cross-validated R2 = 0.78). The left side of the figure is ipsilesional, the right side is contralesional, green electrodes indicate the ipsilesional M1 seed, and the black dots indicate leads overlying the ipsilesional frontal-premotor cortical region (PM). (B) Greater degree of ipsilesional M1–premotor connectivity was correlated with higher Fugl-Meyer score (R2 = 0.51, P = 0.009).
To better understand the Exam 1 PLS model, those leads where variance in connectivity with M1 was most strongly related to Exam 1 Fugl-Meyer score were identified. These were clustered in ipsilesional PM (indicated by black dots in Fig. 2A). Focusing on these ipsilesional premotor leads, bivariate linear regression found that individuals with higher ipsilesional M1–PM connectivity at Exam 1 had higher Exam 1 Fugl-Meyer scores. Furthermore, variance in ipsilesional M1–PM connectivity accounted for a majority of the variance in Exam 1 Fugl-Meyer scores (R2 = 0.51, P = 0.009, Fig. 2B). This relationship between M1–PM connectivity and Fugl-Meyer score measured at the same exam remained robust across each of the four EEG exams (Exam 2: R2 = 0.67, P = 0.001; Exam 3: R2 = 0.37, P = 0.036; and Exam 4: R2 = 0.46, P = 0.014).
To examine the specificity of the relationship between motor deficits and ipsilesional M1–premotor connectivity in the Exam 1 PLS model, this connectivity measure was also examined in relation to two non-motor assessments, the Geriatric Depression Scale score and the Mini-Mental State Examination score (MMSE). Neither correlated significantly (Geriatric Depression Scale: P = 0.85; MMSE: P = 0.25), indicating that ipsilesional M1–PM connectivity at Exam 1 demonstrates specificity as a neural marker of motor status. In addition, a new PLS model was generated examining ipsilesional M1 connectivity in relation to Geriatric Depression Scale. This too did not reach significance, further supporting that whole scalp connectivity with ipsilesional M1 demonstrates specificity for function of the motor system.
An additional analysis examined connectivity between ipsilesional M1 and contralesional M1 (defined as the homologous leads over the contralesional hemisphere) in relation to motor status. Connectivity between ipsilesional M1 and contralesional M1 at Exam 1 was not significantly related to Exam 1 Fugl-Meyer score (P = 0.87). A secondary analysis examined connectivity between ipsilesional M1 and contralesional PM at Exam 1, and this was also not related to Exam 1 Fugl-Meyer score (P = 0.41).
MRI measures of injury as cross-sectional markers of motor status
Infarct volume, a global measure of injury, did not correlate with Exam 1 Fugl-Meyer score (P > 0.05), but per cent corticospinal tract injury, a measure more related to motor system injury, did (R2 = 0.52, P = 0.008). The strength of this brain injury-behaviour relationship was similar to the strength of the brain function-behaviour relationship (i.e. ipsilesional M1–premotor connectivity, R2 = 0.51, above).
Clinical measures were poor predictors of baseline motor impairment. Time post-stroke (P = 0.85), age (P = 0.81), mood (Geriatric Depression Scale, P = 0.55), and cognitive status (MMSE, P = 0.30) did not correlate significantly with Exam 1 Fugl-Meyer score.
Neural structure and function in combination contribute to motor status
Neural structure (injury) and functional factors each had an independent role in explaining motor status. A partial correlation was performed to determine the degree of association that EEG connectivity and corticospinal tract injury each had with Exam 1 Fugl-Meyer score. Both corticospinal tract injury (R2 = 0.58, P = 0.007) and ipsilesional M1–PM connectivity (R2 = 0.42, P = 0.03) remained significant; note that corticospinal tract injury and baseline ipsilesional M1–PM connectivity were not significantly correlated (P = 0.12).
Furthermore, the combination of corticospinal tract injury and EEG connectivity was found to be a better marker of motor status than either measure alone. Corticospinal tract injury and EEG connectivity were combined through two methods. When corticospinal tract injury was added as an additional predictor in the Exam 1 PLS model of EEG connectivity, prediction was improved significantly [R2 = 0.93, F(0.05,1,10) = 21.04, P = 0.0001]. Corticospinal tract injury and M1–PM connectivity were also combined in a multivariate least squares regression model, which also significantly improved prediction [R2 = 0.86, F(0.05,1,10) = 6.70, P = 0.03].
Changes in connectivity are a good biomarker of motor gains with therapy
A separate analysis examined how change in EEG connectivity performed as a biomarker of change in motor status over the 28 days of therapy. The PLS model examining change in connectivity and change in Fugl-Meyer score from Exam 1 to Exam 4 (‘Change PLS model’) had a fitted R2 = 0.92 and cross-validated R2 = 0.61. The leads from the Change PLS model most strongly related to change in Fugl-Meyer score over this period were clustered in regions overlying ipsilesional parietal (PAR) and ipsilesional PM (indicated by black dots in Fig. 3A). Greater gains in Fugl-Meyer from Exam 1 to Exam 4 were related to larger increases in ipsilesional M1–PM connectivity (Fig. 3B, R2 = 0.34, P = 0.04) and to larger decreases in ipsilesional M1–PAR connectivity (Fig. 3C, R2 = 0.36, P = 0.04); note that change in ipsilesional M1–premotor connectivity and change in ipsilesional M1–PAR connectivity from Exam 1 to Exam 4 were not significantly correlated (P = 0.96). Change in connectivity between ipsilesional M1 and contralesional M1 regions did not correlate with change in Fugl-Meyer score (P = 0.65).
Figure 3.
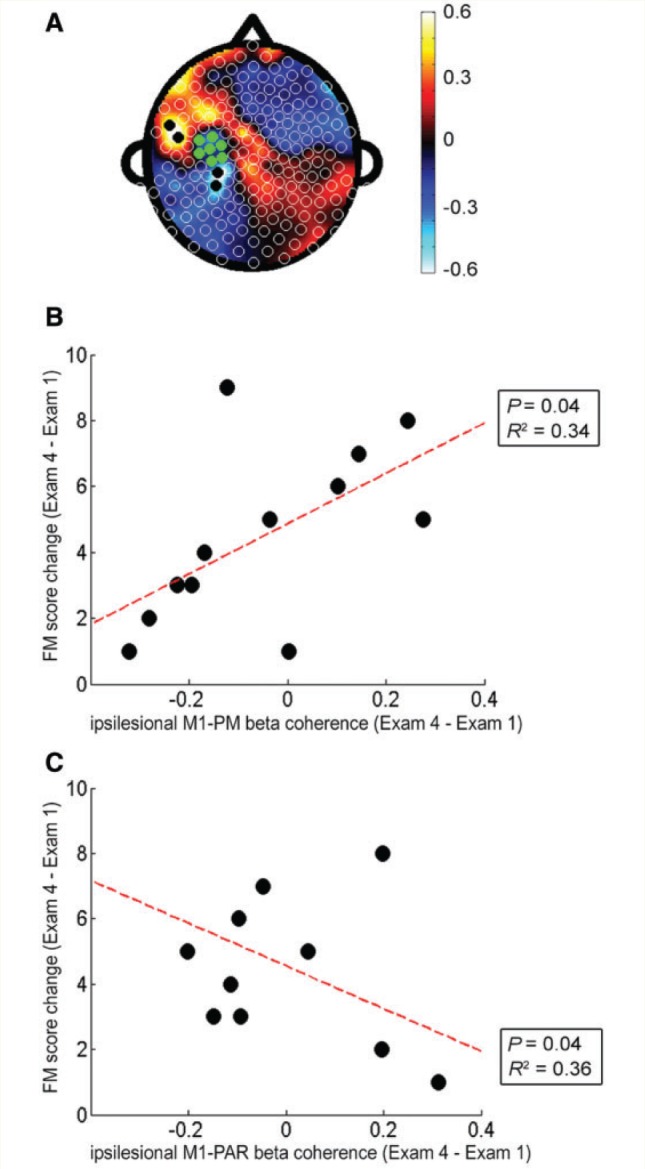
Change in ipsilesional M1 connectivity was a significant biomarker of motor gains across therapy. (A) Topographic map of correlation coefficients in the PLS model correlating change in ipsilesional M1 connectivity across whole scalp and change in Fugl-Meyer score across the 28 days of therapy (fitted R2 = 0.92, cross-validated R2 = 0.61). (B) Greater degree of ipsilesional M1 connectivity with ipsilesional frontal-premotor cortical regions (PM) was correlated with higher Fugl-Meyer (FM) gains (R2 = 0.34, P = 0.04); compared to the ipsilesional premotor electrodes identified in the Exam 1 PLS model, premotor electrodes in this change PLS model were more ventrally located. (C) Greater degree of ipsilesional M1 connectivity with ipsilesional parietal (PAR) cortical regions was correlated with smaller Fugl-Meyer gains (R2 = 0.36, P = 0.04).
Baseline connectivity predicts gains from therapy
The PLS model of connectivity with ipsilesional M1 at Exam 1 predicting change in Fugl-Meyer score across therapy (from Exam 1 to Exam 4) had a fitted R2 of 0.97 and a cross-validated R2 of 0.79 (Fig. 4A). The leads from this Exam 1 predictive model that most strongly related to change in Fugl-Meyer score were clustered in a region overlying ipsilesional parietal operculum (PARoperc). Greater gains in Fugl-Meyer from Exam 1 to Exam 4 were predicted by lower M1–PARoperc connectivity at Exam 1 (Fig. 4B, R2 = 0.60, P = 0.003).
Figure 4.
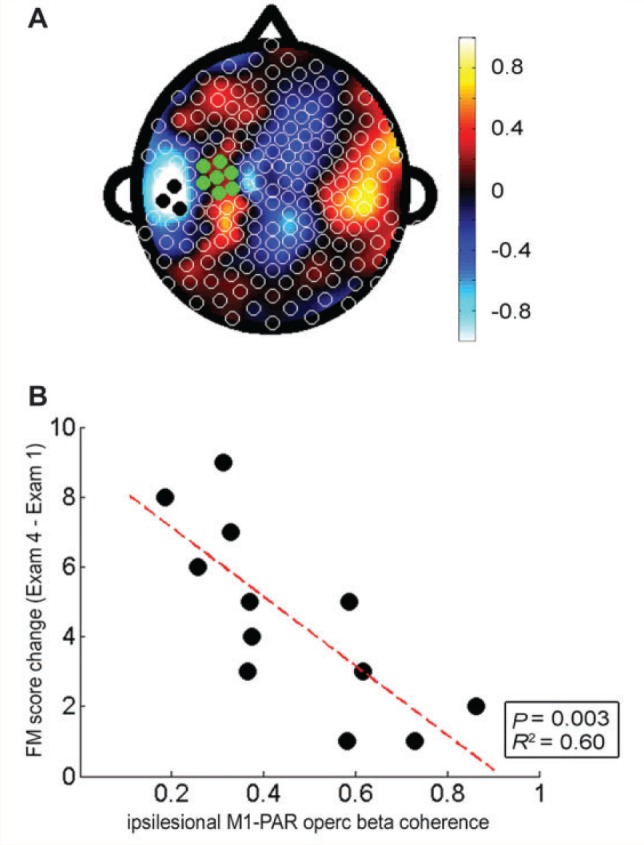
Cortical connectivity with ipsilesional M1 at baseline predicted motor gains across therapy. (A) Topographic map of correlation coefficients in the PLS model correlating ipsilesional M1 connectivity across whole scalp at baseline with change in Fugl-Meyer score across the 28 days of therapy (fitted R2 = 0.97, cross-validated R2 = 0.79). (B) Greater degree of ipsilesional M1 connectivity with ipsilesional parietal operculum (PARoperc) predicted smaller Fugl-Meyer gains (R2 = 0.60, P = 0.003).
Clinical and MRI measures at Exam 1 do not predict motor gains from therapy
None of the clinical measures (age, time post-stroke, Exam 1 Fugl-Meyer score, Geriatric Depression Scale score, Edinburgh handedness score, and MMSE score) predicted change in Fugl-Meyer score from Exam 1 to Exam 4. In addition, neither of the MRI-based measures of injury (infarct volume and per cent corticospinal tract injury) predicted change in Fugl-Meyer score across therapy.
Discussion
Patient care and clinical trials often rely on bedside assessments for decision-making after stroke. Biomarkers may be able to inform such decisions, e.g. to define therapy content (Dodakian et al., 2013), to stratify patients in a trial (Cramer, 2010), or to assess changes in brain function across a period of therapy (Burke, et al., 2014a) based on a patient’s specific biological state. Evidence suggests that measures of cortical connectivity have the potential to serve as such biomarkers (Grefkes et al., 2008; de Vico Fallani et al., 2009; Carter et al., 2010; van Meer et al., 2010). However, cortical connectivity has generally been measured using MRI, which may have limitations in clinical application. A previous report found an EEG-based measure of connectivity was useful for predicting motor skill acquisition in healthy subjects (Wu et al., 2014). The current study extended this approach and found the same EEG-based measure (resting coherence between ipsilesional M1 and the rest of the cortex, in the high beta band) was a robust marker of baseline motor status, biomarker of change in motor status across 28 days of intensive therapy, and predictor of gains from therapy. Ipsilesional M1 connectivity with ipsilesional PM regions was consistently associated with favourable motor status, whereas measures of ipsilesional M1 connectivity with contralesional M1 were not significant. These findings support the potential of EEG-based measures of cortical connectivity as biomarkers after stroke.
The current study found that, among 12 patients with hemiparetic chronic stroke, functional connectivity with ipsilesional M1 across the brain had a robust relationship with baseline impairment, with a cross-validated R2 of 0.78, and furthermore was a powerful predictor of motor gains across the period of therapy, with an R2 of 0.79. By comparison, an MRI-based measure of motor system injury (per cent corticospinal tract injury) had a comparable relationship with baseline motor status at baseline (R2 = 0.52) but did not significantly predict treatment gains. The strength of the current results speak to clinical applications of the current methods as reliable biomarkers of brain state that can be serially measured in patients with stroke. EEG has poorer spatial resolution as compared to neuroimaging modalities such as MRI. In addition, localization is limited by the fact that recordings are obtained at the scalp, and so current results are presented as occurring in the leads overlying a brain area rather than strictly within cortical regions per se. Nonetheless, EEG-based methods may have substantial clinical utility given their established safety record, low expense per exam, and relative ease and rapidity of data acquisition across complex medical settings.
Increasingly, multimodal approaches that consider both brain function and brain structure have been found to have advantages for explaining variance across patients with stroke (Gerloff et al., 2006; Stinear et al., 2007; Carter et al., 2012a; Burke Quinlan et al., 2015). Consistent with these reports, the current study found that a combination of a brain functional assessment (motor network connectivity derived from dense array EEG) and a brain structural assessment (of motor system injury, corticospinal tract injury based on MRI) demonstrated improved prediction of motor impairment status as compared to either measure alone. While motor system injury and a measure of motor system function (M1–PM beta coherence) each explained∼50% of variance in motor impairment, prediction was improved (R2 = 0.86) when structural and functional measures were combined in a multivariate model. Prediction was also improved when corticospinal tract injury was included with connectivity measures in a PLS model of baseline impairment (validated R2 = 0.93). Thus, the current results represent a progression from previous studies that separately demonstrated EEG measures of connectivity and MRI measures of motor system damage to each be a good marker of motor status after stroke (Zhu et al., 2010; Dubovik et al., 2012). The current results are also in line with previous studies demonstrating that both brain structure (injury) and brain function (connectivity via functional MRI) contribute to motor status after stroke (Carter et al., 2012a; Burke Quinlan et al., 2015).
Current methods also provide some insights into the neural events underlying the EEG findings. At baseline, larger ipsilesional M1–premotor connectivity correlated with better motor status, accounting for much of the Exam 1 PLS model (Fig. 2B) and explained a majority of the variance in Exam 1 Fugl-Meyer scores. Ipsilesional M1–PM connectivity remained informative across the 28 days of therapy, increasing in parallel with motor gains (Fig. 3B). These results are consistent with abundant data describing an association between good motor recovery after stroke and increased activation of ipsilesional premotor during motor tasks (Carey et al., 2002; Ward et al., 2003a; Kantak et al., 2012). Although much of the previous work regarding the role of ipsilesional PM in motor recovery after stroke was derived from task-related data, several recent studies suggest brain activity acquired at rest is representative of engagement of brain networks during a task (Deco et al., 2011; Saleh et al., 2012). Furthermore, several recent studies demonstrate that individual differences in brain function at rest are predictive of subsequent performance (Hampson et al., 2006; Tambini et al., 2010; Wu et al., 2014). Additionally, studies that examine connectivity measures derived from both resting and task-related data have produced similar results with respect to ipsilesional M1–PM connectivity and its relationship with behavioural status after stroke (Sharma et al., 2009; Wang et al., 2010; Rehme et al., 2011). The similarities across these reports are consistent with the parallels between current resting-state results and previously reported findings from task-related studies.
An additional hypothesis in the current study was that increased ipsilesional M1–contralesional M1 connectivity would be associated with lower baseline Fugl-Meyer scores and with smaller motor gains across therapy (Grefkes et al., 2008). However, ipsilesional M1–contralesional M1 connectivity was not significantly related to baseline motor status or to its change with therapy. The reasons for this finding are uncertain but may be multifactorial. First, clinical characteristics of subjects enrolled in the current study, including time post-stroke and stroke severity, might have influenced the M1–M1 connectivity results. Indeed, longitudinal studies (Ward et al., 2003b; Park et al., 2011) report that it is at earlier, and not later, points in stroke recovery that contralesional regions, including contralesional M1, are most prominent, and that M1–M1 connectivity is most asymmetric. Thus, the chronicity of patients enrolled in the current study compared to previous studies that report significant associations between M1–M1 connectivity and motor status after stroke (Carter et al., 2010; Wang et al., 2010) may partially account for the negative M1–M1 connectivity findings in the current study. Additionally, increased activation of contralesional M1 after stroke has been implicated as a compensatory mechanism in individuals with more severe stroke deficits (Cramer and Crafton, 2006; Marshall et al., 2009) and thus might be expected to be a less robust marker of motor status in the mild to moderately impaired subjects enrolled in the current study. Second, the contribution of contralesional M1 to motor network processes after stroke may be less apparent when brain function is probed at rest, in contrast with the contribution of ipsilesional PM (see above). Indeed, in subjects with chronic stroke, interhemispheric inhibition measured between bilateral M1 showed greater correlation with behavioural parameters when measured during motor preparation compared to during the resting state (Murase et al., 2004). Further in healthy subjects, M1–M1 connectivity is more apparent during movement compared to at rest (Jiang et al., 2004), and is further enhanced by increasing task complexity (Chen et al., 1997). The current findings are concordant with a prior functional MRI-based study that found ipsilesional M1–contralesional M1 connectivity to be a less robust marker of motor status after stroke compared to ipsilesional M1–premotor connectivity (Rehme et al., 2011). Overall, results suggest that M1–M1 connectivity, particularly when measured at rest, may have limitations as a marker of motor system function in patients with mild-to-moderate impairment in the chronic phase of stroke.
The current study presents a novel application of PLS regression for analysis of EEG data in a stroke population, resulting in robust correlations between neural measures of connectivity and motor impairment. Such an approach is similar to graph theoretical approaches that examine stroke-related changes in cortical motor network centrality (Wang et al., 2010; Yin et al., 2014). While graph theory analysis requires a priori definition of network nodes, PLS is a whole brain approach for identifying regions of interest, and may be less likely to overlook contributions from brain regions that were not considered at the outset, such as the contribution of larger M1–PAR connectivity across therapy as a biomarker of smaller motor gains; increased M1–PAR connectivity may reflect greater reliance on regions posterior to ipsilesional M1, a compensatory mechanism associated with greater damage to the motor system (Pineiro et al., 2001; Cramer, 2008a). Notably, the structure of the models is defined by brain states of the specific patients enrolled in the study and are likely also influenced by therapy content. These caveats underscore the need to further evaluate the current model more broadly, e.g. in separate and different stroke populations, with a different class of therapeutic intervention, or in relation to non-motor deficits after stroke.
High intersubject variability in response to treatment is common after stroke and is an important concern in clinical stroke research (Bath et al., 2012; Saleh et al., 2012; Várkuti et al., 2013). Serial measurement of brain functional connectivity over a course of rehabilitation therapy has the potential to provide biological insights into this variability and thereby improve the precision with which post-acute care is prescribed. As the current methods demonstrate a consistent relationship between ipsilesional M1–premotor coherence and Fugl-Meyer score at each of the four exams spanning the 28 days of therapy, the EEG-derived measure of connectivity therefore seems to be a reliable neural marker of motor system status after stroke. Parallels between previous reports and the current results with respect to ipsilesional M1–premotor connectivity and post-stroke motor status suggest validity of the current EEG-based methods as a neural probe of motor system function after stroke. In addition, as data could be obtained at all 48 EEG sessions, with no EEG exam excluded due to reasons such as hardware malfunction or excessive movement artefact during data acquisition, the present EEG-based methods may be less restrictive as compared to functional MRI-based methods, which exclude some individuals such as those with certain metal implants. EEG is a safe and relatively inexpensive neuroimaging method that can be rapidly performed at the bedside and so may be useful in complex clinical settings such as acute stroke (Luu et al., 2001), where measuring brain function has historically been challenging. In addition, targeted engagement of a specific brain network (Sulzer et al., 2013) such as the ipsilesional premotor circuit (Dodakian et al., 2013) is a strategy that might be useful for maximizing rehabilitation gains, and that would benefit from availability of a brain state biomarker at the bedside. Together, the current results suggest that EEG measures of cortical connectivity may have value as biomarkers of cortical function and plasticity after stroke.
Acknowledgements
The authors wish to thank K. Pearson-Fuhrhop for assistance acquiring EEG data, as well as A. Kaur and N. Varzhapetyan for help with data analysis. Dr Cramer has served as a consultant for GlaxoSmithKline, Dart Neuroscience, the RAND Corporation, and MicroTransponder.
Glossary
Abbreviations
- M1
primary motor cortex
- PAR
parietal cortex
- PLS
partial least squares
- PM
frontal-premotor cortex
Funding
Support for this research was provided by the NINDS (R01 NS059909 and K24 HD074722), the UC Irvine School of Medicine Dean’s Triumvirate Grant, and the UC Irvine ICTS (UL1 TR000153 and TL1 TR000148).
References
- Andersson CA, Bro R. The N-way Toolbox for MATLAB. Chemom Intell Lab Syst 2000; 52: 1–4. [Google Scholar]
- Bath PMW, Lees KR, Schellinger PD, Altman H, Bland M, Hogg C, et al. Statistical analysis of the primary outcome in acute stroke trials. Stroke 2012; 1171–8. [DOI] [PubMed] [Google Scholar]
- Burke E, Cramer SC. Biomarkers and predictors of restorative therapy effects after stroke. Curr Neurol Neurosci Rep 2013; 13: 329. [DOI] [PMC free article] [PubMed] [Google Scholar]
- Burke E, Dobkin B, Noser E, Enney L, Cramer S. Predictors and biomarkers of treatment gains in a clinical stroke trial targeting the lower extremity. Stroke 2014a; 45: 2379–84. [DOI] [PMC free article] [PubMed] [Google Scholar]
- Burke E, Dodakian L, See J, McKenzie A, Riley J, Le V, et al. A multimodal approach to understanding motor impairment and disability after stroke. J Neurol 2014b; 261: 1178–86. [DOI] [PubMed] [Google Scholar]
- Burke Quinlan E, Dodakian L, See J, McKenzie A, Le V, Wojnowicz M, et al. Neural function, injury, and stroke subtype predict treatment gains after stroke. Ann Neurol 2015; 1–14. [DOI] [PMC free article] [PubMed] [Google Scholar]
- Carey JR, Kimberley TJ, Lewis SM, Auerbach EJ, Dorsey L, Rundquist P, et al. Analysis of fMRI and finger tracking training in subjects with chronic stroke. Brain 2002; 125: 773–88. [DOI] [PubMed] [Google Scholar]
- Carey LM, Abbott DF, Egan GF, O’Keefe GJ, Jackson GD, Bernhardt J, et al. Evolution of brain activation with good and poor motor recovery after stroke. Neurorehabil Neural Repair 2006; 20: 24–41. [DOI] [PubMed] [Google Scholar]
- Carter AR, Astafiev SV, Lang CE, Connor LT, Rengachary J, Strube MJ, et al. Resting interhemispheric functional magnetic resonance imaging connectivity predicts performance after stroke. Ann Neurol 2010; 67: 365–75. [DOI] [PMC free article] [PubMed] [Google Scholar]
- Carter AR, Patel KR, Astafiev SV, Snyder AZ, Rengachary J, Strube MJ, et al. Upstream dysfunction of somatomotor functional connectivity after corticospinal damage in stroke. Neurorehabil Neural Repair 2012a; 26: 7–19. [DOI] [PMC free article] [PubMed] [Google Scholar]
- Carter AR, Shulman GL, Corbetta M. Why use a connectivity-based approach to study stroke and recovery of function?. Neuroimage 2012b; 62: 2271–80. [DOI] [PMC free article] [PubMed] [Google Scholar]
- Chen R, Gerloff C, Hallett M, Cohen LG. Involvement of the ipsilateral motor cortex in finger movements of different complexities. Ann Neurol 1997; 41: 247–54. [DOI] [PubMed] [Google Scholar]
- Cramer S, Crafton K. Somatotopy and movement representation sites following cortical stroke. Exp Brain Res 2006; 168: 25–32. [DOI] [PubMed] [Google Scholar]
- Cramer SC. Repairing the human brain after stroke: I. Mechanisms of spontaneous recovery. Ann Neurol 2008a; 63: 272–87. [DOI] [PubMed] [Google Scholar]
- Cramer SC. Repairing the human brain after stroke. II. Restorative therapies. Ann Neurol 2008b; 63: 549–60. [DOI] [PubMed] [Google Scholar]
- Cramer SC. Stratifying patients with stroke in trials that target brain repair. Stroke 2010; 41: S114–6. [DOI] [PubMed] [Google Scholar]
- Dawes H, Enzinger C, Johansen-Berg H, Bogdanovic M, Guy C, Collett J, et al. Walking performance and its recovery in chronic stroke in relation to extent of lesion overlap with the descending motor tract. Exp Brain Res 2008; 186: 325–33. [DOI] [PubMed] [Google Scholar]
- Deco G, Jirsa VK, McIntosh AR. Emerging concepts for the dynamical organization of resting-state activity in the brain. Nat Rev Neurosci 2011; 12: 43–56. [DOI] [PubMed] [Google Scholar]
- Deeny SP, Haufler AJ, Saffer M, Hatfield BD. Electroencephalographic coherence during visuomotor performance: a comparison of cortico-cortical communication in experts and novices. J Mot Behav 2009; 41: 106–16. [DOI] [PubMed] [Google Scholar]
- Delorme A, Makeig S. EEGLAB: an open source toolbox for analysis of single-trial EEG dynamics including independent component analysis. J Neurosci Methods 2004; 134: 9–21. [DOI] [PubMed] [Google Scholar]
- Delorme A, Sejnowski T, Makeig S. Enhanced detection of artifacts in EEG data using higher-order statistics and independent component analysis. Neuroimage 2007; 34: 1443–49. [DOI] [PMC free article] [PubMed] [Google Scholar]
- de Vico Fallani F, Astolfi L, Cincotti F, Mattia D, la Rocca D, Maksuti E, et al. Evaluation of the brain network organization from EEG signals: a preliminary evidence in stroke patient. Anat Rec 2009; 292: 2023–31. [DOI] [PubMed] [Google Scholar]
- Dodakian L, McKenzie A, Burke E, See J, Zhou R, Augsberger R, et al. A home-based telerehabilitation system for patients with stroke. In: International Stroke Conference, San Diego, CA, 2014. Page 74 (abstract). [Google Scholar]
- Dodakian L, Sharp K, See J, Abidi N, Mai K, Fling B, et al. Targeted engagement of a dorsal premotor circuit in the treatment of post-stroke paresis. NeuroRehabilitation 2013; 33: 13–24. [DOI] [PubMed] [Google Scholar]
- Dubovik S, Pignat J-M, Ptak R, Aboulafia T, Allet L, Gillabert N, et al. The behavioral significance of coherent resting-state oscillations after stroke. Neuroimage 2012; 61: 249–57. [DOI] [PubMed] [Google Scholar]
- Gerloff C, Bushara K, Sailer A, Wassermann EM, Chen R, Matsuoka T, et al. Multimodal imaging of brain reorganization in motor areas of the contralesional hemisphere of well recovered patients after capsular stroke. Brain 2006; 129: 791–808. [DOI] [PubMed] [Google Scholar]
- Grefkes C, Fink GR. Reorganization of cerebral networks after stroke: new insights from neuroimaging with connectivity approaches. Brain 2011; 134: 1264–76. [DOI] [PMC free article] [PubMed] [Google Scholar]
- Grefkes C, Nowak DA, Eickhoff SB, Dafotakis M, Kust J, Karbe H, et al. Cortical connectivity after subcortical stroke assessed with functional magnetic resonance imaging. Ann Neurol 2008; 63: 236–46. [DOI] [PubMed] [Google Scholar]
- Hampson M, Driesen N, Skudlarski P, Gore J, Constable R. Brain connectivity related to working memory performance. J Neurosci 2006; 26: 13338–43. [DOI] [PMC free article] [PubMed] [Google Scholar]
- Hardwick R, Rottschy C, Miall R, Eickhoff S. A quantitative meta-analysis and review of motor learning in the human brain. Neuroimage 2013; 67: 283–97. [DOI] [PMC free article] [PubMed] [Google Scholar]
- Homan R, Herman J, Purdy P. Cerebral location of international 10‐20 system electrode placement. Electroencephalogr. Clin Neurophysiol 1987; 66: 376–82. [DOI] [PubMed] [Google Scholar]
- Huang X, Qin G, Fang Y. Optimal combinations of diagnostic tests based on AUC. Biometrics 2011; 67: 568–76. [DOI] [PubMed] [Google Scholar]
- James GA, Lu ZL, VanMeter JW, Sathian K, Hu XP, Butler AJ. Changes in resting state effective connectivity in the motor network following rehabilitation of upper extremity poststroke paresis. Top Stroke Rehabil 2009; 16: 270–81. [DOI] [PMC free article] [PubMed] [Google Scholar]
- Jiang T, He Y, Zang Y, Weng X. Modulation of functional connectivity during the resting state and the motor task. Hum Brain Mapp 2004; 22: 63–71. [DOI] [PMC free article] [PubMed] [Google Scholar]
- Johansen-Berg H, Dawes H, Guy C, Smith SM, Wade DT, Matthews PM. Correlation between motor improvements and altered fMRI activity after rehabilitative therapy. Brain 2002; 125: 2731–42. [DOI] [PubMed] [Google Scholar]
- Johansen-Berg H, Rushworth MF, Bogdanovic MD, Kischka U, Wimalaratna S, Matthews PM. The role of ipsilateral premotor cortex in hand movement after stroke. Proc Natl Acad Sci USA 2002; 99: 14518–23. [DOI] [PMC free article] [PubMed] [Google Scholar]
- Kang L, Liu A, Tian L. Linear combination methods to improve diagnostic/prognostic accuracy on future observations. Stat Methods Med Res 2013, in press. Available from: http://www.ncbi.nlm.nih.gov/pubmed/23592714. [DOI] [PMC free article] [PubMed] [Google Scholar]
- Kantak SS, Stinear JW, Buch ER, Cohen LG. Rewiring the brain: potential role of the premotor cortex in motor control, learning, and recovery of function following brain injury. Neurorehabil Neural Repair 2012; 26: 282–92. [DOI] [PMC free article] [PubMed] [Google Scholar]
- Krishnan A, Williams LJ, McIntosh AR, Abdi H. Partial Least Squares (PLS) methods for neuroimaging: a tutorial and review. Neuroimage 2011; 56: 455–75. [DOI] [PubMed] [Google Scholar]
- Krishnan L, Kang A, Sperling G, Srinivasan R. Neural strategies for selective attention distinguish fast-action video game players. Brain Topogr 2013; 26: 83–97. [DOI] [PMC free article] [PubMed] [Google Scholar]
- Lindenberg R, Renga V, Zhu L, Betzler F, Alsop D, Schlaug G. Structural integrity of corticospinal motor fibers predicts motor impairment in chronic stroke. Neurology 2010; 74: 280–7. [DOI] [PMC free article] [PubMed] [Google Scholar]
- Loubinoux I, Carel C, Pariente J, Dechaumont S, Albucher JF, Marque P, et al. Correlation between cerebral reorganization and motor recovery after subcortical infarcts. Neuroimage 2003; 20: 2166–80. [DOI] [PubMed] [Google Scholar]
- Luu P, Tucker DM, Englander R, Lockfeld A, Lutsep H, Oken B. Localizing acute stroke-related EEG changes: assessing the effects of spatial undersampling. J Clin Neurophysiol 2001; 18: 302–17. [DOI] [PubMed] [Google Scholar]
- Marshall RS, Zarahn E, Alon L, Minzer B, Lazar RM, Krakauer JW. Early imaging correlates of subsequent motor recovery after stroke. Ann Neurol 2009; 65: 596–602. [DOI] [PMC free article] [PubMed] [Google Scholar]
- Menzies L, Achard S, Chamberlain S, Fineberg N, Chen C, del Campo N, et al. Neurocognitive endophenotypes of obsessive-compulsive disorder. Brain 2007; 130: 3223–36. [DOI] [PubMed] [Google Scholar]
- Mihara M, Hattori N, Hatakenaka M, Yagura H, Kawano T, Hino T, et al. Near-infrared spectroscopy-mediated neurofeedback enhances efficacy of motor imagery-based training in poststroke victims: a pilot study. Stroke 2013; 44: 1091–8. [DOI] [PubMed] [Google Scholar]
- Murase N, Duque J, Mazzocchio R, Cohen LG. Influence of interhemispheric interactions on motor function in chronic stroke. Ann Neurol 2004; 55: 400–9. [DOI] [PubMed] [Google Scholar]
- Nunez PL, Srinivasan R. Electric fields of the brain. 2nd edn New York, NY: Oxford University Press; 2006. [Google Scholar]
- Park CH, Chang WH, Ohn SH, Kim ST, Bang OY, Pascual-Leone A, et al. Longitudinal changes of resting-state functional connectivity during motor recovery after stroke. Stroke 2011; 42: 1357–62. [DOI] [PMC free article] [PubMed] [Google Scholar]
- Pfurtscheller G, Stancák a, Neuper C. Post-movement beta synchronization. A correlate of an idling motor area? Electroencephalogr Clin Neurophysiol 1996; 98: 281–93. [DOI] [PubMed] [Google Scholar]
- Pineiro R, Pendlebury S, Johansen-Berg H, Matthews P. Functional MRI detects posterior shifts in primary sensorimotor cortex activation after stroke: evidence of local adaptive reorganization?. Stroke 2001; 32: 1134–9. [DOI] [PubMed] [Google Scholar]
- Rathore SS, Hinn AR, Cooper LS, Tyroler HA, Rosamond WD. Characterization of incident stroke signs and symptoms: findings from the atherosclerosis risk in communities study. Stroke 2002; 33: 2718–21. [DOI] [PubMed] [Google Scholar]
- Rehme AK, Eickhoff SB, Wang LE, Fink GR, Grefkes C. Dynamic causal modeling of cortical activity from the acute to the chronic stage after stroke. Neuroimage 2011; 55: 1147–58. [DOI] [PMC free article] [PubMed] [Google Scholar]
- Riley JD, Le V, Der-Yeghiaian L, See J, Newton JM, Ward NS, et al. Anatomy of stroke injury predicts gains from therapy. Stroke 2011; 42: 421–26. [DOI] [PMC free article] [PubMed] [Google Scholar]
- Roopun AK, Middleton SJ, Cunningham MO, LeBeau FEN, Bibbig A, Whittington M a, et al. A beta2-frequency (20‐30 Hz) oscillation in nonsynaptic networks of somatosensory cortex. Proc Natl Acad Sci USA 2006; 103: 15646–50. [DOI] [PMC free article] [PubMed] [Google Scholar]
- Saleh S, Adamovich SV, Tunik E. Resting state functional connectivity and task-related effective connectivity changes after upper extremity rehabilitation: a pilot study. In: Annual International Conference of the IEEE Engineering in Medicine and Biology Society 2012. p. 4559–62. [DOI] [PMC free article] [PubMed] [Google Scholar]
- Saltzberg B, Burton WD, Burch NR, Fletcher J, Michaels R. Electrophysiological measures of regional neural interactive coupling. Linear and non-linear dependence relationships among multiple channel electroencephalographic recordings. Int J Biomed Comput 1986; 18: 77–87. [DOI] [PubMed] [Google Scholar]
- Schaechter J, van Oers C, Groisser B, Salles S, Vangel M, Moore C, et al. Increase in sensorimotor cortex response to somatosensory stimulation over subacute poststroke period correlates with motor recovery in hemiparetic patients. Neurorehabil Neural Repair 2012; 26: 325–34. [DOI] [PubMed] [Google Scholar]
- See J, Dodakian L, Chou C, Chan V, McKenzie A, Reinkensmeyer D, et al. A standardized approach to the Fugl-Meyer assessment and its implications for clinical trials. Neurorehabil Neural Repair 2013; 27: 732–41. [DOI] [PubMed] [Google Scholar]
- Seitz RJ, Höflich P, Binkofski F, Tellmann L, Herzog H, Freund HJ. Role of the premotor cortex in recovery from middle cerebral artery infarction. Arch Neurol 1998; 55: 1081–8. [DOI] [PubMed] [Google Scholar]
- Sharma N, Baron J-C, Rowe JB. Motor imagery after stroke: relating outcome to motor network connectivity. Ann Neurol 2009; 66: 604–16. [DOI] [PMC free article] [PubMed] [Google Scholar]
- Stinear C, Barber PA, Smale P, Coxon J, Fleming M, Byblow W. Functional potential in chronic stroke patients depends on corticospinal tract integrity. Brain 2007; 130: 170–80. [DOI] [PubMed] [Google Scholar]
- Sulzer J, Haller S, Scharnowski F, Weiskopf N, Birbaumer N, Blefari M, et al. Real-time fMRI neurofeedback: progress and challenges. Neuroimage 2013; 76: 386–99. [DOI] [PMC free article] [PubMed] [Google Scholar]
- Takahashi CD, Der-Yeghiaian L, Le V, Motiwala RR, Cramer SC. Robot-based hand motor therapy after stroke. Brain 2008; 131: 425–37. [DOI] [PubMed] [Google Scholar]
- Tambini A, Ketz N, Davachi L. Enhanced brain correlations during rest are related to memory for recent experiences. Neuron 2010; 65: 280–90. [DOI] [PMC free article] [PubMed] [Google Scholar]
- van Meer M, van der Marel K, Wang K, Otte W, el Bouazati S, Roeling T, et al. Recovery of sensorimotor function after experimental stroke correlates with restoration of resting-state interhemispheric functional connectivity. J Neurosci 2010; 30: 3964–72. [DOI] [PMC free article] [PubMed] [Google Scholar]
- Várkuti B, Guan C, Pan Y, Phua KS, Ang KK, Kuah CWK, et al. Resting state changes in functional connectivity correlate with movement recovery for BCI and robot-assisted upper-extremity training after stroke. Neurorehabil. Neural Repair 2013; 27: 53–62. [DOI] [PubMed] [Google Scholar]
- Wang L, Yu C, Chen H, Qin W, He Y, Fan F, et al. Dynamic functional reorganization of the motor execution network after stroke. Brain 2010; 133: 1224–38. [DOI] [PubMed] [Google Scholar]
- Ward N, Brown M, Thompson A, Frackowiak R. Neural correlates of outcome after stroke: a cross-sectional fMRI study. Brain 2003a; 126: 1430–48. [DOI] [PMC free article] [PubMed] [Google Scholar]
- Ward NS, Brown MM, Thompson AJ, Frackowiak RS. Neural correlates of motor recovery after stroke: a longitudinal fMRI study. Brain 2003b; 126: 2476–96. [DOI] [PMC free article] [PubMed] [Google Scholar]
- Wei W, Bai L, Wang J, Dai R, Tong RK, Zhang Y, et al. A longitudinal study of hand motor recovery after sub-acute stroke: a study combined FMRI with diffusion tensor imaging. PLoS One 2013; 8: e64154. [DOI] [PMC free article] [PubMed] [Google Scholar]
- Westerhuis JA, de Jong S, Smilde AK. Direct orthogonal signal correction. Chemom Intell Lab Syst 2001; 56: 13–25. [Google Scholar]
- Wu J, Srinivasan R, Kaur A, Cramer S. Resting-state cortical connectivity predicts motor skill acquisition. Neuroimage 2014; 91: 84–90. [DOI] [PMC free article] [PubMed] [Google Scholar]
- Yin D, Song F, Xu D, Sun L, Men W, Zang L, et al. Altered topological properties of the cortical motor-related network in patients with subcortical stroke revealed by graph theoretical analysis. Hum Brain Mapp 2014; 35: 3343–59. [DOI] [PMC free article] [PubMed] [Google Scholar]
- Zhu LL, Lindenberg R, Alexander MP, Schlaug G. Lesion load of the corticospinal tract predicts motor impairment in chronic stroke. Stroke 2010; 41: 910–15. [DOI] [PMC free article] [PubMed] [Google Scholar]