

Abstract
Background.
Caloric restriction (CR), energy intake reduced below ad libitum (AL) intake, increases life span in many species. The implications for humans can be clarified by randomized controlled trials of CR.
Methods.
To determine CR’s feasibility, safety, and effects on predictors of longevity, disease risk factors, and quality of life in nonobese humans aged 21–51 years, 218 persons were randomized to a 2-year intervention designed to achieve 25% CR or to AL diet. Outcomes were change from baseline resting metabolic rate adjusted for weight change (“RMR residual”) and core temperature (primary); plasma triiodothyronine (T3) and tumor necrosis factor-α (secondary); and exploratory physiological and psychological measures.
Results.
Body mass index averaged 25.1 (range: 21.9–28.0kg/m2). Eighty-two percent of CR and 95% of AL participants completed the protocol. The CR group achieved 11.7±0.7 %CR (mean ± standard error) and maintained 10.4±0.4% weight loss. Weight change in AL was negligible. RMR residual decreased significantly more in CR than AL at 12 months (p = .04) but not 24 months (M24). Core temperature change differed little between groups. T3 decreased more in CR at M12 and M24 (p < .001), while tumor necrosis factor-α decreased significantly more only at M24 (p = .02). CR had larger decreases in cardiometabolic risk factors and in daily energy expenditure adjusted for weight change, without adverse effects on quality of life.
Conclusions.
Sustained CR is feasible in nonobese humans. The effects of the achieved CR on correlates of human survival and disease risk factors suggest potential benefits for aging-related outcomes that could be elucidated by further human studies.
Key Words: Metabolism, Nutrition, Risk factors, Biomarkers, Caloric restriction
Caloric restriction (CR), defined as lessening caloric intake without depriving essential nutrients, beginning early or in mid-life and sustained over the life span, increases longevity and delays or slows progression of multiple age-related diseases in many, but not all, laboratory animal models (1–4). Observational studies of persons voluntarily practicing long-term CR suggest that it favorably affects chronic disease risk factors and has several parallel effects to those in laboratory animals (5). However, the extent to which physiologic and clinical profiles of these self-selected persons reflect effects of CR versus other factors is unknown.
Although clinical trials have yielded considerable information on the effect of weight loss on obesity-related conditions, data from controlled studies in nonobese persons on CR’s effects on aging-related outcomes are sparse. In pilot trials for the present study, 6–12 months of CR in overweight but nonobese persons favorably affected risk factors for several conditions affecting health span (6–8). One (7) also provided evidence for metabolic slowing, reduced core temperature, and lowered triiodothyronine (T3), which are effects found in many laboratory animal CR studies and proposed to contribute to CR’s effects on life span.
Whether CR extends life span in humans will probably never be determined in randomized clinical trials. However, intermediate-length trials can determine its feasibility, safety, and effects on quality of life, disease risk factors, and predictors of life span. To assess these outcomes over 2 years of CR in young- and middle-aged nonobese men and women, we conducted a three-site randomized controlled trial, CALERIE (Comprehensive Assessment of Long term Effects of Reducing Intake of Energy).
Methods
CALERIE’s rationale and design were described previously (9). Detailed methods are described in the online Supplementary Material.
Study Participants
CALERIE’s age range (21–50 years) was selected to be comparable to the life stage when many “adult onset” CR studies showing substantial effects on life span and aging were begun in rodents. The body mass index (BMI) range (22.0 ≤ BMI < 28kg/m2) was selected to examine CR’s effects in both normal weight and moderately overweight persons. Exclusion criteria (detailed in ref. 9) included significant medical conditions (eg, cardiovascular disease or diabetes), abnormal laboratory markers (eg, elevated potassium, or below-normal hemoglobin levels), present or potential psychiatric or behavioral problems (eg, eating disorders or depressive symptoms), regular use of medications except oral contraceptives, current smoking, a high level of regular physical activity, and pregnancy.
Details on recruitment and screening are reported elsewhere (10) and in Figure 1. CALERIE’s target sample size was 225, with 2:1 ratio randomization to the CR intervention versus an “ad libitum” (AL) control group who continued their habitual diet. Randomization was stratified by site, sex, and BMI dichotomized into normal weight (22.0 ≤ BMI < 25.0kg/m2) and overweight (25.0 ≤ BMI < 28.0kg/m2).
Figure 1.

CONSORT diagram. After an extensive screening process (10), 238 individuals were eligible and 220 individuals were randomized. Two individuals, both assigned to the CR group, dropped out prior to starting the intervention, resulting in an ITT cohort of 218 participants; 75 in the AL control and 143 in the CR group (Table 1). Thirty participants were withdrawn or dropped from the intervention prior to completion including 4 (5.3%) in the AL control group and 26 (18.2%) in the CR group (p = .01). Three CR participants nevertheless continued their evaluations, and following ITT principles were included in all analyses. The 27 participants who failed to provide complete data tended to be younger and better educated (p = .01 for both); otherwise, there were no significant differences with respect to other demographic variables, body composition, dietary intake, metabolic parameters, core temperature, markers of inflammation, and safety parameters at baseline (data not shown). Across the time points, there were observations from 211 participants at month 6, 201 at month 12, 193 at month 18, and 191 at month 24. AL = ad libitum; CR = caloric restriction; ITT = intention-to-treat.
Intervention and Adherence Measurements
The intervention was designed to achieve 25% CR, defined as a 25% reduction from AL baseline energy intake. The target level of 25% CR was selected because this degree of CR strongly affects life span and health span in animal models, and was found to be feasible in most participants in a 6-month CALERIE pilot study (7). An intensive 2-year behavioral intervention was designed to facilitate 25% CR (11).
Baseline AL energy intake was assessed by two consecutive 14-day measures of total daily energy expenditure (TDEE) using doubly labeled water (12). Average %CR over 6-month intervals was retrospectively calculated by the intake-balance method with simultaneous measurements of TDEE using doubly labeled water and changes in body composition (13,14). Since these objective measures of %CR were not feasible more than twice a year, participants were provided a “real time proxy” for adherence: a trajectory of weekly expected weight change reaching 15.5% weight loss by 1 year, with an acceptable range of 11.9%–22.1%, followed by weight maintenance. This trajectory was based on a model derived from our phase 1 studies that predicted weekly changes in body weight for 1 year of 25% CR (15).
Outcomes
The two prespecified primary outcomes were selected to test the hypothesis that CR would induce metabolic adaptations, specifically (a) decrease in resting metabolic rate (RMR) adjusted for changes in body composition and (b) decrease in core body temperature. Change in RMR was defined as “RMR residual,” that is, the difference between an individual’s RMR measured by indirect calorimetry during the intervention and RMR predicted from a regression of RMR as a function of fat mass and fat-free mass in participants at baseline. (Details on calculation of RMR residuals are included in the online Supplementary Material) Such metabolic adaptations to CR in laboratory animals have been proposed to slow aging by reducing metabolic production of reactive oxygen species and/or lowering core temperature (1,16). Lower core temperature has also been found to predict human longevity in longitudinal studies (17).
Changes in circulating T3 and tumor necrosis factor-alpha (TNF-α) were prespecified secondary outcomes, based on evidence suggesting relationships of the thyroid axis and inflammatory mediators to longevity and health span and effects of CR on these factors (5,7,18,19). Exploratory outcomes included risk factors for age-related conditions and psychological responses.
Study outcomes were evaluated at baseline, 6, 12, 18, and 24 months with a primary focus on baseline, 12 months, and 24 months. Methods to assess outcomes are described in online Supplementary Material.
Participants were given diaries to record signs, symptoms, and other adverse events occurring during the study. All adverse events were coded using the Medical Dictionary for Medical Affairs (MedDRA), version 14.4. During the study, participants were also monitored for anemia, changes in bone mineral density, and signs of eating disorders.
Statistical Methods
Statistical analysis was performed under intention-to-treat principles following a plan prespecified before initiation of analyses. Observations were included irrespective of protocol violations or poor adherence; data were collected as far as possible beyond discontinuing the intervention and included in the analysis. Between-group differences with respect to demographics and other baseline characteristics, or between those completing versus failing to complete the evaluations, were assessed using the Wilcoxon test and the Fisher exact test. Because observations were taken repeatedly from the same individual, the primary analytic vehicle was a repeated measures analysis (20,21). The dependent variable was the change from baseline to the individual time points, with treatment, time, and the treatment × time interaction as independent variables. Design variables, that is, site, sex, and BMI stratum, as well as the baseline value of the outcome were included as covariates to increase precision. To avoid arbitrary modeling assumptions, time was treated as a categorical variable; similarly, an unstructured model was applied for the covariance matrix among the repeated observations. All hypotheses, for example, main effects, interactions, within-group changes over time, and between-group differences at the individual time points, were tested by defining contrasts among the associated regression parameters. The predicted mean changes ± standard errors are the adjusted values from these contrasts. Because C-reactive protein (CRP) was skewed toward the higher values, we followed the approach in Huffman et al. (22) and analyzed on the natural logarithm scale without adjusting for the baseline value. For any outcome, Type I error was controlled using a hierarchical gatekeeping strategy (23). The treatment × visit interaction term was tested first. If significant, then following standard statistical practice, between-group differences at each time point were tested at α = .05. If not, the treatment main effect was tested next. If significant, then between-group differences at each time point were tested at α = .05. Otherwise a Bonferroni correction was applied at each time point, with the p values adjusted by multiplying the nominal p value by the number of tests (truncated at 1.0) (24). Within-group changes from baseline to the follow-up visits, however, fell outside this hierarchy and were always protected by a Bonferroni correction. Supplemental analyses to determine whether changes over time in one variable were associated with that in another were performed using the Spearman correlation. All analyses were performed using SAS version 9.2 (Cary, NC). Results are reported as mean ± standard error except when otherwise noted.
Results
Participants
Totally, 238 individuals were eligible and commenced baseline assessments; 220 were randomized and 218 started the intervention (Figure 1), with 82% of CR and 95% of AL completing the 2-year protocol. The cohort was predominantly female (69.7%) and Caucasian (77.1%) with ages from 20.7 to 50.8 years. Mean ± standard deviation BMI was 25.1±1.7kg/m2, and was slightly lower among women. The cohort had normal blood pressures, fasting blood glucose, insulin and lipids at baseline. No significant differences were observed between groups at baseline. Complete demographic, anthropometric, and clinical characteristics at baseline are presented in online Supplementary eTable 1.
Adherence and Weight Loss
Baseline mean ± standard error energy intake (assessed as TDEE during weight stability) did not differ significantly between AL and CR: 2,390±45 and 2,467±34 kcal/d, respectively (p = .15). Mean daily energy intake over the first 6 months of the intervention declined from baseline (Figure 2A) in CR by 480±20 kcal/d during the first 6 months of intervention, then stabilized at approximately 234±19 kcal/d below baseline for the remainder of the trial, resulting in CR averaging 11.7±0.7% over 2 years (19.5±0.8% during the first 6 months and 9.1±0.7% on average for the remainder of the study). %CR in the AL group was 1.3±1.1% over the first 12 months and 0.4±1.1% over the second 12 months, p < .001 versus CR. Weight loss (Figure 2B) was significant in CR: 7.1±0.2kg (9.9±0.3%) at 6 months, 8.3±0.3kg at 12 months (11.5±0.4%), and 7.6±0.3kg at 24 months (10.4±0.4%), all p < .0001. The decrease in lean body mass from baseline was 2.0±0.1kg (4.2±0.2%) at 6 months, 2.0±0.1kg at 12 months (4.3±0.3%) and 2.0±0.2kg at 24 months (4.4±0.3%), all p < .001. Change in weight was predominantly due to body fat loss (74% fat at 6 months, 74% fat at 12 months, and 69% fat at 24 months).
Figure 2.
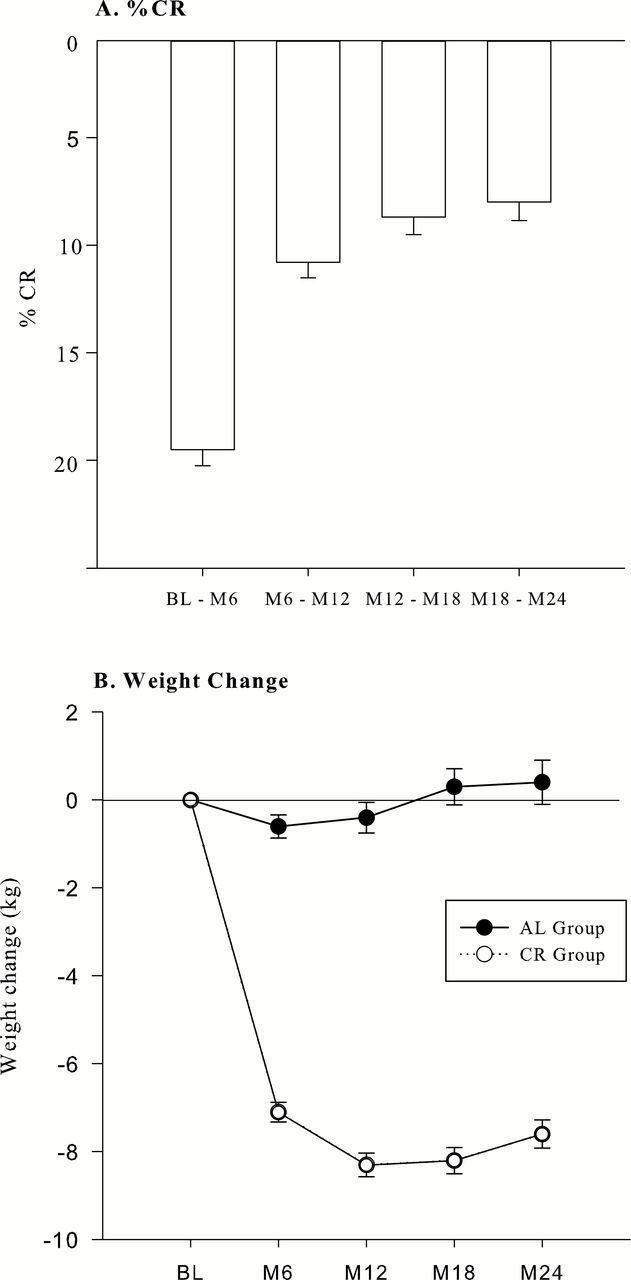
Caloric restriction (A, only in the CR group) and weight change (B) over the course of the intervention in ad libitum (---) and CR (___) groups (values are means ± standard error). Bars in A indicate mean values over the designated intervals. Points in B indicate values at individual time points. %CR in the AL group was measured for the intervals BL-M12 (1.3±1.1%) and M12-M24 (0.4±1.1%), p < .001 vs CR. AL = ad libitum; BL = baseline; CR = caloric restriction.
Safety and Quality of Life
There were no deaths and eight serious adverse events (seven AL, one CR), none considered to be related to the intervention. Six women (three AL, three CR) became pregnant and were permanently withdrawn according to the protocol. Eight CR participants were temporarily discontinued from the intervention for safety concerns: one for a BMI <18.5kg/m2, three for a decrease in bone mineral density ≥5% from baseline, and four for treatment-resistant anemia. Five resumed the intervention after these problems resolved. The bone mineral density deficit in one participant and anemia in two participants did not resolve and they were permanently withdrawn from the intervention. The small bone mineral density decreases (lumbar spine and femoral neck) in the CR group significantly exceeded those in the AL control group. Monitoring for eating disorders found no incident events. Adverse events are summarized in online Supplementary eTable 2. Incidence of at least one adverse event was similarly high among AL (96.0%) and CR (95.1%) participants.
We found no significant adverse effects of CR on a broad range of quality of life variables including mood, self-reported hunger, sexual function, and cognitive function, using validated measures of all constructs. These results are shown in online Supplementary eTable 3.
RMR, TDEE, and Core Temperature
Effects on our two prespecified primary outcomes (RMR residual and core temperature) are presented in Table 1 and Figure 3. Although decreases from baseline in absolute RMR in CR (5.9±0.7% and 5.0±0.9% at 12 and 24 months, respectively) significantly exceeded those in AL, RMR residual decreased significantly more in CR compared with AL at 12 months (48±9 vs 14±12 kcal/d in AL, p = .04) (Figure 3A), representing a larger decline in RMR than predicted on the basis of changes in fat-free and fat mass, but decreases did not differ significantly between CR and AL at 24 months. TDEE decreased significantly more in CR than AL (Table 1). TDEE residual also decreased by 164±19 and 157±21 kcal/d at 12 and 24 months, respectively, significantly more than in AL (Figure 3B; 44±26 and 58±27 kcal/d; p < .001 at 12 months and p = .003 at 24 months). Mean 24-hour core temperature decreased from baseline at 12 and 24 months in CR (Table 1), but the small declines did not differ significantly from the change in AL.
Table 1.
Baseline Values and Changes From Baseline for Energy Metabolism Variables and Prespecified Hormones and Markers of Inflammation in Control (AL) and Caloric Restriction (CR) Groups
| Outcome | AL | CR | Between-Group p Value† | ||
|---|---|---|---|---|---|
| Mean (SE)* | Within-Group p Value† | Mean (SE)* | Within-Group p Value† | ||
| Energy metabolism | |||||
| TDEI, kcal/d‡ | |||||
| Baseline | 2,390 (45) | 2,467 (34) | .15 | ||
| Δ Year 1 average | −20 (24) | .84 | −342 (19) | <.001 | <.001 |
| Δ Year 2 average | −4 (25) | 1.0 | −173 (20) | <.001 | <.001 |
| Δ Year 1 and 2 average | −11 (23) | 1.0 | −257 (18) | <.001 | <.001 |
| RMR, kcal/d | |||||
| Baseline | 1,393 (24) | 1,418 (17) | .33 | ||
| Δ Month12 | −1 (13) | 1.0 | −83 (10) | <.001 | <.001 |
| Δ Month24 | −7 (16) | 1.0 | −71 (12) | <.001 | .001 |
| TDEE, kcal/d | |||||
| Baseline | 2,390 (45) | 2,467 (34) | .15 | ||
| Δ Month 12 | −20 (28) | .94 | −193 (22) | <.001 | <.001 |
| Δ Month 24 | −26 (31) | .81 | −181 (24) | <.001 | <.001 |
| 24-h core temperature, °C | |||||
| Baseline | 37.0 (0.03) | 37.0 (0.02) | .41 | ||
| Δ Month 12 | −0.03(.02) | .54 | −0.05 (0.02) | .006 | .70 |
| Δ Month 24 | −0.02 (0.02) | .64 | −0.05 (0.02) | .02 | .84 |
| Hormones and inflammation | |||||
| Triiodothyronine, ng/dLb | |||||
| Baseline | 112.6 (2.8) | 115.6 (2.1) | .41 | ||
| Δ Month 12 | −8.1 (2.3) | <.001 | −18.4 (1.8) | <.001 | <.001 |
| Δ Month 24 | −14.1 (2.0) | <.001 | −25.0 (1.6) | <.001 | <.001 |
| TSH, uIU/mL | |||||
| Baseline | 1.56 (0.12) | 1.53 (0.11) | .92 | ||
| Δ Month 12 | −0.02 (0.07) | 1.0 | −0.21 (0.05) | <.001 | .04 |
| Δ Month 24 | −0.15 (0.07) | .05 | −0.23 (0.05) | <.001 | .63 |
| TNF-α, pg/mLb | |||||
| Baseline | 3.1 (0.1) | 3.5 (0.1) | .24 | ||
| Δ Month 12 | −0.34 (0.12) | .01 | −0.30 (0.09) | .002 | .82 |
| Δ Month 24 | −0.38 (0.14) | .01 | −0.77 (0.11) | <.001 | .02 |
| ln (CRP, μg/mL) | |||||
| Baseline | 1.09 (0.2) | 1.48 (0.3) | .91 | ||
| Δ Month 12§ | 0.003 (0.139) | 1.0 | −0.506 (0.105) | <.001 | .003 |
| Δ Month 24§ | −0.037 (0.125) | 1.0 | −0.458 (0.096) | <.001 | .006 |
Notes: AL = ad libitum diet; CRP = C-reactive protein; RMR = resting metabolic rate; TDEE = total daily energy expenditure; TDEI = total daily energy intake, TNF-α = tumor necrosis factor-α; TSH = thyroid-stimulating hormone. aPrespecified primary outcome. bPrespecified secondary outcome.
*Baseline values are the observed mean (standard error); change scores are the least-squares adjusted means (standard error).
†Within-group p value tests for a significant change from baseline to the follow-up time point in that group; between-group p value tests for a significant between-group difference in the change score at the time point. All p values reflect Bonferroni corrections, truncated at 1.0, as appropriate (see text).
‡Baseline TDEE = baseline TDEI; Δ Year 1 average = average TDEI during BL-M12 interval, minus baseline TDEE; Δ Year 2 average = average TDEI during M12-M24 interval, minus baseline TDEE; Δ Year 1 and 2 average = average TDEI during BL-M24 interval, minus baseline TDEE. (See Methods in Supplementary Material.)
§High-sensitivity CRP was analyzed on the natural log scale without adjusting for the baseline value (see Statistical Methods).
Figure 3.

Changes in resting metabolic rate (RMR) (Panel A) and total daily energy expenditure (TDEE) (Panel B) not attributable to changes in fat-free mass and fat mass at month 12 and month 24 in the AL group (black bars) and the CR group (gray bars). “Measured – Predicted” refers to the difference between measured values and the values predicted by our regression model based on baseline relationships of fat-free mass and fat mass to RMR and TDEE (often called residuals; see Methods section). Values are adjusted means ± standard error. p values refer to differences in change over time between the AL and CR groups. AL = ad libitum; CR = caloric restriction.
Thyroid Axis and Inflammation
Effects on our two prespecified secondary outcomes (circulating T3 and TNF-α) are presented in Table 1. The substantial decreases from baseline within the normal range in circulating T3 in CR (16±1.5% at month 12, 22±1.4% at 24 months) significantly exceeded changes in AL. Thyroid-stimulating hormone reductions in CR also significantly exceeded those in AL at 12 months. In both groups, TNF-α concentration decreased from baseline at 12 months, more so by 24 months (23±3.3% CR, 11±4.2% AL). The decline from baseline to 24 months was significantly greater in CR versus AL. The marked decreases in high-sensitivity CRP from baseline to both time points in CR significantly exceeded changes in AL.
Cardiometabolic Risk Factors
CR broadly affected cardiometabolic risk factors. The decreases in triglycerides and total cholesterol (Figure 4A and B) in CR significantly exceeded those in AL, as did decreases in low-density lipoprotein cholesterol (data not shown). The increase in high-density lipoprotein cholesterol was significantly greater in CR than in AL at 24 months only. Declines in systolic and diastolic blood pressures were also significantly greater in CR than in AL (p = .001), which showed a tendency toward an increase (mean blood pressure shown in Figure 4C). Improvements in glucose control (HOMA-IR) in CR were significantly greater than changes in AL (Figure 4).
Figure 4.

Changes in total cholesterol (A), mean triglycerides (B), HOMA-IR (C), and mean blood pressure (D) at month 12 and month 24 in the AL control (black bars) and CR (gray bars) groups in the ITT analysis. Values are adjusted means ± standard error. p values refer to comparisons of changes over time between the AL control and CR groups. AL = ad libitum; CR = caloric restriction; HOMA-IR = homeostasis model assessment-estimated insulin resistance; ITT = intention-to-treat.
Discussion
This study addresses two long-standing issues regarding implications of CR’s extension of life span and health span in animal models: its feasibility in humans and the degree to which its human effects parallel those in animal models. CALERIE achieved significant CR and sustained weight loss over 2 years in nonobese persons, half with BMI <25kg/m2. To our knowledge, no previous study in any population, not to mention a normal weight population, has demonstrated this degree of sustained CR and weight loss for this length of time. The maintenance of weight stability in the second year of the intervention is particularly noteworthy, because it allowed assessment of CR’s effects during the phase when most CR outcomes in laboratory animal studies have been measured.
Nevertheless, the CR group fell short of achieving the 25% CR goal specified in the protocol. One contributing factor may have been a shortcoming in the target weight trajectory used as a surrogate for 25% CR. Our retrospective intake-balance data suggest that this trajectory would not in fact have achieved 25% CR, particularly in the second year. It is thus uncertain whether more stringent weight loss goals would have yielded larger %CR approaching the 25% target.
Our results indicate that the degree of CR achieved in this study is tolerable and safe, with the qualification that the study had limited statistical power to detect rare adverse events. The dropout rate of 18% in the CR group was lower than projected in our power calculations. It is nonetheless important to recognize that our study, which involved a highly motivated population and very intensive behavioral intervention, provides limited evidence regarding the feasibility of CR in broader nonobese populations or with less intensive interventions.
CR participants did not experience adverse effects on mood, cognition, hunger, or sexual function, nor an increase in serious adverse clinical events. Nonetheless, the small effects on bone and occurrences of transient anemia indicate that clinical monitoring is advisable for nonobese individuals practicing this degree of CR.
For our two primary outcomes, the intervention did not significantly affect core temperature, and its lowering of RMR residual (indicative of metabolic adaptation) differed significantly from AL only in the first year of the intervention. The present findings are at odds with the reductions in both these outcomes in a 6-month CALERIE pilot that achieved 25% CR in overweight persons who were continuing to lose weight at the end of the intervention (7), and with lower core temperature found in self-selected practitioners of CR (25). Such observations suggest that these effects may not persist after weight has stabilized at a lower level, and/or that greater %CR than achieved in the present study is required for their persistence.
The fact that TDEE residual in the CR group declined more than RMR residual, and declined significantly more in CR than in AL over the 2-year intervention, suggests that the CR intervention implemented in this study produced a sustained decrease in nonresting energy expenditure more than expected for the degree of weight loss. These results are consistent with other studies in which diminution of residual TDEE during maintenance of reduced weight was comprised primarily of diminution of nonresting energy expenditure (26). The finding that changes in self-reported physical activity did not differ significantly between AL and CR groups (data not shown) suggests that CR may increase the metabolic efficiency of physical activity, which has been reported in nonhuman primates (27), and/or of other activity. However, given self-reported physical activity measures’ limitations in accuracy and sensitivity to change, additional data are needed to clarify the degrees to which CR affects physical activity levels and metabolic efficiency of physical activity.
Overall, great caution is indicated in speculations about the relationships of our metabolic findings to human longevity. Nevertheless, it is noteworthy that long-term human longitudinal data indicate a positive relationship between mortality rates and energy expenditure independent of BMI (28) or body weight (29).
The decrease in T3 and thyroid-stimulating hormone concentrations in CR participants is of interest in light of findings on the relationship of lowered thyroid activity to longevity in human and animal studies (18). However, a mechanistic role of lowered thyroid function in CR’s effects on longevity in laboratory animals, or in human life span or health span, has not been established. The observed reduction in inflammatory markers (TNF-α and high-sensitivity CRP) parallels several animal CR studies (19). Lowered TNF-α and CRP have also been found in observational studies of persons practicing long-term CR (30). However, human family and heritability studies do not provide consistent evidence for a relationship of CRP and TNF-α levels with longevity (31–33), although many age-related disorders in humans are associated with elevated levels of these markers (33,34). Particularly since baseline concentrations for these analytes in our study were within normal ranges, the significance of our observed effects on these markers for subsequent aging and health span is uncertain.
The effects of CR in this study on multiple cardiometabolic risk factors that were measured as exploratory outcomes were consistently in the direction considered “favorable,” and extend previous similar findings on effects of weight loss in more overweight or obese persons to leaner individuals. Changes in such risk factors of the magnitude in this study, for example, in systolic blood pressure (35), have been estimated to affect mortality and cardiovascular disease risk substantially. However, the implications of such changes for disease incidence in healthy individuals such as those studied here, without elevated levels of these risk factors, have not yet been determined.
A long-standing issue in the interpretation of CR studies has been the degree to which its effects are mediated by lowered energy intake per se or by weight loss. This issue can be addressed directly by intervention studies that include treatment arms yielding equivalent degrees of weight loss produced by CR versus increased energy expenditure from physical activity. A rodent study with such a design found that CR extended both maximum and mean life span, while increased physical activity extended only mean life span (36). A CALERIE pilot study with an analogous design found that CR and physical activity had parallel effects on a variety of metabolic outcomes (8) and on many, but not all, coronary heart disease risk factors (37), some of which were improved significantly only by CR. Although CALERIE did not include multiple treatment arms to address this issue directly, future analyses of CALERIE data on weight loss, %CR, and outcomes could provide additional insights on this point.
In summary, this study provides the first evidence from a randomized controlled trial that sustained CR is both feasible and without adverse effects on quality of life in nonobese humans. The intervention achieved a degree of CR sufficient to affect some, but not all, potential modulators of longevity that have been induced by CR in laboratory animal studies, to influence factors associated with longevity in human observational studies, and to diminish risk factors for age-related cardiovascular and metabolic diseases. The potential impact of CR on human life span and health span could be clarified by studies assessing effects of differing degrees and durations of CR in humans, as well as laboratory animal and human studies to clarify the role of mechanisms implicated in the present findings.
Supplementary Material
Supplementary material can be found at: http://biomedgerontology.oxfordjournals.org/
Funding
This study was supported by the National Institute on Aging; National Institute of Diabetes and Digestive and Kidney Diseases; National Institutes of Health Cooperative Agreements (U01AG022132, U01AG020478, U01AG020487, and U01AG020480).
Conflict of Interest
The authors have no competing conflicts of interest related to the data reported herein.
Supplementary Material
Acknowledgments
Author contributions: Designed the trial—Members of design committee: E.R., L.M.R., D.A.W., S.B.R., S.K.D., J.O.H., W.E.K., J.R., E.C.H., S.R.; Conducted the trial—All individuals who conducted the trial are listed in the Supplementary Material and also in a previous publication (9); Performed the analysis—J.R., M.B.; Final responsibility for content—E.R., L.M.R., W.E.K., J.R., S.R., M.B., E.C.H., S.B.R. with approval from all co-authors. Role of the sponsors: NIA staff was represented on the steering committee, various subcommittees and contributed to the interpretation of data and preparation of this manuscript. ClinicalTrials.gov Identifier: NCT00427193.
References
- 1. Speakman JR, Mitchell SE. Caloric restriction. Mol Aspects Med. 2011;32:159–221. doi:10.1016/j.mam.2011.07.001 [DOI] [PubMed] [Google Scholar]
- 2. Bodkin NL, Alexander TM, Ortmeyer HK, Johnson E, Hansen BC. Mortality and morbidity in laboratory-maintained Rhesus monkeys and effects of long-term dietary restriction. J Gerontol A Biol Sci Med Sci. 2003;58:212–219. [DOI] [PubMed] [Google Scholar]
- 3. Mattison JA, Roth GS, Beasley TM, et al. Impact of caloric restriction on health and survival in rhesus monkeys from the NIA study. Nature. 2012;489:318–321. doi:10.1038/nature11432 [DOI] [PMC free article] [PubMed] [Google Scholar]
- 4. Colman RJ, Beasley TM, Kemnitz JW, Johnson SC, Weindruch R, Anderson RM. Caloric restriction reduces age-related and all-cause mortality in rhesus monkeys. Nat Commun. 2014;5:3557. doi:10.1038/ncomms4557 [DOI] [PMC free article] [PubMed] [Google Scholar]
- 5. Holloszy JO, Fontana L. Caloric restriction in humans. Exp Gerontol. 2007;42(8):709–712. [DOI] [PMC free article] [PubMed] [Google Scholar]
- 6. Das SK, Saltzman E, Gilhooly CH, et al. Low or moderate dietary energy restriction for long-term weight loss: what works best? Obesity (Silver Spring). 2009;17:2019–2024. doi:10.1038/oby.2009.120 [DOI] [PMC free article] [PubMed] [Google Scholar]
- 7. Heilbronn LK, de Jonge L, Frisard MI, et al. ; Pennington CALERIE Team. Effect of 6-month calorie restriction on biomarkers of longevity, metabolic adaptation, and oxidative stress in overweight individuals: a randomized controlled trial. JAMA. 2006;295:1539–1548. [DOI] [PMC free article] [PubMed] [Google Scholar]
- 8. Weiss EP, Racette SB, Villareal DT, et al. ; Washington University School of Medicine CALERIE Group. Improvements in glucose tolerance and insulin action induced by increasing energy expenditure or decreasing energy intake: a randomized controlled trial. Am J Clin Nutr. 2006;84:1033–1042. [DOI] [PMC free article] [PubMed] [Google Scholar]
- 9. Rochon J, Bales CW, Ravussin E, et al. ; CALERIE Study Group. Design and conduct of the CALERIE study: comprehensive assessment of the long-term effects of reducing intake of energy. J Gerontol A Biol Sci Med Sci. 2011;66:97–108. doi:10.1093/gerona/glq168 [DOI] [PMC free article] [PubMed] [Google Scholar]
- 10. Stewart TM, Bhapkar M, Das S, et al. ; CALERIE Study Group. Comprehensive Assessment of Long-term Effects of Reducing Intake of Energy Phase 2 (CALERIE Phase 2) screening and recruitment: methods and results. Contemp Clin Trials. 2013;34:10–20. doi:10.1016/j.cct.2012.08.011 [DOI] [PMC free article] [PubMed] [Google Scholar]
- 11. Rickman AD, Williamson DA, Martin CK, et al. The CALERIE Study: design and methods of an innovative 25% caloric restriction intervention. Contemp Clin Trials. 2011;32:874–881. doi:10.1016/j.cct.2011.07.002 [DOI] [PMC free article] [PubMed] [Google Scholar]
- 12. Redman LM, Kraus WE, Bhapkar M, et al. ; CALERIE Study Group. Energy requirements in nonobese men and women: results from CALERIE. Am J Clin Nutr. 2014;99:71–78. doi:10.3945/ajcn.113.065631 [DOI] [PMC free article] [PubMed] [Google Scholar]
- 13. Racette SB, Das SK, Bhapkar M, et al. ; CALERIE Study Group. Approaches for quantifying energy intake and %calorie restriction during calorie restriction interventions in humans: the multicenter CALERIE study. Am J Physiol Endocrinol Metab. 2012;302:E441–E448. doi:10.1152/ajpendo.00290.2011 [DOI] [PMC free article] [PubMed] [Google Scholar]
- 14. Wong WW, Roberts SB, Racette SB, et al. The doubly labeled water method produces highly reproducible longitudinal results in nutrition studies. J Nutr. 2014;144(5):777–783. doi:10.3945/jn.113.187823 [DOI] [PMC free article] [PubMed] [Google Scholar]
- 15. Pieper C, Redman L, Racette S, et al. Development of adherence metrics for caloric restriction interventions. Clin Trials. 2011;8:155–164. doi:10.1152/ajpendo.00290.2011 [DOI] [PMC free article] [PubMed] [Google Scholar]
- 16. Conti B. Considerations on temperature, longevity and aging. Cell Mol Life Sci. 2008;65:1626–1630. doi:10.1007/s00018-008-7536-1 [DOI] [PMC free article] [PubMed] [Google Scholar]
- 17. Roth GS, Lane MA, Ingram DK, et al. Biomarkers of caloric restriction may predict longevity in humans. Science. 2002;297:811. [DOI] [PubMed] [Google Scholar]
- 18. Bowers J, Terrien J, Clerget-Froidevaux MS, et al. Thyroid hormone signaling and homeostasis during aging. Endocr Rev. 2013;34:556–589. doi:10.1210/er.2012-1056 [DOI] [PubMed] [Google Scholar]
- 19.Chung HY, Cesari M, Anton S, et al. Molecular inflammation: underpinnings of aging. Ageing Res Rev. 2009;8:18–30. doi:10.1016/j.arr.2008.07.002 [DOI] [PMC free article] [PubMed] [Google Scholar]
- 20. Jennrich RI, Schluchter MD. Unbalanced repeated-measures models with structured covariance matrices. Biometrics. 1986;42:805–820. [PubMed] [Google Scholar]
- 21. Diggle PJ, Heagerty PJ, Liang K-Y, Zeger SL. Analysis of Longitudinal Data. 2nd ed. Oxford; New York: Oxford University Press; 2002. [Google Scholar]
- 22. Huffman KM, Samsa GP, Slentz CA, et al. Response of high-sensitivity C-reactive protein to exercise training in an at-risk population. Am Heart J. 2006;152:793–800. [DOI] [PubMed] [Google Scholar]
- 23. Dmitrienko A, Millen BA, Brechenmacher T, Paux G. Development of gatekeeping strategies in confirmatory clinical trials. Biom J. 2011;53:875–893. doi:10.1002/bimj.201100036 [DOI] [PubMed] [Google Scholar]
- 24. Wright SP. Adjusted P-values for simultaneous inference. Biometrics. 1992;48:1005–1013. [Google Scholar]
- 25. Soare A, Cangemi R, Omodei D, Holloszy JO, Fontana L. Long-term calorie restriction, but not endurance exercise, lowers core body temperature in humans. Aging (Albany NY). 2011;3:374–379. [DOI] [PMC free article] [PubMed] [Google Scholar]
- 26. Rosenbaum M, Leibel RL. Adaptive thermogenesis in humans. Int J Obes (Lond). 2010;34(suppl 1):S47–S55. doi:10.1038/ijo.2010.184 [DOI] [PMC free article] [PubMed] [Google Scholar]
- 27. Yamada Y, Colman RJ, Kemnitz JW, et al. Long-term calorie restriction decreases metabolic cost of movement and prevents decrease of physical activity during aging in rhesus monkeys. Exp Gerontol. 2013;48:1226–1235. doi:10.1016/j.exger.2013.08.002 [DOI] [PMC free article] [PubMed] [Google Scholar]
- 28. Ruggiero C, Metter EJ, Melenovsky V, et al. High basal metabolic rate is a risk factor for mortality: the Baltimore Longitudinal Study of Aging. J Gerontol A Biol Sci Med Sci. 2008;63:698–706. [DOI] [PMC free article] [PubMed] [Google Scholar]
- 29. Jumpertz R, Hanson RL, Sievers ML, Bennett PH, Nelson RG, Krakoff J. Higher energy expenditure in humans predicts natural mortality. J Clin Endocrinol Metab. 2011;96:E972–E976. doi:10.1210/jc.2010-2944 [DOI] [PMC free article] [PubMed] [Google Scholar]
- 30. Meyer TE, Kovács SJ, Ehsani AA, Klein S, Holloszy JO, Fontana L. Long-term caloric restriction ameliorates the decline in diastolic function in humans. J Am Coll Cardiol. 2006;47(2):398–402. [DOI] [PubMed] [Google Scholar]
- 31. Rozing MP, Mooijaart SP, Beekman M, et al. C-reactive protein and glucose regulation in familial longevity. Age (Dordr). 2011;33:623–630. doi:10.1007/s11357-011-9206-8 [DOI] [PMC free article] [PubMed] [Google Scholar]
- 32. Jylhävä J, Hurme M. Gene variants as determinants of longevity: focus on the inflammatory factors. Pflugers Arch. 2010;459(2):239–246. doi:10.1007/s00424-009-0726-3 [DOI] [PubMed] [Google Scholar]
- 33. Krabbe KS, Pedersen M, Bruunsgaard H. Inflammatory mediators in the elderly. Exp Gerontol. 2004;39:687–699. [DOI] [PubMed] [Google Scholar]
- 34. Ridker PM. Inflammatory biomarkers and risks of myocardial infarction, stroke, diabetes, and total mortality: implications for longevity. Nutr Rev. 2007;65(12 Pt 2):S253–S259. [DOI] [PubMed] [Google Scholar]
- 35. Stamler J, Rose G, Stamler R, Elliott P, Dyer A, Marmot M. INTERSALT study findings. Public health and medical care implications. Hypertension. 1989;14:570–577. [DOI] [PubMed] [Google Scholar]
- 36. Holloszy JO, Smith EK, Vining M, Adams S. Effect of voluntary exercise on longevity of rats. J Appl Physiol (1985). 1985;59:826–831. [DOI] [PubMed] [Google Scholar]
- 37. Fontana L, Villareal DT, Weiss EP, et al. ; Washington University School of Medicine CALERIE Group. Calorie restriction or exercise: effects on coronary heart disease risk factors. A randomized, controlled trial. Am J Physiol Endocrinol Metab. 2007;293:E197–E202. [DOI] [PubMed] [Google Scholar]
Associated Data
This section collects any data citations, data availability statements, or supplementary materials included in this article.