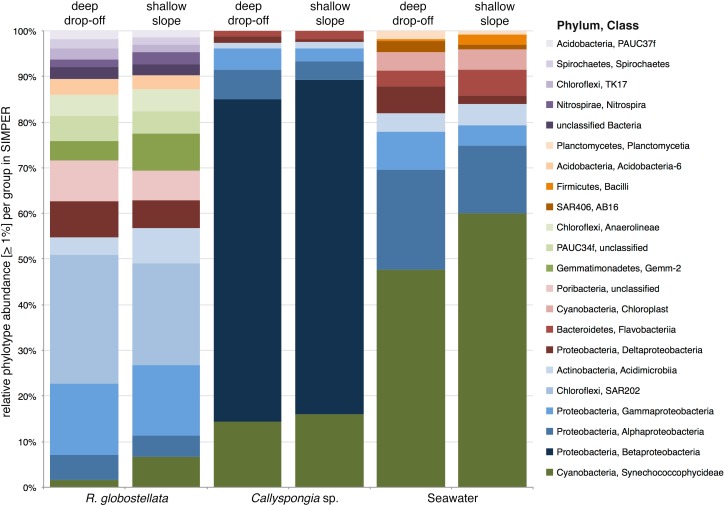
Figure 4. SIMPER contributions to Bray-Curtis dissimilarities between habitats.
Mean sequence abundances of the 97%-OTUs which contribute the most to overall Bray-Curtis dissimilarities, as calculated by SIMPER among open and deep R. globostellata, Callyspongia sp., and seawater samples. Individual 97%-OTUs were collapsed at class level and only considered with an overall abundance of >1%.

