

Abstract
Edema in the central nervous system can rapidly result in life-threatening complications. Vasogenic edema is clinically manageable, but there is no established medical treatment for cytotoxic edema, which affects astrocytes and is a primary trigger of acute post-traumatic neuronal death. To test the hypothesis that adrenergic receptor agonists, including the stress stimulus epinephrine protects neural parenchyma from damage, we characterized its effects on hypotonicity-induced cellular edema in cortical astrocytes by in vivo and in vitro imaging. After epinephrine administration, hypotonicity-induced swelling of astrocytes was markedly reduced and cytosolic 3′-5′-cyclic adenosine monophosphate (cAMP) was increased, as shown by a fluorescence resonance energy transfer nanosensor. Although, the kinetics of epinephrine-induced cAMP signaling was slowed in primary cortical astrocytes exposed to hypotonicity, the swelling reduction by epinephrine was associated with an attenuated hypotonicity-induced cytosolic Ca2+ excitability, which may be the key to prevent astrocyte swelling. Furthermore, in a rat model of spinal cord injury, epinephrine applied locally markedly reduced neural edema around the contusion epicenter. These findings reveal new targets for the treatment of cellular edema in the central nervous system.
Keywords: astrocytes, contusion trauma, cerebral cortex, spinal cord, cytotoxic edema, epinephrine
Introduction
Central nervous system (CNS) edema, characterized by an excess of fluid in the extracellular or intracellular space, is a major consequence of trauma and many pathologic conditions (Unterberg et al., 2004) and can be life-threatening. Cytotoxic edema, or cellular swelling, manifests minutes after acute injury in the CNS, predominantly caused by lack of energy substrate and failure of energy metabolism associated with shifts in ionic and water content between extracellular and intracellular spaces. This could lead to accumulation of fluid also in the extracellular space, even if the blood brain barrier (BBB) is intact (ionic edema). If increased extravasation of plasma proteins through the BBB occurs, this may then lead to vasogenic edema (Harukuni et al., 2002; Simard et al., 2007; Stokum et al., 2015). Although vasogenic edema is considered responsive to therapy, there is no established medical treatment for cellular edema (Kabadi and Faden, 2014; Khanna et al., 2014; Raslan and Bhardwaj, 2007; Simard et al., 2012; Unterberg et al., 2004), which affects astrocytes, an abundant non-neuronal cell type in the CNS (Azevedo et al., 2009; Herculano-Houzel and Lent, 2005).
Astrocytes are the only CNS cells that undergo rapid changes in volume (Pangrsic et al., 2006; Risher et al., 2009; Thrane et al., 2011) caused by ionic dysregulation (Seifert et al., 2006). As a result, Na+ accumulates within the cells, leading to uptake of water mediated by aquaporin water channels to maintain osmotic homeostasis (Papadopoulos and Verkman, 2013; Potokar et al., 2013). Of the many aquaporins in the CNS (Papadopoulos and Verkman, 2013), aquaporin 4 (AQP4) in astrocytes has been strongly implicated in the development of brain edema (Manley et al., 2000; Thrane et al., 2011).
Astrocyte swelling causes plasma membrane unfolding (Pangrsic et al., 2006) and release of neurotransmitters such as adenosine triphosphate (Darby et al., 2003; Thrane et al., 2011), glutamate, and aspartate (Kimelberg et al., 1990; Malarkey and Parpura, 2008). Swelling of highly branched astrocyte processes, the major diffusional barrier in the CNS, may decrease solute diffusion in the extracellular space (Syková and Nicholson, 2008), which may affect waste removal from extracellular space (Thrane et al., 2014) and signaling between neural cells (such as glia and neurons), leading to excitotoxicity and neurodegeneration. Therefore, it is clinically important to understand the intracellular signaling mechanisms that mediate rapid swelling or shrinking of astrocytes.
Astrocyte swelling may increase intracellular Ca2+ levels both in vitro (O’Connor and Kimelberg, 1993; Pangrsic et al., 2006) and in vivo. In vivo, AQP-induced astrocyte swelling is likely followed by release of adenosine triphosphate and activation of astrocytic P2 receptors (Thrane et al., 2011). Increases in water permeability through AQP4 water channels induced by high potassium levels and subsequent astrocyte swelling are likely mediated by phosphorylation of AQP4, which is dependent on cAMP (3′-5′-cyclic adenosine monophosphate) and protein kinase A (Song and Gunnarson, 2012). Increases in intracellular cAMP levels inhibit hypotonic swelling of retinal Müller cells (Wurm et al., 2010) and prevent excitotoxicity in oligodendroglia derived from glial precursors (Yoshioka et al., 1998). Clearly, glial swelling/shrinking involves Ca2+ and cAMP intracellular signaling pathways, but their interactions are not understood.
Tissue may be strongly protected from damage by stress stimuli, including epinephrine (EPI) and norepinephrine (Selye 1967), which increase cAMP levels, and also by other β-adrenergic receptor (β-AR) agonists, such as isoprenaline (ISO). Recently, we showed that stimulating the β-AR in astrocytes in vitro increases intracellular cAMP levels within 15 s and induces intense morphologic changes (astrocyte stellation) (Vardjan et al., 2014). To test the hypothesis that the β-AR agonists EPI and ISO can protect neural parenchyma from damage, we analyzed their effects on hypotonicity-induced cellular edema by in vivo and in vitro imaging of cortical astrocytes and in a rat model of spinal cord injury. Our findings revealed that adrenergic agonists robustly reduce cellular edema in brain and spinal cord cells, which represents potential new mechanisms for the treatment of cellular edema in the CNS.
Materials and Methods
All chemicals were from Sigma-Aldrich unless otherwise noted.
Cell Culture Experiments
Cell cultures and reagents
Astrocytes from the cerebral cortex of 2–3-day old rats were prepared and cultured as described (Pangrsic et al., 2006). Before the experiments, the cells were removed from the culture flasks with trypsin/EDTA and plated on 22-mm diameter glass cover slips coated with poly-L-lysine. Cells were maintained in high-glucose Dulbecco’s modified Eagle’s medium supplemented with 10% fetal bovine serum, 1 mM sodium pyruvate, 2 mM L-glutamine, and 25 μg/mL penicillin–streptomycin in an atmosphere of humidified air (95%) and CO2 (5%). The experimental animals were cared for in accordance with the International Guiding Principles for Biomedical Research Involving Animals developed by the Council for International Organizations of Medical Sciences and Animal Protection Act (Official Gazette of the RS, No. 38/13).
Cell morphology and cell volume measurements
In the first set of experiments (cross-section area measurements), astrocytes were loaded with 200 nM calcein AM (Molecular Probes, Invitrogen, Eugene, OR, USA) according to the manufacturer’s instructions and examined with a Plan NeoFluoar 40×/1.3 Oil DIC immersion objective (Carl Zeiss, Jena, Germany) on an Zeiss LSM 510 META confocal microscope (Carl Zeiss) at room temperature. Cells were excited at 488 nm and images (512 × 512 pixels) were acquired every 7 s. Initially, astrocytes were kept in standard extracellular solution (10 mM Hepes/NaOH, pH 7.2, 10 mM D-glucose, 131.8 mM NaCl, 1.8 mM CaCl2, 2 mM MgCl2, and 5 mM KCl) and treated with distilled water to achieve ~60% of the osmolarity of control standard extracellular solution after a 100-s baseline. In some experiments, the cells were first treated with cAMP-increasing reagents, either 1 μM EPI (α- and β-AR agonist) or 10 μM ISO (a β-AR agonist), for ~5 min and then with distilled water in the presence of those reagents. Osmolality was measured with a freezing-point osmometer (Osmomat 030, Gonotech, Germany). Cellular cross-sectional area before and after treatments was measured with LSM 510 META software. Briefly, the cell image was outlined by the cursor before and after the treatment. For this the transmitted light images were used, as the contrast permitted accurate delineation of the cell border. To verify accurate positioning of the cursor, intensity profiles of cell edges in transmitted light images were monitored (see intensity profiles below panels A and B, Fig. 2).
In the second set of experiments (cell volume measurements), astrocytes were loaded with 2 μM calcein AM. Images were acquired every 3.5 s. Astrocytes either in standard saline solution or pretreated with EPI were stimulated with distilled water as described above. In control experiments astrocytes were stimulated with extracellular (isotonic) solution. Changes in calcein fluorescence intensity were analyzed with LSM 510 META software and normalized towards baseline and average control (isotonic) signal. A decrease in calcein fluorescence reflects an increase in cell volume (i.e., swelling; Krämer-Guth et al., 1997; Tauc et al., 1990).
To further independently determine volume changes of astrocytes, we used the Coulter principle where particles pulled through an orifice, concurrent with an electric current, produce a change in impedance that is proportional to the volume of the particle (Green and Wachsmann-Hogiu, 2015). Before the experiments, astrocytes growing in culture flasks were trypsinized and put in centrifuge tubes containing standard extracellular solution. The suspension of astrocytes was then aliquoted into 2 mL centrifuge tubes and treated with distilled water to achieve ~60% of the osmolarity of control standard extracellular solution (Hypo) or simultaneously with ISO (10 μM; ISO+Hypo (simult.)) for 10 min. In other experiments, the cells were first treated with different concentrations of EPI (0.01, 0.1, 1, and 100 μM) for 10 min and then with distilled water in the presence of EPI (EPI+Hypo) for another 10 min. In controls astrocytes were stimulated with extracellular (isotonic) solution for 10 min. Cell volume was measured with a Scepter™ cell counter using a Scepter™ sensor with a measurement range of a cell diameter of up to 60 μm. The results were exported (Scepter™ Software Pro 2.1, Merck Millipore, Darmstadt, Germany) and analyzed for cell diameters ranging between 8.03 μm (low marker) to 28.05 μm (high marker). The obtained values were then normalized to the controls (isotonic stimulation) using Excel (Microsoft, Seattle, WA, USA). Experiments were performed within 1 h after trypsinization. Values are given as means±SEM. Statistical significance was tested by ANOVA (Holm–Sidak method) vs. Hypo.
Fluorescence resonance energy transfer measurement of cAMP
Astrocytes expressing Epac1-camps (Nikolaev et al., 2004), a fluorescence resonance energy transfer (FRET) nanosensor, that was transfected into astrocytes using FuGENE® 6 Transfection Reagent (Promega Corporation, Madison, WI, USA), were examined as described above. Lipofection medium contained no serum or antibiotics. In individual cells expressing Epac1-camps, the fluorescence intensities of yellow (YFP) and cyan (CFP) fluorescence proteins were quantified within a region of interest with Zeiss LSM 510 META software. The FRET signal is reported as the ratio of the YFP to CFP fluorescence signal after subtraction of background fluorescence (SigmaPlot, SyStat, San Jose, CA, USA). FRET values were normalized (set to 1.0) at the onset of the experiments. A decrease in FRET indicates an increase in [cAMP]i.
Basal intracellular cAMP concentration ([cAMP]i) in astrocytes was determined as reported (Börner et al., 2011), by initially keeping cells in the standard extracellular solution for 100 s, then the cells were treated with 100 μM 2′,5′-dideoxyadenosine (DDA; an inhibitor of adenylyl cyclase) for ~500 s to decrease the cAMP levels below the sensitivity range of Epac1-camps and finally with 20 μM 8-Br-2′-O-Me-cAMP-AM (a cell-permeable cAMP analog; BioLog Life Science Institute, Bremen, Germany) in the presence of DDA for another 300 s to fully stimulate the Epac1-camps nanosensor. Basal [cAMP]i was calculated for individual recordings using the equation: [cAMP]i=EC50 × ((R − Rmin)/(Rmax − R))1/n, where R is the FRET ratio value at basal state, and Rmin and Rmax are FRET ratio values after the adenylyl cyclase inhibition and the 8-Br-2′-O-Me-cAMP-AM treatment, respectively. EC50 is the cAMP concentration at which a half-maximal FRET response is observed and n is a Hill coefficient of the concentration-response dependency (Börner et al., 2011).
Cells expressing Epac1-camps were excited at 458 nm, and images (512 × 512 pixels) were obtained every 3.5 or 7 s in Lambda Stack Acquisition mode at room temperature. Astrocytes were initially kept for 5 min in either isotonic standard extracellular solution or hypotonic solution created as described above. The cells were then treated with 1 μM EPI. Emission spectra were collected from the META detector in eight channels (lambda stack) ranging from 470 to 545 nm, each 10.7 nm wide. Two-channel (CFP and YFP) images were generated from lambda stacks with analytical software (Extract Channels). Channels with emission spectra at 470 and 481 nm were extracted to the CFP channel; channels with emission spectra at 513, 524, and 534 nm were extracted to the YFP channel.
FRET analysis
Single-exponential (F=F0+c × exp(−t/τ)) or double-exponential functions (F=F0+c1 × exp(−t/τ1)+c2 × exp(−t/τ2)) were fitted to the decay in YFP/CFP fluorescence emission ratios (SigmaPlot). F is the YFP/CFP emission ratio at time t, F0 is the baseline YFP/CFP emission ratio, c is the YFP/CFP emission ratio amplitude, c1 and c2 are the YFP/CFP ratio amplitudes of the individual exponential components of a double-exponential function, and τ is the time constant. The changes in the YFP/CFP fluorescence emission ratio were normalized to baseline values. The goodness of the exponential fits was judged from the calculated coefficient of determination, R2 (SigmaPlot).
Fluo-4 AM measurements of cytosolic Ca2+
Astrocytes were incubated for 30 min at room temperature in medium containing 2 μM Fluo-4 AM dye (Molecular Probes, Invitrogen) and transferred to dye-free medium for at least 30 min before the experiments to allow for cleavage of the AM ester group. The cells were excited with an Argon-ion laser at 488 nm, and time-lapse images were obtained every 3.5 s for up to 20 min with an inverted Zeiss LSM780 confocal microscope and an oil-immersion plan apochromatic objective (40×, 1.4 NA). Emission light was acquired with a 505–530-nm band-pass emission filter. Fluo-4 AM–labeled astrocytes were treated for ~100 s (30 frames) with distilled water for hypotonic stimulation (to ~60% of control osmolarity) and then for ~630 s (180 frames) with 1 μM EPI or 10 μM ISO in the presence of hypotonic medium. In other experiments, cells were first stimulated with 1 μM EPI or 10 μM ISO and then with distilled water in the presence of EPI or ISO. Total recording time was ~1050 s (300 frames). In individual cells, Fluo-4 AM intensity was quantified within a region of interest.
Fluo4-AM signal analysis
The intensity of Fluo-4 AM signal was quantified within a region of interest in individual cells as the relative change in fluorescence: ΔF/F0=(F−F0)/F0, where F0 denotes the prestimulus fluorescence level after subtraction of background fluorescence. The cumulative increase in Fluo-4 ΔF/F0 over a 100-s interval was determined for different types of stimulations, and single-exponential functions (F=F0+c × exp(−t × k)) were fitted (SigmaPlot). F is the cumulative ΔF/F0 at time t, F0 is the baseline cumulative ΔF/F0, c is the amplitude of the cumulative ΔF/F0, and k is the rate constant. The half times of the exponential decay were determined as t1/2=ln2 × τ, where τ equals 1/k.
In Vivo Imaging Experiments
Transgenic mice
All animal procedures followed the National Institutes of Health guidelines and were reviewed annually by the Animal Care and Use Committee at Medical College of Georgia. In total, 12 male and female transgenic mice [Tg(GFAP-EGFP)GFECFKi line maintained in the C57BL6/J background] were studied at an average age of ~3.5 months. In these mice, astrocytes from multiple areas of the CNS express EGFP under the control of the human glial fibrillary acidic protein (GFAP) promoter (Nolte et al., 2001).
Preparation of mice for in vivo imaging
Mice were anesthetized with urethane (1.5 mg/g i.p.). Heart rate (450–650 beats/min) and blood oxygen saturation were monitored with a pulse oximeter (MouseOx, Star Life Sciences, PA, USA). Anesthesia was monitored by heart rate and lack of toe pinch reflex and maintained with 10% of the initial urethane dose if needed. Body temperature was maintained at 37°C with a heating pad (Sunbeam, Boca Raton, FL, USA). To facilitate breathing during anesthesia, an L-shaped glass capillary tube ~1 cm long and 1.2 mm in diameter was inserted into the trachea and secured with sutures. Oxygen saturation was maintained at >90%. For hydration, 100 μL of 0.9% NaCl with 20 mM D-glucose was given hourly by i.p. injection. For visualization of blood flow, Texas Red dextran in 0.9% NaCl (70 kDa) (Invitrogen) was injected as a 0.1-mL bolus (5% w/v) into the tail vein.
An optical window was created with a standard craniotomy procedure (Risher et al., 2010). A dental drill (Midwest Stylus Mini 540S, Dentsply International, Des Plaines, IL, USA) with a one-quarter round bit was used to thin the circumference of a 2–4-mm diameter circular region of skull over the somatosensory cortex centered at stereotaxic coordinates −1.8 mm from the bregma and 2.8 mm lateral. The thinned bone was lifted with fine forceps, and the intact dura was covered with a thin layer of 1.5% agarose in cortex buffer containing (in mM) 135 NaCl, 5.4 KCl, 1 MgCl2, 1.8 CaCl2, and 5 HEPES, pH 7.3. In a subset of experiments, 25 μM EPI in cortex buffer was added directly to the exposed brain tissue. After 30 min, the EPI was removed and replaced with 1.5% agarose containing 25 μM EPI for sustained application. A cover glass (no. 1; Bellco Glass, Vineland, NJ, USA) was placed over the window and sealed with dental cement.
The mice were then placed in a custom-made head holder and mounted on a Luigs and Neumann (Ratingen, Germany) microscope stage for imaging. Overhydration was achieved by i.p. injection of distilled water (150 mL/kg) (Nagelhus et al., 1993; Risher et al., 2009). This treatment likely produced hypotonicity in the brain, since it was shown previously to result in 15–20% reduction in plasma osmolality in rats (Nagelhus et al., 1993). Moreover, even a 20 mL/kg water i.p. (into rats) resulted in a 11–15 mOsm/kg reduction in hypotonicity accompanied with an osmoreceptor response in neurons (Wang et al., 2013), reporting a tonicity change of the cerebrospinal fluid. Thus, a 7.5-fold larger volume of water i.p. injection (150 mL/kg), as used in our study, corresponding to about 15% of body weight, very likely ended in a larger tonicity change. In agreement with this an injection of 20% of body weight water resulted in an increased water content in the brain (Kozler et al., 2013). Water intoxication (hyperhydration) is considered a standard mode to induce cellular edema of the brain as studied by many methods (Yamaguchi et al., 1997; Manley et al., 2000; Vajda et al., 2002).
Global ischemia was induced by cardiac arrest achieved by injecting 1 mL of air into the tail vein [Fig. 1(A)].
Two-photon laser scanning microscopy
Images were collected with an IR-optimized 40×/0.8 NA water-immersion objective (Carl Zeiss) and a Zeiss LSM 510 NLO META multiphoton system mounted on a motorized upright Axioscope 2 FS microscope (Carl Zeiss). The scan module was directly coupled to a Ti:sapphire broadband mode-locked laser (Mai-Tai, Spectra-Physics, Santa Clara, CA, USA) tuned to 910 nm for two-photon excitation. For monitoring of structural changes, three-dimensional time-lapse images at 1-μm steps (~20 sections per z-stack) were obtained with a 3× optical zoom, yielding a nominal spatial resolution of 6.86 pixels/μm (12 bits/pixel, 0.91 μs pixel time) across an imaging field of 75 × 75 μm. Emitted light was detected by internal photomultiplier tubes of the scan module with the pinhole entirely open.
Image analysis
Image Examiner software (Carl Zeiss) and NIH ImageJ (National Institutes of Heath, Bethesda, MD, USA) were used for image analysis and processing. Huygens Professional image deconvolution software (Scientific Volume Imaging Hilversum, Netherlands) was used to process images. Because the axial resolution of two-photon laser scanning microscopy is relatively poor (~2 μm), small astroglial processes were not measurable and therefore volume changes of fine astroglial processes were not quantified. To simplify interpretation of the morphometric data imposed by the lower axial than lateral (~0.4 μm) resolution of the two-photon laser scanning microscopy, we used two-dimensional maximum intensity projections (MIPs) of image stacks (~20 μm thick) to assess the relative changes in the areas of individual astroglial somata, as described (Andrew et al., 2007; Risher et al., 2009; Risher et al., 2012; Sword et al., 2013). We assumed that astroglial soma volume changes uniformly in all directions, based on viewing astrocytes along the z-axis in the control and at each experimental time point. Measurements of changes in the lateral dimensions were adequate to determine the relative volume changes, which underestimated actual volume changes assuming they are approximately isotropic. Hence, as in our previous studies, three techniques were used to analyze astrocytes: (1) MIP images were digitally traced by hand to measure the area of each astroglial soma in the control and at each time point. Alternatively, the MIP images were filtered with a median filter (radius=1), and the background was then subtracted and thresholded with ImageJ. The astroglial soma on the threshold image was outlined and then measured automatically with the “analyze particles” function of ImageJ. Similar results were obtained from both methods and all analyses were done blind with regard to the experimental conditions. (2) Control and experimental MIP images were pseudocolored green and red, aligned, and overlaid. Overlapping areas are projected as yellow, whereas nonoverlapping areas remain green or red. (3) Control profiles were traced and filled to create a mask, revealing peripheral areas of swelling when overlaid on the experimental images.
Statistics
SigmaStat (SyStat) and Statistica (StatSoft) were used for statistical analyses. Median values over different time points were compared with repeated-measures analysis of variance on ranks followed by the Tukey’s post hoc test. The strength of the relationship between astrocytes cross-section soma area and time after i.p. water injection was determined by linear regression analysis. The slopes of the regression lines were compared by one-way analysis of covariance (ANCOVA) for two independent samples. Differences were considered significant at P<0.05. Values are given as means±SEM.
Spinal Cord Injury Experiments
Animals and contusion spinal cord injury (SCI)
Adult female Sprague-Dawley rats (240–260 g, n=6; Taconic, Germantown, NY, USA) were anesthetized with a mixture of ketamine (60–75 mg/kg) and xylazine (10 mg/kg mix) and T9-10 mild contusion was performed after a standard preoperative preparation (10 g × 12.5 mm, New York University (NYU) device; Teng et al., 2004). All surgical and postcare procedures were performed according to a protocol approved by the VABHS Institutional Animal Care and Use Committee.
Dye injection
The right carotid artery was exposed through a skin incision along the ventral midline of the neck, clipped, and partially blocked at the proximal end to reduce blood flow. A 27 Gauge needle was inserted distally into the artery; sulforhodamine 101 (SR101) in sterile phosphate-buffered saline (5 mg/kg, 10 mg/mL; Invitrogen) was injected, followed by removal of the angioclip and hemostasis of the injection site with a cotton tip. The wound was closed with sutures and stainless steel wound clips (Nimmerjahn et al., 2004; Appaix et al., 2012).
Local administration of EPI
Five minutes after SCI, a stereotaxic frame and microinjection manipulator (Stoelting, Wood Dale, IL, USA) were used to insert the tip of a 30 Gauge needle 1.2 mm below the dorsal dura at T9–10 (the injury epicenter) as described (Teng and Wrathall, 1997). In treated rats (n=3), 20 μL of EPI was applied over the epicenter area, and 4 μL of EPI (1 mM) was injected into the cord tissue over 8 min; control rats (n=3) were injected with an equal volume of sterile saline; we found that EPI administration did not reduce the size of astrocytes in the intact spinal cord. To prevent backflow of drug, the needle was left in place for 2 min and then slowly withdrawn. The wound was sutured, and the skin was closed with stainless steel wound clips. After 1.5 h of recovery, the rats were euthanized by intracardiac perfusion of 0.1M phosphate buffer (20 mL) and 4% paraformaldehyde (70 mL). Spinal cord tissue (length 15 mm) at the epicenter of SCI was quickly dissected, briefly rinsed in phosphate buffer, and soaked in 1 mL of 400 μM Texas Red hydrazide (TRH, a fixable analog of SR101; Invitrogen) for 1.5 h. The tissue was then postfixed in 4% paraformaldehyde at 4°C overnight.
Tissue processing and sampling
Postfixed spinal tissue was cryoprotected in 30% sucrose overnight, embedded in optimal cutting temperature compound (Tissue-Tek, Sakura Finetek USA, Torrance, CA, USA), and cryosectioned into sequential 50-μm coronal sections. The sections were mounted on Superfrost Plus microscope slides (Thermo Fisher Scientific, Waltham, MA, USA) for staining and microscopic analyses.
Immunocytochemistry and microscopy
The slide-mounted tissue sections were incubated with antibodies against neuronal nuclear antigen (NeuN) (Alexa488-conjugated mouse antibody, Millipore, Billerica, MA, USA; 1:200), neurofilament M (rabbit primary antibody, Millipore; 1:200), or glial fibrillary acidic protein (GFAP; rabbit primary antibody, Dako, Carpinteria, CA, USA; 1:1000) and reacted with DyLITE488-conjugated donkey anti-rabbit secondary antibody (Jackson ImmunoResearch, West Grove, PA, USA; 1:200) to further confirm the phenotypes of SR101- and TRH-positive cells. For quantitative analysis of astrocyte size, confocal microscopic (Zeiss LSM, 501; Carl Zeiss Microimaging) z-stack images were collected in 1-μm steps in each millimeter of tissue samples around the lesion epicenter.
Analysis of glial cell morphology
The morphology of SR101- and TRH-stained astroglial cells in the injured spinal cord tissue was assessed with ImageJ and Photoshop CS (Adobe, Mountain View, CA, USA) in an unbiased manner by two researchers blinded to the treatments and sampling. The size of astroglial cell bodies in the injury epicenter was determined with three complementary methods. First, using the pixel numbers of positively labeled cell bodies derived from images with identical resolution and magnification, we measured the widest area of the serial cross-sections of the cells to evaluate how puffy the cells became after SCI. Second, we examined gray matter regions of the spinal cord sections for positively labeled cells in images of exactly the same field size and magnification. Third, from 1-μm step z-stacks, we added up the volumes of each 1-μm optical section of representative, randomly selected astroglial cell bodies. The dye signal level was qualitatively indistinguishable at levels “discernibly above the cell body” due to the massive and complex acute pathological events taking place in the freshly injured spinal cord. The acute injury is known for the accumulation of an autofluorescent pigment called lipofuscin in neurons and other types of cells, which is further augmented by acute cell and axon membrane disruption, cellular necrosis and apoptosis, and inflammatory processes including large scale invasion of blood-borne cells. Therefore, we set up a consistent “inclusion standard” that consisted of starting measuring at the first level of definitive dye signal and ended on the largest cross-section of each cell evaluated in strictly compatible ranges (see Fig. 5). Since cells generally had a symmetric cell body distribution in the spinal cord, the regimen allowed us to present unbiased statistical outcome in a succinct manner.
Dye specificity analysis
In the SCI experiments, we first analyzed the labeling efficiency of the glia-specific dyes SR101 and TRH. The percentage of cells in which SR101 and TRH signals colocalized with the GFAP signal was determined in brain and spinal cord. We also determined the percentages of cells in SR101/TRH and GFAP signals colocalized in different tissue segments and with dye-loading schemes. In representative GFAP-positive astroglial cells, we determined percentage of cell bodies in which the GFAP and SR101/TRH signals colocalized.
Compartmental analysis of glial cell morphology
Representative glial cell images (n=2 per spinal cord; 6 per group) were divided into cell body and cell processes, and positive signals in each compartment were counted. For measuring the size of astrocytes in situ in postfixation spinal cord sections, we designed a comprehensive formula that assessed three interlocked parameters. Specifically, (1) percentage of positive signal in gray matter image field measured the overall distribution of the dye signal in the cross/coronal areas imaged. The outcome verified whether there was a consistent difference in group average dye levels relative to the group means measured from selected representative cells; (2) as a more specific parameter, the group average two-dimensional measurement was used to obtain the cross area profile of injured astrocytes after different treatments. The outcome is important for estimating the overall size of the cells; and (3) lastly, the average volume of 15 representative astrocytes was measured per group to confirm whether there were discernible cell volume changes in the astrocytes.
Analysis of neuronal morphology
The morphology of spinal cord neurons near the SCI epicenter was analyzed by using immunoreactivities of NeuN and neurofilament intermediate filament protein M (NFM) to identify the cell bodies and axon hillock. NeuN is widely used to identify the nuclei of mature neurons; however, anti-NeuN antibody also recognizes cytoplasmic, alternatively spliced forms of Fox3 gene products (Dredge and Jensen, 2011), typically shown as a faintly stained uniform cell body outline, in addition to intense nuclear staining. NFM is a conventional cytoplasmic marker that is particularly valuable for identifying axons. In NFM-stained neurons, the thickness of the axonal hillock can be measured on the basis of the morphology of axons emerging from the cell bodies.
Statistical Analysis
Unless stated otherwise, statistical significance was determined by t test. P<0.05 was considered significant. Data are presented as means±SEM. For the well-established SCI model we used for the present study a group end number of 6, which was deemed to carry sufficient statistical power for the targeted cellular outcome measures. Our previous work showed that a group size of 4 was statistically adequate for intergroup comparison regarding neuronal death, inflammatory marker expression, and sensorimotor functional deficits (Yu et al., 2013).
Results
EPI Attenuates Swelling of Cortical Astrocyte In Vivo
Tissue injury may be strongly protected by stress stimuli, including EPI and norepinephrine (Selye, 1967), and brain tissue damage is associated with astrocyte swelling (Risher et al., 2009). To monitor the protective role of EPI in cellular edema in vivo, we used two-photon laser-scanning microscopy to examine, in real time in living mice, fluorescently labeled astrocytes in layer I/II of the somatosensory cortex at a depth of about 100 μm [Fig. 1(A)].
FIGURE 1.

EPI treatment attenuates swelling of cortical astrocytes in vivo after intraperitoneal injection of water. (A) General experimental schematics and time line. CCD camera image reveals cortical vasculature directly below craniotomy over mouse somatosensory cortex where 2PLSM imaging of astrocytes was performed according to the experimental time line. In mice untreated with EPI (left time line) 2PLSM images were acquired before and during 1 h after i.p. distilled water injection (150mL/kg) and then during cardiac arrest (CA). EPI (25 μM) was directly applied for 30 min to the open craniotomy and then replaced with agarose containing EPI for the duration of the experiment (right time line). 2PLSM imaging was performed before, during i.p. water injection, and after CA. (B) Paired maximal intensity projection two-photon laser scanning microscopy images showing an astrocyte (green) with the soma in contact with a blood vessel (red) before (left) and 35 min after (center) injection of water. (right) Merged images; arrows point to green areas illustrating swelling. (C) An astrocyte whose soma is not directly in contact with a blood vessel is swollen 41 min after i.p. injection of water, as revealed by the overlay image. (D,E) Similar images of astrocytes after local application of EPI to the open craniotomy (25 μM preincubation for 30 min and then 25 μM in agarose). A perivascular astrocyte with soma surrounding a blood vessel (D) and an astrocyte whose soma is distant from the blood vessel (E) do not appear swollen at 38 min and 31 min after i.p. injection of water, respectively. (F) Data from 15 astrocytes from 6 control mice (blue dots) showing continuous increase in soma size after i.p. injection of water. Values are percentages of cross-sectional soma area of each astrocyte before the injection. Regression line of the control data is in the form: y [%]=(106.53±2.46)+(0.693±0.101) × x [min] (n=144; r=0.5, P < 0.001). Data from 20 astrocytes from 6 EPI-treated mice (red dots) showing no significant relationship (r=0.0015, P=0.98) between soma size and time after i.p. injection of water. Regression line is in the form: y [%]=(100.23±1.10) − (0.001±0.042) × x [min] (n=162). The slopes of the regression lines differ significantly (P< 0.001, one-way analysis of covariance for two independent samples). (G) Same data as in (F) presented as a bar graph showing a long-lasting swelling of astrocytes in control mice after injection of water (*P< 0.5 vs. before injection of water) and a lack of astroglial swelling in the EPI-treated mice. All astrocytes in the EPI-treated mice swelled after global ischemia induced by cardiac arrest (*P < 0.002 relative to 30–60 min).
In untreated mice, astrocytes swelled after hypo-osmotic stress induced by water injection, indicating cellular edema [Fig. 1(B,C)], as reported (Risher et al., 2009). The cross-sectional soma area significantly increased in a time-dependent fashion after water injection relative to control [Fig. 1(G)]. Furthermore, astrocytes markedly swelled after cardiac arrest [Fig. 1(G)]. In contrast, in neocortex pretreated with EPI, both perivascular and parenchymal astrocytes did not swell after i.p. water injection [Fig. 1(D,E)]. However, after cardiac arrest EPI pretreatment was unable to inhibit cell swelling [Fig. 1(G)]. These results validate that under in vivo settings EPI pretreatment strongly inhibits astroglial swelling in the brain induced by i.p. water injection.
AR Activation Reduces Swelling of Cortical Astrocytes In Vitro
To avoid the vasomodulatory effect of EPI in vivo, we measured the cross-sectional area of single primary cortical astrocytes after hypotonic stimulation in untreated control cells [Fig. 2(A,C)] and in cells pretreated with the nonselective AR agonist EPI [1 μM; Fig. 2(B,C)] and the specific β-AR agonist ISO [10 μM; n=5; Fig. 2(C)]. In astrocytes pretreated with EPI or ISO for 5 min, the cross-sectional area was decreased (data not shown), consistent with β-AR-induced shrinkage of astrocytes (Shain et al., 1987; Vardjan et al., 2014).
FIGURE 2.

AR activation reduces hypotonicity-induced swelling of cultured cortical astrocytes. (A, B) Representative transmitted light images of control (A; Hypo) and EPI-pretreated astrocytes (B; EPI+Hypo) after addition of hypo-osmotic medium 350 s after hypotonic stimulation. Black boxes (left) denote the positions of the enlarged images (right). White lines outline the cell perimeter before stimulation (−50 s). Red (Hypo) and black (EPI+hypo) lines outline the cell perimeter after hypotonic stimulation (350 s). Intensity profiles of transmitted light images (yellow lines) for nontreated (CTRL) and EPI-pretreated cells before and after hypotonic stimulation are shown below the images. a.u., arbitrary units. Vertical dotted lines (a) show a shift in intensity profile lines induced by hypotonic stimulation (black arrows), indicating swelling. Scale bars: 20 μm, 2 μm (enlarged images). (C) (left) Time course of changes in cell cross-sectional area induced by hypotonic medium in control cells (Hypo, n = 13 from six experimental replicates) and cells pretreated with EPI (EPI− + Hypo; n = 8 from four experimental replicates) and ISO (ISO+Hypo; n = 5 from three experimental replicates). n, total number of independent experiments. (right) Bar chart shows average hypotonicity-induced changes in cell cross-sectional area 350 s after stimulation in control cells and pretreated cells. Hypotonic stimulation increased cell cross-sectional area, suggesting cell swelling, which was reduced in EPI- and ISO-pretreated cells. (D) (left) Time course of calcein fluorescence intensity changes (normalized to controls), reporting changes in cell volume, upon hypotonic medium stimulation in controls (Hypo, n = 15 from three experimental replicates) and in cells pretreated with EPI (EPI+Hypo; n = 11 from two experimental replicates). Arrowhead indicates stimulus onset. (right) Bar chart shows the percentage of cell volume change, expressed as the average hypotonicity-induced changes in calcein fluorescence intensity within the first 10 s after stimulation in control cells and EPI-pretreated cells. Hypotonic stimulation decreased the calcein fluorescence intensity, suggesting cell swelling, which was reduced in EPI-pretreated cells. Values in bar charts are mean±SEM (***P < 0.001, **P < 0.01; ###P < 0.001, #P < 0.05; paired t test). (E) EPI- and ISO-mediated attenuation of hypotonicity-induced astrocyte swelling at different doses, determined by the Coulter principle (Scepter™ cell counter). Bar chart shows average changes in cell volume (Rel. Volume change) normalized to the controls (isotonic stimulation, CTRL). Average control cell volume was 1.75±0.04 pL (n=19 runs; a run represents a cell suspension (50 μL) used in the measurements, containing 80,000 to 150,000 cells/mL). Bar chart colours indicate the same stimuli as in (C). We used six different cell preparations from three different animals. Hypo (n=14; red bar), cells pretreated with different concentrations of EPI [black bars; EPI (0.01 μM)+Hypo, n=6; EPI (0.1 μM)+Hypo, n=8; EPI (1 μM)+Hypo, n=13; EPI (100 μM)+Hypo, n=10] and simultaneous stimulation with ISO [gray bar; ISO (10 μM)+Hypo (simult.), n=6]. n, total number of independent experiments—runs. Values in bar chart are means±SEM. *P ≤ 0.05, **P ≤ 0.001 one-way ANOVA (Holm–Sidak method) vs. Hypo.
Six minutes after hypotonic stimulation, the cross-sectional area increased by ~2% in untreated astrocytes [n=13, P<0.001; Fig. 2(A,C)], indicating swelling (Pangrsic et al., 2006), but increased by only ~0.6% in EPI-pretreated astrocytes (n=8, P=0.095) and decreased by~−2% in ISO-pretreated astrocytes (n=5, P<0.05), indicating cell shrinkage. Hypotonicity-induced increase in cross-sectional area was reduced by 60% in EPI-pretreated cells (P<0.008) and by ~200% in ISO-pretreated cells (P<0.001) [Fig. 2(C)]. These results indicate that the reduction of hypotonicity-induced cell swelling in EPI- and ISO-pretreated cortical astrocytes involves the β-AR/cAMP signaling pathway.
To monitor astrocyte volume changes more directly, we loaded astrocytes with a volume indicator calcein (2 μM; Tauc et al., 1990; Krämer-Guth et al., 1997) and exposed the cells, untreated and EPI-pretreated, to hypotonic medium [Fig. 2(D)]. Hypotonicity induced decrease in calcein fluorescence intensity, reflecting cell swelling (n=15), was observed, consistent with previous report (Song and Gunnarson, 2012). The reduction in calcein fluorescence intensity was however not observed in EPI-pretreated cells (n=11). Thus, EPI application inhibited hypotonicity induced astrocyte swelling (P<0.001). This is in accordance with the results of cell-cross section area measurements [Fig. 2(A–C)].
We further independently validated volume changes measured in astrocytes by a cell counter-based method. The results revealed that hypotonicity-induced volume increase by about 35%, relative to the resting value of 1.75±0.04 pL in control cells [CTRL, Fig. 2(E)], was significantly inhibited by a range of EPI concentrations (0.1–100 μM), as well as by ISO (10 μM), indicating a role of β-AR/cAMP signaling in these responses.
Hypotonicity Slows cAMP Signaling in Cortical Astrocytes
Stimulation of the β-AR/cAMP pathway induces stellation and shrinkage of cortical astrocytes (Vardjan et al., 2014). Under hypotonic conditions, this pathway may be potentiated and may prevent swelling [Fig. 2(C)]. To test this possibility, we measured [cAMP]i by transfecting cortical astrocytes with Epac1-camps, a FRET-based cAMP nanosensor (Nikolaev et al., 2004). The average basal [cAMP]i in cultured astrocytes was measured to be 3.91±1.75 μM (n=9; median 1.20 μM), ranging from slightly below 1 to certain units above 10 μM. This heterogeneity in resting levels in [cAMP]i is consistent with previous measurements of cAMP in astrocytes (Vardjan et al., 2014) and in other cell types (Börner et al., 2011).
Cells pretreated with isotonic or hypotonic medium for 5 min were challenged with 1 μM EPI. The EPI-induced increases in [cAMP]i were similar under isotonic and hypotonic conditions; under hypotonic conditions, however, the rate of increase was significantly slower (Fig. 3), and the time-dependent increase in [cAMP]i was best fitted with a double-exponential function, with time constants of 13 s (similar to that of 15 s in controls) and 226 s. In astrocytes in vitro and in vivo, hypotonicity increases [Ca2+]i (Reetz et al., 1997; Pangrsic et al., 2006; Thrane et al., 2011), a hallmark of cytoplasmic excitability of astrocytes (Zorec et al., 2012), which may interact with cAMP signaling, since both second messenger systems interact in astrocytes (Horvat et al., 2016).
FIGURE 3.
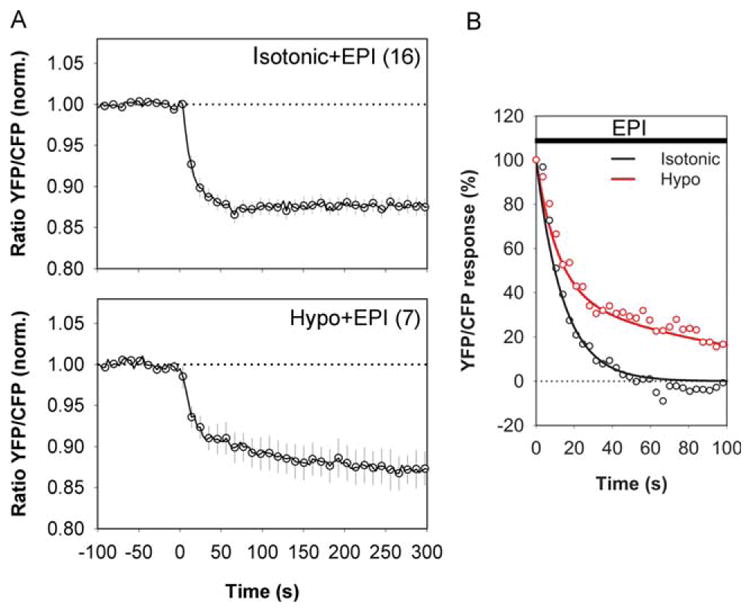
Hypotonic medium slows the EPI-induced increase in [cAMP]i in cortical astrocytes. (A) Time course of changes in Epac1-camps emission ratio after addition of 1 μM EPI in isotonic medium (top; Isotonic+EPI) and hypotonic medium (bottom; Hypo+EPI). The medium osmolality was reduced by adding distilled water to the bathing chamber. Values are mean±SEM. Numbers in parentheses are numbers of cells analyzed. EPI increased the FRET signal to the same extent (P > 0.995) under hypotonic conditions (14.99±2.39%; P < 0.05 vs. time 0, n=7 from four experimental replicates) and isotonic conditions (14.23±1.17%, P < 0.05 vs. time 0, n=16 from four experimental replicates). n, total number of independent experiments. (B) FRET response induced by EPI had slower decay kinetics in cells in hypotonic medium. EPI in isotonic medium triggered a single-exponential decay in FRET response with τ of 15.2±2.4 s. EPI in hypotonic medium triggered a double-exponential decay in FRET response with a fast component (τ1) of 12.8±2.2 s and a slow component (τ2) of 226.2±56.8 s.
AR Activation Modulates Hypotonicity-Induced Ca2+ Excitability
The activation of ARs also increases [Ca2+]i (Salm and McCarthy, 1989; Yagodin et al., 1995), therefore the AR-mediated reduction in astrocyte swelling recorded (Figs. 1 and 2) may be associated with changes in [Ca2+]i. Hence, we next monitored [Ca2+]i with the Fluo-4/AM indicator (Fig. 4).
FIGURE 4.

AR activation in swelling cortical astrocytes reduces increases in [Ca2+]i. (A) Representative fluorescence images of astrocytes labeled with Ca2+ indicator (Fluo-4/AM ester) and stimulated with hypotonic medium (Hypo). Scale bar: 40 μm. (B–F) Representative (upper panel) and mean (lower panel) fluorescence intensity changes in [Ca2+]i (ΔF/F0) in astrocytes stimulated first with (B) isotonic medium (n=36; four experimental replicates), (C) 1 μM EPI (n=23; three experimental replicates), or (D) 10 μM ISO and then with hypotonic medium (n=28; four experimental replicates). In panels E and F, cells were exposed to hypotonic medium and then to (E) 1 μMEPI (n=21; three experimental replicates) or (F) 10 μM ISO (n=33; four experimental replicates). Note that hypotonic medium-induced changes in [Ca2+]i are shorter in (C) EPI− or (D) ISO-pretreated astrocytes than in untreated cells (compare traces marked with one asterisk, E, F). Values are mean±SEM (gray lines). n, total number of independent experiments. Times of stimulation are indicated with black lines (hypotonic and isotonic) and white lines (EPI or ISO). Dotted lines indicate the prestimulus ΔF/F0. (G–I) Cumulative ΔF/F0 changes normalized to the maxima over a 100-s interval after hypotonic stimulation in untreated (Hypo) and EPI-pretreated (G; EPI+Hypo) or ISO-pretreated cells (H; ISO+Hypo) and (I) after stimulation with EPI in untreated cells (EPI) and in cells pretreated with hypotonic medium and then treated with EPI (Hypo+EPI) or ISO (Hypo+ISO). Note that AR activation speeds the decline of hypotonicity-induced changes in [Ca2+]i. Numbers in parentheses are the numbers of cells analyzed. Values are mean±SEM. In panels G and H, *P < 0.05, **P < 0.01, ***P < 0.001 vs. Hypo. In panel I, *P < 0.05, EPI vs. Hypo+EPI; ###P < 0.0001, EPI vs. Hypo+ISO. Single-exponential decay functions were fitted to data points (black lines) with forms: F=F0 + c × exp(−t × k), with rate constants (k) of k(Hypo)=0.007, k(EPI+Hypo)=0.012, k(ISO+Hypo)=0.016, k(EPI)=0.01, k(Hypo+EPI)=0.009, k(Hypo + ISO)=0.039. Dotted lines indicate the maximum change in ΔF/F0.
EPI transiently increased [Ca2+]i [Fig. 4(A)], and the increase was specific, since vehicle application was ineffective [Fig. 4(B)]. The increases in [Ca2+]i oscillated [n = 23; Fig. 4(C)], likely through α-AR activation (Yagodin et al., 1995), since oscillations were not recorded when the selective β-AR agonist ISO was used [n = 28, Fig. 4(D)].
After application of hypotonic solution, the oscillatory increases in [Ca2+]i [Fig. 4(E,F), upper panels] were observed [n=54; Fig. 4(E,F)]. However, in cells pretreated with EPI (n=23) or ISO (n = 28), [Ca2+]i increased initially and then rapidly declined toward basal levels upon hypotonic stimulation [Fig. 4(C,D)]. The decline was more rapid than in untreated cells [Fig. 4(C–F); see traces marked by one asterisk]. Thus, AR activation attenuated the hypotonicity-induced increase in [Ca2+]i, manifesting in reduced cytoplasmic excitability of astrocytes. In cells pretreated with hypotonic medium, the EPI-induced increases in [Ca2+]i were briefer than in untreated cells [Fig. 4(E) vs. (C); see traces marked by two asterisks].
To quantify the effect of different types of stimuli on the duration of changes in [Ca2+]i, we measured changes in mean cumulative Fluo-4/AM fluorescence intensity over 100-s intervals [Fig. 4(G–I)]. After hypotonic stimulation, the average decline of fluorescence signals, measured as the half-time (t1/2), was ~twofold longer (99 s) in untreated cells than in cells pretreated with EPI (58 s) or ISO (43 s) [Fig. 4(G,H)]. This likely contributed to the reductions of signal amplitudes at 400 s after the stimulation [P<0.05; Fig. 4(G,H)]. The faster reductions of [Ca2+]i elevations in pretreated cells likely reflects activation of the β-AR/cAMP signaling pathway. This experiment mirrors the putative prevention of swelling by AR activation.
However, if one wanted to use AR activation as a therapy after cellular edema has developed, it would be instructive to know whether AR activation in astrocytes after hypotonic stimulation affects the time-course of changes in [Ca2+]i. The average decline in the cumulative fluorescence after EPI treatment was similar in cells with [t1/2=77 s; Fig. 4(I)] or without (t1/2=69 s) hypotonic stimulation, and in both groups the rate of decline was 75% slower than in cells treated with ISO after hypotonic stimulation [t1/2=18 s; note also the reduction in amplitudes; P<0.0001, Fig. 4(I)]. These findings further support a role for β-AR/cAMP signaling in ISO-mediated attenuation of cytoplasmic Ca2+ excitability, which may consequently reduce hypotonicity-induced astrocyte swelling. These findings also suggest that AR activation attenuates cellular edema.
EPI Injected into the Center of Spinal Cord Injury Lesions Reduces Astrocyte Edema
Next we determined whether EPI reduces post-traumatic swelling of astrocytes. Cellular edema is one of the most lethal responses to neurotrauma (Teng and Wrathall, 1997). Therefore, we used a well-established rat model of contusion SCI (Teng et al., 2004) and administered EPI into the lesion epicenter 5 min after injury.
First, we analyzed the efficiency of SR101 and TRH in labeling astroglial cells (data not shown). No SR101 or TRH signals were detected in NeuN-positive mature neurons by immunocytochemical staining. Coimmunostaining for GFAP confirmed that most of the SR101/TRH signals were in astroglia; some blood vessels were stained as well, likely because of astrocytic processes associated with the vessels (not shown), consistent with a previous report (Nimmerjahn et al., 2004).
Microinjection of EPI significantly reduced the average size of SR101- and TRH-stained astroglia [yellow arrows; Fig. 5(A)] in gray matter of the injured spinal cord. In confocal z stack images, the size of the largest cross-sectional area of the glial cell body correlated positively with the overall volume of the same cell. In general, astroglial bodies in the EPI-treated injury epicenter were markedly smaller than those of the saline-treated spinal cords [i.e., outlined by fewer z-steps; see white circles in Fig. 5(B)]. A three-dimensional z-stack view of representative cells revealed a sharp contrast between the EPI-treated and control spinal cords [Fig. 5(C)]. As shown by the cumulative volume of the cell body calculated from measurements of all z steps, the two groups differed significantly in all three metrics in systematically selected SR101-/TRH-stained astroglial cells [Fig. 5(D–F)]. Correspondingly, issue integrity and the average spinal cord astrocyte volume was significantly improved in the segments 1–3 mm caudal to the lesion epicenter in EPI-treated spinal cords than in controls [Fig. 5(G,H)].
FIGURE 5.

EPI treatment reduces astrocyte swelling after spinal cord injury. (A) In gray matter sampled in each millimeter of tissue around the SCI epicenter, cell bodies (yellow arrows) are larger in saline-treated than in EPI-treated spinal cords. (B) Z-stack serial confocal images of representative cells stained with SR101 and TRH (white outlines), which were used to calculate the cell body volume in the two study groups. (C) A representative three-dimensional reconstruction of the confocal z-series shows the difference in cell body volume between the two groups. The size of the largest cross-sectional area of the glial cell body correlates positively with the volume of the same cell. (D–F). Semiquantitative analyses show that the two study groups differed in (D) the percentage of each standardized imaging field occupied by positive fluorescence signals (n=3/treatment), (E) the mean size of the widest/largest cross-sectional area measured per astrocyte (n=15/group), and (F) the mean volume of the astrocyte cell body (n=15/group), sampled from each millimeter of tissue adjacent to the injury epicenter (i.e., 0 mm, not included). (G) Histochemical staining images of spinal cord coronal sections sampled at 1-mm intervals rostral and caudal to the injury epicenter (total length: 10 mm). (H) The average tissue volume differed significantly between the EPI-treated and saline control groups in loci 1–3 mm caudal to the epicenter (i.e., −1 to −3 mm; n=30 cells from three rats in each group; P < 0.05, repeated-measures ANOVA with post hoc t test).
As shown by analysis of NeuN staining in the spinal cord, neurons in the intermedial gray matter and the expanded pericentral canal gray matter [Fig. 6(A)] were significantly larger in saline controls than in uninjured or EPI-treated rats; however, the average sizes of ventral horn neurons remained statistically comparable in the three groups [Fig. 6(A–E)]. Immunostaining for NFM confirmed the greater average cell body size in saline controls than in EPI-treated or uninjured spinal cords [Fig. 6(F,G)].
FIGURE 6.

EPI treatment reduces neuronal swelling after spinal cord injury. (A) Immunocytochemical imaging of NeuN-positive neurons in gray matter sampled 2 mm caudal to the injury epicenter shows strongly labeled nuclei and more faintly labeled cell body outlines. Neuron cell body sizes were compared in (1) ventral horn (black dashed circles), (2) intermedial gray matter (blue dashed circles), and (3) expanded pericentral canal gray matter (orange dashed circles). (B) The average size of ventral horn motor neurons between the groups. (C, D) After SCI, the mean body size of interneurons in the intermedial gray matter (C) and in the expanded pericentral canal gray matter (D) was significantly larger in saline controls. Immunocytochemical staining for NFM confirmed that the neurons (green cells with white outlines, panel E) in saline controls had significantly larger cell bodies (F) and significantly thicker axon hillocks (G), than EPI-treated spinal cords in the impacted pericentral canal regions that were indiscernible from those in an uninjured naive spinal cord (n=30 cells from three rats in each group).
Discussion
In this study, we tested the hypothesis that AR agonists, including EPI and ISO, can protect neural parenchyma from damage. We found that EPI administration reduces astrocyte swelling in vitro and in vivo likely through a mechanism involving a cAMP-mediated reduction in cytoplasmic excitability. This finding suggests a new strategy for treating neurotrauma and other disorders involving cellular edema.
As shown by in vivo real-time imaging of fluorescently labeled astrocytes in mouse neocortex by two-photon laser scanning microscopy, topical application of EPI (25 μM) prevented the 45% increase in astrocyte size seen within 1 h after i.p. injection of distilled water in controls, consistent with previous studies (Risher et al., 2009). Although application of EPI to the neocortex, especially at increased concentrations (50 μM), elicited vasoconstriction in some experiments through α-AR activation, the lack of swelling probably did not result from indirect water distribution in the tissue parenchyma, because EPI pretreatment also reduced swelling at doses between 0.1 and 100 μM EPI of cultured cortical astrocytes [Fig. 2(E)]. Swelling of cultured cortical astrocytes was also reduced by ISO [Fig. 2(E)], a selective β-AR agonist, indicating the involvement of the β-AR/cAMP pathway. Consistent with this finding, the membrane permeable analog of cAMP (dbcAMP) reduces hypotonicity-induced swelling of astrocytes (Bender et al., 1992), and increases in [cAMP]i induced by activation of G-protein-coupled receptors attenuate hypotonic swelling in retinal cells (Wurm et al., 2010) and trabecular meshwork cells (Srinivas et al., 2004). Interestingly, EPI-elevated [cAMP]i increased much slower in hypotonically challenged astrocytes than in control cells (Fig. 3), which may mirror endogeneous mechanisms that prevent swelling.
Cycling AMP-Mediated Reduction in Cytoplasmic Excitability of Astrocytes
Astrocytes exhibit a special form of excitability (i.e., cytoplasmic excitability) reflected by increases in [Ca2+]i in response to various stimuli (Verkhratsky et al., 1998). Consistent with previous reports (O’Connor and Kimelberg, 1993; Pangrsic et al., 2006), we found that exposure of astrocytes to hypotonicity elicits repetitive transient increases in [Ca2+]i (Fig. 4), which may contribute to astrocyte swelling (O’Connor and Kimelberg, 1993). Since β-AR activation alone reduced hypotonicity-induced astrocyte swelling, we next examined whether changes in [cAMP]i triggered by AR agonists (Vardjan et al., 2014) affect hypotonicity-induced Ca2+ signaling.
Pretreatment of cells with EPI triggered repeated transient increases in [Ca2+]i (Fig. 4) (Yagodin et al., 1995), which were absent in cells pretreated with ISO. Previously, using Fura-2 AM, astrocytic resting [Ca2+]i was measured to be <100 nM, but it increased to >2 μM when ATP was applied (Pangrsic et al., 2006). In the present study we used Fluo-4 AM, which exhibits a relatively low affinity for Ca2+ (Kd=345 nM; Gee et al., 2000), hence [Ca2+]i was reaching levels >1 μM when EPI was applied, since fluorescence intensity increased by 5–6-fold in comparison to resting values (Horvat et al., 2016; Potokar et al., 2009). A similar increase in fluorescence was observed when ATP was the stimulus (Pangrsic et al., 2006). Moreover, application of EPI or ATP yielded similar increases in [Ca2+]i in Bergman glia (Kirischuk et al., 1996), thus EPI may be equally potent as ATP in elevating [Ca2+]i in astrocytes.
EPI and ISO also induced a persistent increase in [cAMP]i (Fig. 3) through β-AR activation, as described (Vardjan et al., 2014). After pretreatment with EPI or ISO for 5 min, most cells responded to hypotonicity with a single transient increase in [Ca2+]i that was much briefer than in control cells. This finding implies that EPI-mediated reduction of hypotonicity-induced swelling of cortical astrocytes in vivo (Fig. 1) is associated with a reduction in [Ca2+]i that is linked to an increase in [cAMP]i.
Hypotonicity-induced increases in [Ca2+]i in astrocytes may be associated with Ca2+ influx resulting from stretching of mechanosensitive plasma membrane channels such as TRPV-4 (Conner et al., 2012), as in other cell types (Liu et al., 2006; Galizia et al., 2012), or from activation of L-type Ca2+ channels (O’Connor and Kimelberg, 1993). Moreover, Ca2+ release from intracellular stores (Fischer et al., 1997) upon autocrine activation of P2 receptors by adenosine triphosphate (Thrane et al., 2011) and subsequent activation of inositol triphosphate receptors may be involved. How increased [Ca2+]i controls volume changes in astrocytes is unclear. Downregulation of TRPV-4 function may be mediated by cAMP; however, because TRPV-4 is regulated by protein kinase A (Mamenko et al., 2013), it is likely that cAMP-dependent mechanisms also target other proteins that contribute to Ca2+ homeostasis, such as L-type Ca2+ channels (Gao et al., 1997) and inositol triphosphate receptors (Betzenhauser et al., 2009), as well as processes that govern the translocation of AQP4 to the plasma membrane (Potokar et al., 2013), phosphorylation of AQP4 (Song and Gunnarson 2012), and morphologic changes in astrocytes (Vardjan et al., 2014).
AR Activation Attenuates Cellular Edema
To examine whether EPI can reduce astrocyte swelling in a pathologic setting, we used a rat model of SCI (Teng et al., 2004). EPI administration into the epicenter of the lesion starting 5 min after contusion injury reduced the overall cell body size of injury-affected astroglia in the GM. This reduction in astrocytic edema appeared to be beneficial, as neurons showed less swelling. Since post-traumatic swelling of neurons involves excitotoxicity (Liu et al., 1997), it is likely that EPI-attenuated astrocytic edema reduced post-SCI excitotoxicity, which, together with intraparenchymal pressure reduction, impeded neuronal swelling. GM edema, which peaks 15 min to 1 h after contusion insult (the most common SCI seen clinically) (Teng and Wrathall, 1997), is the leading physical trigger of acute neuron and astroglia death after neurotrauma and stroke. Therefore, therapies based on β-AR agonists should be investigated and developed to prevent neural cell edema and provide neuroprotection for functional recovery.
In summary, using multiple in vitro and in vivo approaches, we have shown that EPI administration reduces hypotonicity-induced astrocyte swelling through a mechanism involving cAMP-mediated modulation of hypotonicity-induced Ca2+-excitability. EPI also reduced cellular edema after traumatic SCI. These results suggest a novel approach for neuroprotection and treatment of cytotoxic edema in CNS.
Acknowledgments
We thank Dr. Martin Lohse and Dr. Viacheslav Olegowitsch Nikolaev (University of Würzburg, Würzburg, Germany) for providing the Epac1-camps FRET plasmid construct. We also thank Urša Gubenšek for assistance with the experiments. This work was supported by the Slovenian Research Agency (P3 310 to R.Z., J3 4051 to R.Z., J3 3632 to R.Z., J3 6790 to R.Z., J3 4146 to M.K.), the Centre of Excellence for Integrated Approaches in Chemistry and Biology of Proteins to R.Z., the COST Action BM1002 to R.Z., the EduGlia ITN EU grant to R.Z., the National Institute of Health (NS083858 to S.A.K.), the American Heart Association (12GRNT16570006 to S.A.K.), the US Department of Veterans Affairs Rehabilitation Research and Development (B7076R to Y.D.T.), and the US Department of Defense-Center for Integration of Medicine & Innovative Technology grants to Y.D.T.
Abbreviations
- AQP
aquaporin
- AR
adrenergic receptor
- CFP
cyan fluorescent protein
- CA
cardiac arrest
- EGFP
enhanced green fluorescent protein
- EPI
epinephrine
- FRET
fluorescence resonance energy transfer
- GFAP
glial fibrillary acidic protein
- ISO
isoprenaline
- NE
norepinephrine
- NeuN
neuronal nuclear antigen
- NFM
neurofilament intermediate filament protein M
- SCI
spinal cord contusion injury
- SR101
sulforhodamine 101
- TRH
Texas Red hydrazide
- YFP
yellow fluorescent protein
Footnotes
Disclosure
The authors declare no competing financial interests.
References
- Andrew RD, Labron MW, Boehnke SE, Carnduff L, Kirov SA. Physiological evidence that pyramidal neurons lack functional water channels. Cereb Cortex. 2007;17:787–802. doi: 10.1093/cercor/bhk032. [DOI] [PubMed] [Google Scholar]
- Appaix F, Girod S, Boisseau S, Römer J, Vial JC, Albrieux M, Maurin M, Depaulis A, Guillemain I, van der Sanden B. Specific in vivo staining of astrocytes in the whole brain after intravenous injection of sulforhodamine dyes. PLoS One. 2012;7:e35169. doi: 10.1371/journal.pone.0035169. [DOI] [PMC free article] [PubMed] [Google Scholar]
- Azevedo FA, Carvalho LR, Grinberg LT, Farfel JM, Ferretti RE, Leite RE, Jacob Filho W, Lent R, Herculano-Houzel S. Equal numbers of neuronal and nonneuronal cells make the human brain an isometrically scaled-up primate brain. J Comp Neurol. 2009;513:532–541. doi: 10.1002/cne.21974. [DOI] [PubMed] [Google Scholar]
- Bender AS, Neary JT, Norenberg MD. Involvement of second messengers and protein phosphorylation in astrocyte swelling. Can J Physiol Pharmacol. 1992;70(Suppl):S362–S366. doi: 10.1139/y92-284. [DOI] [PubMed] [Google Scholar]
- Betzenhauser MJ, Fike JL, Wagner LE, Yule DI. Protein kinase A increases type-2 inositol 1,4,5-trisphosphate receptor activity by phosphorylation of serine 937. J Biol Chem. 2009;284:25116–25125. doi: 10.1074/jbc.M109.010132. [DOI] [PMC free article] [PubMed] [Google Scholar]
- Börner S, Schwede F, Schlipp A, Berisha F, Calebiro D, Lohse MJ, Nikolaev VO. FRET measurements of intracellular cAMP concentrations and cAMP analog permeability in intact cells. Nat Protoc. 2011;6:427–438. doi: 10.1038/nprot.2010.198. [DOI] [PubMed] [Google Scholar]
- Conner MT, Conner AC, Bland CE, Taylor LH, Brown JE, Parri HR, Bill RM. Rapid aquaporin translocation regulates cellular water flow: mechanism of hypotonicity-induced subcellular localization of aquaporin 1 water channel. J Biol Chem. 2012;287:11516–11525. doi: 10.1074/jbc.M111.329219. [DOI] [PMC free article] [PubMed] [Google Scholar]
- Darby M, Kuzmiski JB, Panenka W, Feighan D, MacVicar BA. ATP released from astrocytes during swelling activates chloride channels. J Neurophysiol. 2003;89:1870–1877. doi: 10.1152/jn.00510.2002. [DOI] [PubMed] [Google Scholar]
- Dredge BK, Jensen KB. NeuN/Rbfox3 nuclear and cytoplasmic isoforms differentially regulate alternative splicing and nonsense-mediated decay of Rbfox2. PLoS One. 2011;6:e21585. doi: 10.1371/journal.pone.0021585. [DOI] [PMC free article] [PubMed] [Google Scholar]
- Fischer R, Schliess F, Häussinger D. Characterization of the hypo-osmolarity-induced Ca2+ response in cultured rat astrocytes. Glia. 1997;20:51–58. [PubMed] [Google Scholar]
- Galizia L, Pizzoni A, Fernandez J, Rivarola V, Capurro C, Ford P. Functional interaction between AQP2 and TRPV4 in renal cells. J Cell Biochem. 2012;113:580–589. doi: 10.1002/jcb.23382. [DOI] [PubMed] [Google Scholar]
- Gao T, Yatani A, Dell’Acqua ML, Sako H, Green SA, Dascal N, Scott JD, Hosey MM. cAMP-dependent regulation of cardiac L-type Ca2+ channels requires membrane targeting of PKA and phosphorylation of channel subunits. Neuron. 1997;19:185–196. doi: 10.1016/s0896-6273(00)80358-x. [DOI] [PubMed] [Google Scholar]
- Gee KR, Brown KA, Chen WN, Bishop-Stewart J, Gray D, Johnson I. Chemical and physiological characterization of fluo-4 Ca(2+)-indicator dyes. Cell Calcium. 2000;27:97–106. doi: 10.1054/ceca.1999.0095. [DOI] [PubMed] [Google Scholar]
- Green R, Wachsmann-Hogiu S. Development, history, and future of automated cell counters. Clin Lab Med. 2015;35:1–10. doi: 10.1016/j.cll.2014.11.003. [DOI] [PubMed] [Google Scholar]
- Harukuni I, Kirsch JR, Bhardwaj A. Cerebral resuscitation: Role of osmotherapy. J Anesth. 2002;16:229–237. doi: 10.1007/s005400200030. [DOI] [PubMed] [Google Scholar]
- Herculano-Houzel S, Lent R. Isotropic fractionator: A simple, rapid method for the quantification of total cell and neuron numbers in the brain. J Neurosci. 2005;25:2518–2521. doi: 10.1523/JNEUROSCI.4526-04.2005. [DOI] [PMC free article] [PubMed] [Google Scholar]
- Horvat A, Zorec R, Vardjan N. Adrenergic stimulation of single rat astrocytes results in distinct temporal changes in intracellular Ca(2+) and cAMP-dependent PKA responses. Cell Calcium. 2016 doi: 10.1016/j.ceca.2016.01.002. [DOI] [PubMed] [Google Scholar]
- Kabadi SV, Faden AI. Neuroprotective strategies for traumatic brain injury: Improving clinical translation. Int J Mol Sci. 2014;15:1216–1236. doi: 10.3390/ijms15011216. [DOI] [PMC free article] [PubMed] [Google Scholar]
- Khanna A, Walcott BP, Kahle KT, Simard JM. Effect of glibenclamide on the prevention of secondary brain injury following ischemic stroke in humans. Neurosurg Focus. 2014;36:E11. doi: 10.3171/2013.10.FOCUS13404. [DOI] [PMC free article] [PubMed] [Google Scholar]
- Kimelberg HK, Goderie SK, Higman S, Pang S, Waniewski RA. Swelling- induced release of glutamate, aspartate, and taurine from astrocyte cultures. J Neurosci. 1990;10:1583–1591. doi: 10.1523/JNEUROSCI.10-05-01583.1990. [DOI] [PMC free article] [PubMed] [Google Scholar]
- Kirischuk S, Tuschick S, Verkhratsky A, Kettenmann H. Calcium signalling in mouse Bergmann glial cells mediated by alpha1-adrenoreceptors and H1 histamine receptors. Eur J Neurosci. 1996;8:1198–1208. doi: 10.1111/j.1460-9568.1996.tb01288.x. [DOI] [PubMed] [Google Scholar]
- Kozler P, Riljak V, Pokorný J. Both water intoxication and osmotic BBB disruption increase brain water content in rats. Physiol Res. 2013;62(Suppl 1):S75–S80. doi: 10.33549/physiolres.932566. [DOI] [PubMed] [Google Scholar]
- Krämer-Guth A, Busch GL, Kaba NK, Schwedler S, Wanner C, Lang F. Effect of osmolarity on LDL binding and internalization in hepatocytes. Am J Physiol. 1997;273:C1409–C1415. doi: 10.1152/ajpcell.1997.273.4.C1409. [DOI] [PubMed] [Google Scholar]
- Liu X, Bandyopadhyay BC, Bandyopadhyay B, Nakamoto T, Singh B, Liedtke W, Melvin JE, Ambudkar I. A role for AQP5 in activation of TRPV4 by hypotonicity: Concerted involvement of AQP5 and TRPV4 in regulation of cell volume recovery. J Biol Chem. 2006;281:15485–15495. doi: 10.1074/jbc.M600549200. [DOI] [PubMed] [Google Scholar]
- Liu XZ, Xu XM, Hu R, Du C, Zhang SX, McDonald JW, Dong HX, Wu YJ, Fan GS, Jacquin MF, Hsu CY, Choi DW. Neuronal and glial apoptosis after traumatic spinal cord injury. J Neurosci. 1997;17:5395–5406. doi: 10.1523/JNEUROSCI.17-14-05395.1997. [DOI] [PMC free article] [PubMed] [Google Scholar]
- Malarkey EB, Parpura V. Mechanisms of glutamate release from astrocytes. Neurochem Int. 2008;52:142–154. doi: 10.1016/j.neuint.2007.06.005. [DOI] [PMC free article] [PubMed] [Google Scholar]
- Mamenko M, Zaika OL, Boukelmoune N, Berrout J, O’Neil RG, Pochynyuk O. Discrete control of TRPV4 channel function in the distal nephron by protein kinases A and C. J Biol Chem. 2013;288:20306–20314. doi: 10.1074/jbc.M113.466797. [DOI] [PMC free article] [PubMed] [Google Scholar]
- Manley GT, Fujimura M, Ma T, Noshita N, Filiz F, Bollen AW, Chan P, Verkman AS. Aquaporin-4 deletion in mice reduces brain edema after acute water intoxication and ischemic stroke. Nat Med. 2000;6:159–163. doi: 10.1038/72256. [DOI] [PubMed] [Google Scholar]
- Nagelhus EA, Lehmann A, Ottersen OP. Neuronal-glial exchange of taurine during hypo-osmotic stress: a combined immunocytochemical and biochemical analysis in rat cerebellar cortex. Neuroscience. 1993;54:615–631. doi: 10.1016/0306-4522(93)90233-6. [DOI] [PubMed] [Google Scholar]
- Nikolaev VO, Bünemann M, Hein L, Hannawacker A, Lohse MJ. Novel single chain cAMP sensors for receptor-induced signal propagation. J Biol Chem. 2004;279:37215–37218. doi: 10.1074/jbc.C400302200. [DOI] [PubMed] [Google Scholar]
- Nimmerjahn A, Kirchhoff F, Kerr JN, Helmchen F. Sulforhodamine 101 as a specific marker of astroglia in the neocortex in vivo. Nat Methods. 2004;1:31–37. doi: 10.1038/nmeth706. [DOI] [PubMed] [Google Scholar]
- Nolte C, Matyash M, Pivneva T, Schipke CG, Ohlemeyer C, Hanisch UK, Kirchhoff F, Kettenmann H. GFAP promoter-controlled EGFP-expressing transgenic mice: A tool to visualize astrocytes and astrogliosis in living brain tissue. Glia. 2001;33:72–86. [PubMed] [Google Scholar]
- O’Connor ER, Kimelberg HK. Role of calcium in astrocyte volume regulation and in the release of ions and amino acids. J Neurosci. 1993;13:2638–2650. doi: 10.1523/JNEUROSCI.13-06-02638.1993. [DOI] [PMC free article] [PubMed] [Google Scholar]
- Pangrsic T, Potokar M, Haydon P, Zorec R, Kreft M. Astrocyte swelling leads to membrane unfolding, not membrane insertion. J Neurochem. 2006;99:514–523. doi: 10.1111/j.1471-4159.2006.04042.x. [DOI] [PubMed] [Google Scholar]
- Papadopoulos MC, Verkman AS. Aquaporin water channels in the nervous system. Nat Rev Neurosci. 2013;14:265–277. doi: 10.1038/nrn3468. [DOI] [PMC free article] [PubMed] [Google Scholar]
- Potokar M, Kreft M, Lee SY, Takano H, Haydon PG, Zorec R. Trafficking of astrocytic vesicles in hippocampal slices. Biochem Biophys Res Commun. 2009;390:1192–1196. doi: 10.1016/j.bbrc.2009.10.119. [DOI] [PMC free article] [PubMed] [Google Scholar]
- Potokar M, Stenovec M, Jorgačevski J, Holen T, Kreft M, Ottersen OP, Zorec R. Regulation of AQP4 surface expression via vesicle mobility in astrocytes. Glia. 2013;61:917–928. doi: 10.1002/glia.22485. [DOI] [PubMed] [Google Scholar]
- Raslan A, Bhardwaj A. Medical management of cerebral edema. Neurosurg Focus. 2007;22:E12. doi: 10.3171/foc.2007.22.5.13. [DOI] [PubMed] [Google Scholar]
- Reetz G, Wiesinger H, Reiser G. ATP-induced oscillations of cytosolic Ca2+ activity in cultured astrocytes from rat brain are modulated by medium osmolarity indicating a control of [Ca2+]i oscillations by cell volume. Neurochem Res. 1997;22:621–628. doi: 10.1023/a:1022430305491. [DOI] [PubMed] [Google Scholar]
- Risher WC, Andrew RD, Kirov SA. Real-time passive volume responses of astrocytes to acute osmotic and ischemic stress in cortical slices and in vivo revealed by two-photon microscopy. Glia. 2009;57:207–221. doi: 10.1002/glia.20747. [DOI] [PMC free article] [PubMed] [Google Scholar]
- Risher WC, Ard D, Yuan J, Kirov SA. Recurrent spontaneous spreading depolarizations facilitate acute dendritic injury in the ischemic penumbra. J Neurosci. 2010;30:9859–9868. doi: 10.1523/JNEUROSCI.1917-10.2010. [DOI] [PMC free article] [PubMed] [Google Scholar]
- Risher WC, Croom D, Kirov SA. Persistent astroglial swelling accompanies rapid reversible dendritic injury during stroke-induced spreading depolarizations. Glia. 2012;60:1709–1720. doi: 10.1002/glia.22390. [DOI] [PMC free article] [PubMed] [Google Scholar]
- Salm AK, McCarthy KD. Expression of beta-adrenergic receptors by astrocytes isolated from adult rat cortex. Glia. 1989;2:346–352. doi: 10.1002/glia.440020507. [DOI] [PubMed] [Google Scholar]
- Seifert G, Schilling K, Steinhäuser C. Astrocyte dysfunction in neurological disorders: A molecular perspective. Nat Rev Neurosci. 2006;7:194–206. doi: 10.1038/nrn1870. [DOI] [PubMed] [Google Scholar]
- Selye H. Ischemic necrosis: prevention by stress. Science. 1967;156:1262–1263. doi: 10.1126/science.156.3779.1262. [DOI] [PubMed] [Google Scholar]
- Shain W, Forman DS, Madelian V, Turner JN. Morphology of astroglial cells is controlled by beta-adrenergic receptors. J Cell Biol. 1987;105:2307–2314. doi: 10.1083/jcb.105.5.2307. [DOI] [PMC free article] [PubMed] [Google Scholar]
- Simard JM, Kent TA, Chen M, Tarasov KV, Gerzanich V. Brain oedema in focal ischaemia: Molecular pathophysiology and theoretical implications. Lancet Neurol. 2007;6:258–68. doi: 10.1016/S1474-4422(07)70055-8. [DOI] [PMC free article] [PubMed] [Google Scholar]
- Simard JM, Woo SK, Schwartzbauer GT, Gerzanich V. Sulfonylurea receptor 1 in central nervous system injury: A focused review. J Cereb Blood Flow Metab. 2012;32:1699–1717. doi: 10.1038/jcbfm.2012.91. [DOI] [PMC free article] [PubMed] [Google Scholar]
- Song Y, Gunnarson E. Potassium dependent regulation of astrocyte water permeability is mediated by cAMP signaling. PLoS One. 2012;7:e34936. doi: 10.1371/journal.pone.0034936. [DOI] [PMC free article] [PubMed] [Google Scholar]
- Srinivas SP, Maertens C, Goon LH, Goon L, Satpathy M, Yue BY, Droogmans G, Nilius B. Cell volume response to hyposmotic shock and elevated cAMP in bovine trabecular meshwork cells. Exp Eye Res. 2004;78:15–26. doi: 10.1016/j.exer.2003.10.001. [DOI] [PubMed] [Google Scholar]
- Stokum JA, Gerzanich V, Simard JM. Molecular pathophysiology of cerebral edema. J Cereb Blood Flow Metab. 2015 doi: 10.1177/0271678X15617172. [DOI] [PMC free article] [PubMed] [Google Scholar]
- Sword J, Masuda T, Croom D, Kirov SA. Evolution of neuronal and astroglial disruption in the peri-contusional cortex of mice revealed by in vivo two-photon imaging. Brain. 2013;136:1446–1461. doi: 10.1093/brain/awt026. [DOI] [PMC free article] [PubMed] [Google Scholar]
- Syková E, Nicholson C. Diffusion in brain extracellular space. Physiol Rev. 2008;88:1277–1340. doi: 10.1152/physrev.00027.2007. [DOI] [PMC free article] [PubMed] [Google Scholar]
- Tauc M, Le Maout S, Poujeol P. Fluorescent video-microscopy study of regulatory volume decrease in primary culture of rabbit proximal convoluted tubule. Biochim Biophys Acta. 1990;1052:278–284. doi: 10.1016/0167-4889(90)90222-y. [DOI] [PubMed] [Google Scholar]
- Teng YD, Choi H, Onario RC, Zhu S, Desilets FC, Lan S, Woodard EJ, Snyder EY, Eichler ME, Friedlander RM. Minocycline inhibits contusion-triggered mitochondrial cytochrome c release and mitigates functional deficits after spinal cord injury. Proc Natl Acad Sci USA. 2004;101:3071–3076. doi: 10.1073/pnas.0306239101. [DOI] [PMC free article] [PubMed] [Google Scholar]
- Teng YD, Wrathall JR. Local blockade of sodium channels by tetrodotoxin ameliorates tissue loss and long-term functional deficits resulting from experimental spinal cord injury. J Neurosci. 1997;17:4359–4366. doi: 10.1523/JNEUROSCI.17-11-04359.1997. [DOI] [PMC free article] [PubMed] [Google Scholar]
- Thrane AS, Rangroo Thrane V, Nedergaard M. Drowning stars: Reassessing the role of astrocytes in brain edema. Trends Neurosci. 2014;37:620–628. doi: 10.1016/j.tins.2014.08.010. [DOI] [PMC free article] [PubMed] [Google Scholar]
- Thrane AS, Rappold PM, Fujita T, Torres A, Bekar LK, Takano T, Peng W, Wang F, Rangroo Thrane V, Enger R, Haj-Yasein NN, Skare Ø, Holen T, Klungland A, Ottersen OP, Nedergaard M, Nagelhus EA. Critical role of aquaporin-4 (AQP4) in astrocytic Ca2+ signaling events elicited by cerebral edema. Proc Natl Acad Sci USA. 2011;108:846–851. doi: 10.1073/pnas.1015217108. [DOI] [PMC free article] [PubMed] [Google Scholar]
- Unterberg AW, Stover J, Kress B, Kiening KL. Edema and brain trauma. Neuroscience. 2004;129:1021–1029. doi: 10.1016/j.neuroscience.2004.06.046. [DOI] [PubMed] [Google Scholar]
- Vajda Z, Pedersen M, Füchtbauer EM, Wertz K, Stødkilde-Jørgensen H, Sulyok E, Dóczi T, Neely JD, Agre P, Frøkiaer J, Nielsen S. Delayed onset of brain edema and mislocalization of aquaporin-4 in dystrophin-null transgenic mice. Proc Natl Acad Sci USA. 2002;99:13131–13136. doi: 10.1073/pnas.192457099. [DOI] [PMC free article] [PubMed] [Google Scholar]
- Vardjan N, Kreft M, Zorec R. Dynamics of β-adrenergic/cAMP signaling and morphological changes in cultured astrocytes. Glia. 2014 doi: 10.1002/glia.22626. [DOI] [PubMed] [Google Scholar]
- Verkhratsky A, Orkand RK, Kettenmann H. Glial calcium: Homeostasis and signaling function. Physiol Rev. 1998;78:99–141. doi: 10.1152/physrev.1998.78.1.99. [DOI] [PubMed] [Google Scholar]
- Wang YF, Sun MY, Hou Q, Parpura V. Hyposmolality differentially and spatiotemporally modulates levels of glutamine synthetase and serine racemase in rat supraoptic nucleus. Glia. 2013;61:529–538. doi: 10.1002/glia.22453. [DOI] [PubMed] [Google Scholar]
- Wurm A, Lipp S, Pannicke T, Linnertz R, Krügel U, Schulz A, Färber K, Zahn D, Grosse J, Wiedemann P, Chen J, Schöneberg T, Illes P, Reichenbach A, Bringmann A. Endogenous purinergic signaling is required for osmotic volume regulation of retinal glial cells. J Neurochem. 2010;112:1261–1272. doi: 10.1111/j.1471-4159.2009.06541.x. [DOI] [PubMed] [Google Scholar]
- Yagodin S, Holtzclaw LA, Russell JT. Subcellular calcium oscillators and calcium influx support agonist-induced calcium waves in cultured astrocytes. Mol Cell Biochem. 1995;149150:137–144. doi: 10.1007/BF01076572. [DOI] [PubMed] [Google Scholar]
- Yamaguchi M, Yamada T, Kinoshita I, Wu S, Nagashima T, Tamaki N. Impaired learning of active avoidance in water-intoxicated rats. Acta Neurochir Suppl. 1997;70:152–154. doi: 10.1007/978-3-7091-6837-0_46. [DOI] [PubMed] [Google Scholar]
- Yoshioka A, Shimizu Y, Hirose G, Kitasato H, Pleasure D. Cyclic AMP-elevating agents prevent oligodendroglial excitotoxicity. J Neurochem. 1998;70:2416–2423. doi: 10.1046/j.1471-4159.1998.70062416.x. [DOI] [PubMed] [Google Scholar]
- Yu D, Thakor DK, Han I, Ropper AE, Haragopal H, Sidman RL, Zafonte R, Schachter SC, Teng YD. Alleviation of chronic pain following rat spinal cord compression injury with multimodal actions of huperzine A. Proc Natl Acad Sci USA. 2013;110:E746–E755. doi: 10.1073/pnas.1300083110. [DOI] [PMC free article] [PubMed] [Google Scholar]
- Zorec R, Araque A, Carmignoto G, Haydon PG, Verkhratsky A, Parpura V. Astroglial excitability and gliotransmission: An appraisal of Ca2+ as a signalling route. ASN Neurol. 2012:4. doi: 10.1042/AN20110061. [DOI] [PMC free article] [PubMed] [Google Scholar]