Abstract
Dielectric microspheres can confine light and sound for a length of time through high quality factor whispering gallery modes (WGM). Glass microspheres can be thought as a store of energy with a huge variety of applications: compact laser sources, highly sensitive biochemical sensors and nonlinear phenomena. A protocol for the fabrication of both the microspheres and coupling system is given. The couplers described here are tapered fibers. Efficient generation of nonlinear phenomena related to third order optical non-linear susceptibility Χ(3) interactions in triply resonant silica microspheres is presented in this paper. The interactions here reported are: Stimulated Raman Scattering (SRS), and four wave mixing processes comprising Stimulated Anti-stokes Raman Scattering (SARS). A proof of the cavity-enhanced phenomenon is given by the lack of correlation among the pump, signal and idler: a resonant mode has to exist in order to obtain the pair of signal and idler. In the case of hyperparametric oscillations (four wave mixing and stimulated anti-stokes Raman scattering), the modes must fulfill the energy and momentum conservation and, last but not least, have a good spatial overlap.
Keywords: Engineering, Issue 110, microresonators, whispering gallery mode, stimulated scattering, non-linear optics, four wave mixing, stimulated Antistokes scattering
Introduction
Whispering gallery mode resonators (WGMR) show two unique properties, a long photon lifetime and small mode volume that allow the reduction of the threshold of nonlinear phenomena1-3. Whispering gallery modes are optical modes that are confined at the dielectric air interface by total internal reflection. The small mode volume is due to the high spatial confinement whereas the temporal confinement is related to the quality factor Q of the cavity. WGMR can have different geometries and there are different fabrication techniques suitable for obtaining high Q resonators4-6 Surface tension cavities such as silica microspheres exhibit near atomic scale roughness, which translates in high quality factors. Both types of confinement significantly reduce the threshold for nonlinear effects due to the strong energy buildup inside the WGMR. It also allows continuous wave (CW) nonlinear optics.
WGMR can be described using the quantum numbers n, l, m and their polarization state, in a strong analogy with the hydrogen atom7. The spherical symmetry allows the separation in radial and angular dependencies. The radial solution is given by Bessel functions, the angular ones by the spherical harmonics8.
Silica glass is centrosymmetric and, therefore, second order phenomena related to Χ(2) interactions are forbidden. At the surface of the microsphere, the inversion of symmetry is broken and Χ(2) phenomena can be observed1. However, phase matching conditions for second-order frequency generation are more problematic than the equivalent in third order frequency generation, especially because the wavelengths involved are quite different and the role of dispersion can be quite important. The second order interactions are extremely weak. The generated power scales with Q3 whereas for a third order interaction the generated power scales with Q4.9 For that reason, the focus of this work is third order optical non-linear susceptibility Χ(3) interactions such as Stimulated Raman Scattering (SRS) and Stimulated Antistokes Raman Scattering (SARS), being SARS the less explored interaction10,11. Chang12 and Campillo13 pioneered the studies of nonlinear phenomena using droplets of highly nonlinear materials as WGMR but the pump laser was pulsed instead of CW. Silica microspheres14,10 and microtoroids15 provided more stable and robust platforms compared to the micro-droplets, gaining much of the attention in the last decades. Particularly, silica microspheres are very easy to fabricate and handle.
SRS is a pure gain process that can be easily achieved in silica WGMR14,15, since reaching a threshold is enough. In this case, the high circulating intensity inside the WGMR guarantees Raman lasing, but for parametric oscillations is not sufficient. In these cases, efficient oscillations require phase and mode matching, energy and momentum conservation law and a good spatial overlap of all resonant modes to be fulfilled16-18. This is the case for SARS and FWM in general.
Protocol
1. Fabrication of Ultrahigh Factor of Quality Microspheres
Strip about 1-2 cm of a standard single-mode (SMF) silica fiber off its acrylic coating using an optical stripper.
Clean the stripped part with acetone and cleave it.
Introduce the cleaved tip in one arm of a fusion splicer and produce a series of electric arc discharges using the splicer controller. Select "manual operation" from the splicer controller menu, set the values for arc power level and arc duration to 60 and 800 msec, respectively; select "arc" and push the bottom "+".
Once a sphere is taking shape, stop, rotate the fiber by 90° and repeat step 1.3.
Repeat step 1.3 at least 4 times to obtain a microsphere of about 160 μm. Repeat 16 times to obtain a microsphere of about 260 μm. Note: The electric arch discharges will produce the high melting temperature needed to fuse the silica glass. The surface tension will draw a spheroid from the mollified fiber tip; the size of the spheres is directly proportional to the number of arc shots, saturating at a diameter of about 350 μm, as it can be seen in Figure 119. The rotation ensures a spherical shape of the resonator.
2. Drawing a Tapered Fiber
Note: The tapered fiber is also needed for coupling light into the microresonators. The size of the microsphere will determine the waist of the taper. For sphere diameters larger than 125 μm, the diameter of the taper can be of about 3-4 μm. For smaller ones, the diameter of the taper should be smaller, say 1-2 μm. In order to keep losses at low level and to have just one mode in the tapered section (the fundamental one), the tapering has to be adiabatic (gradual transition from thick to thin diameter). The typical total length of the adiabatic tapered section is about 2 cm. Figure 2 shows the home-made device for pulling the fiber and Figure 3A shows a microphoto of a typical waist zone.
Strip 3-4 cm of a standard single-mode (SMF) silica fiber off its acrylic coating using an optical stripper, and connect the fiber ends to a laser (input) and a power meter (output). Be sure that the stripped zone is approximately in the middle of the fiber, not at one end. Use a bare fiber terminator in order to be able to connect the fiber ends to the laser and power meter. Place the laser and the power meter on top of the work bench.
Place the stripped fiber inside a short alumina cylinder, and the coated ends of the fiber into two translation stages that actuate simultaneously during the pulling process.
Heat the alumina cylinder (that acts as an oven) by an oxygen-butane flame up to a temperature close to a melting point of silica (about 2,100 °C).
Infer the adiabaticity of the taper from the observation of the transmission of a laser light operating at 635 nm. Check that at the output a homogeneous circular spot is preserved while tapering, indicating that no mode scrambling occurs. Stop pulling and retire the flame when the transmitted power stops oscillating, and is constant over time.
Glue the tapered fiber into a microscope glass slide shaped in the form of a U to accommodate the taper (See Figure 3B). Use a microscope glass slide of dimensions 76x26x1.2 mm.
3. Fabrication of Small Microspheres
Note: Small microspheres with diameters below the size of a standard fiber clad require previous tapering of the fiber. The minimum diameter obtained using this method is about 25 μm.
By following section 2, draw a tapered fiber, pulling till it breaks.
Follow all steps of section 1 (fabrication of UHQ microspheres) but in step 1.3, modify the values on the splicer controller as follows: arc power 20, arc duration 1,200 msec.
4. Coupling Light into the Microsphere
Note: We use the taper to couple light into the microsphere and measure the resonances of the microresonator.
4.1. Prepare a T shaped PVC/aluminum holder with a channel in the middle. Fix the residual fiber stem of the microsphere with a piece of scotch magic or paper adhesive tape into holder. Clamp the holder with two screws into a translation stage with piezoelectric actuators and a positioning resolution of 20 nm.
Fix the taper glued to the glass slide into another translation stage with the slide plane positioned perpendicular to the microsphere fiber stem. Splice the ends of the taper to terminated fiber cables. Connect one end to the tunable diode laser and the other one to an InGaAs photodiode detector.
- Use a microscope tube with long working distance (>20 mm) to control the gap between the taper and microsphere. In order to monitor the system in the other direction place a mirror at 45° with respect to the tube direction so that the position the taper relative to the equator of the microsphere can be controlled.
- Position the equator of the microsphere in contact with the tapered fiber.
- Turn on the laser and check the transmission spectrum of the microsphere-taper system in an oscilloscope.
- Tune the CW laser operating at 1,550 nm until resonances appear. The resonances can be identified as Lorentzian shaped dips in the spectrum.
Measure the resonance linewidth (full width half maximum of the Lorentzian shaped dip). Calculate the Q factor as the frequency of the pump divided by the resonance linewidth.
Reduce/increase the gap between the sphere and the taper, changing both resonance width and depth for increasing/decreasing the coupling efficiency.
5. Stimulated Raman Scattering
Insert an erbium doped fiber amplifier (EDFA) between the CW laser operating at 1,550 nm and the attenuator. The EDFA works in the wavelength range of 1,530-1,570 nm. Note: This will boost the laser power, reaching a maximum output power of 2 W. Nonlinear effects need high input powers. Figure 4 shows a sketch of the experimental set-up.
Connect one end of the taper with terminated fiber cables to a 3 dBm splitter. Connect one of the splitter output fibers to the optical spectrum analyzer and the other one to a photo detector that is connected to the oscilloscope.
Tune the laser from high to low frequencies until a resonance with a thermal drift comparable to the wavelength scan speed of the laser is found. When the thermal self-locking20 is achieved a broadening of the resonance can be seen on the oscilloscope.
Check the output power transmitted through the taper into an optical spectrum analyzer. Increase the power until the Raman laser line appears. It is detuned from the pump wavelength at about 13.5 THz.
Representative Results
The Q factors of the microspheres fabricated following the protocol described above are in excess of 108 (Figure 5) for large diameters (>200 μm) and in excess of 106 for small diameters (< 50 μm). Resonance contrast above 95% (close to critical coupling) can be easily observed. For high circulating intensities, the following nonlinear effects in the infrared region can be observed: stimulated Raman scattering (SRS), cascaded SRS21, stimulated anti-Stokes Raman scattering (SARS) and four wave mixing (FWM) and degenerated FWM. The Raman gain amplifies in equal way the light travelling in forward and backward direction, creating standing waves for SRS and cascaded SRS. FWM pairs are travelling waves. An example of measurements can be seen in Figures 6 and 7.
Figure 6 shows two SRS lines separated by 100 nm (1,608 nm and 1,708 nm) and in the vicinity of the pump a cascaded four-photon parametric process based on electronic Kerr nonlinearity of the medium, for a microsphere of about 50 μm of diameter, pumped at 1,546.6 nm. In this case FWM is degenerated, two photons of the pump generate a signal and idler photon. Similar results were obtained by pumping a microsphere of about 98 μm of diameter at 1,551 nm (Figure 7). Here, a Raman comb can be seen centered at 1,666.2 nm, and secondary lines can be seen in the vicinity of the pump with low efficiency (degenerated FWM). Also, the anti-Stokes line is centered at 1,451 nm, and two symmetric sidebands are separated by 10 nm. In this case, the pump and Stokes fields are sufficiently built-up, but the efficiency of SARS is hindered by the phase mismatch due to cross phase modulation (XPM) among the interactive fields (pump, stokes and anti-stokes). In the case of perfect phase matching, the Stokes and anti-Stokes components will mirror each other.
SARS is always detected in presence of SRS, and never in the absence of SRS, in agreement with the theory of Bloembergen and Shen22. SARS intensity is specially enhanced when SARS frequency is resonant with a cavity mode and phase matched with the pump and the SRS signal. Figure 8 is an example. It shows an SRS and SARS line separated by 90 nm (1,629 nm and 1,459 nm, respectively) and other SRS lines centered at 1,613.8 nm, 1,645.6 nm, 1,710 nm, 1,727.6 nm and 1,745.8 nm. Figure 9 shows a case of perfect phase matching for a microsphere of 65 μm diameter pumped at 1572 nm. The stokes line is centered at 1640 nm and the Antistokes is centered at 1490 nm (separation in frequency of about 347 cm-1).
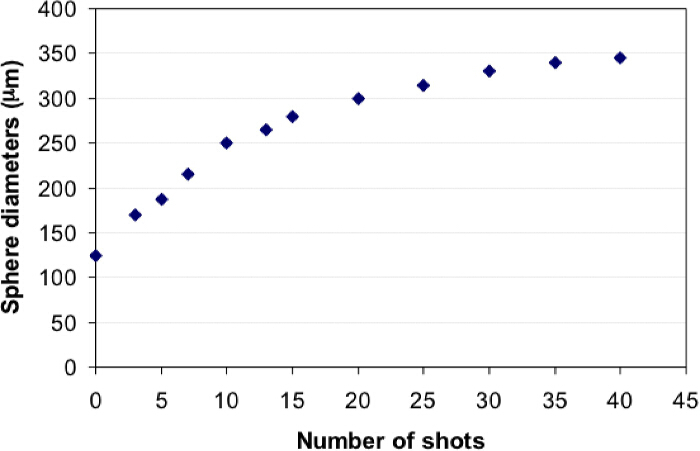 Figure 1. Microsphere dimensions. Size of the microspheres produced at the tip of a standard 125 μm telecom fiber, as a function of the arc shots in a fiber fusion splicer. This figure has been modified from [18]. Please click here to view a larger version of this figure.
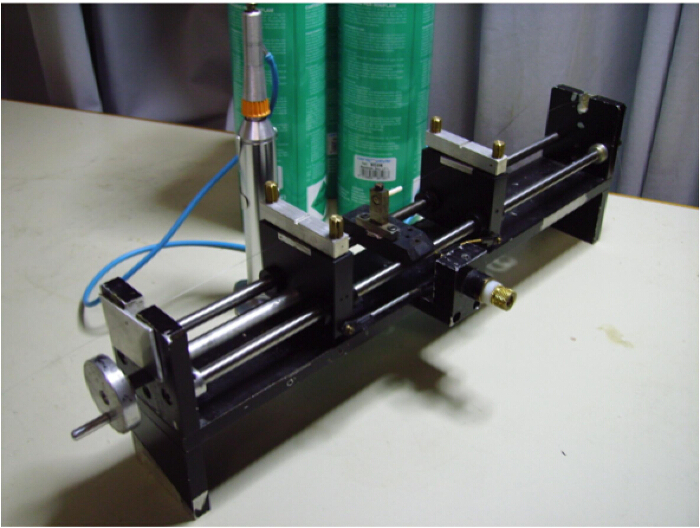 Figure 2. Drawing a taper fiber. Experimental set-up for drawing a tapered fiber. The fiber is held by two fiber clamps, which are located on a sliding block, on top of two rails. The structure is portable. On block is connected to a screw that pulls the fiber apart. Please click here to view a larger version of this figure.
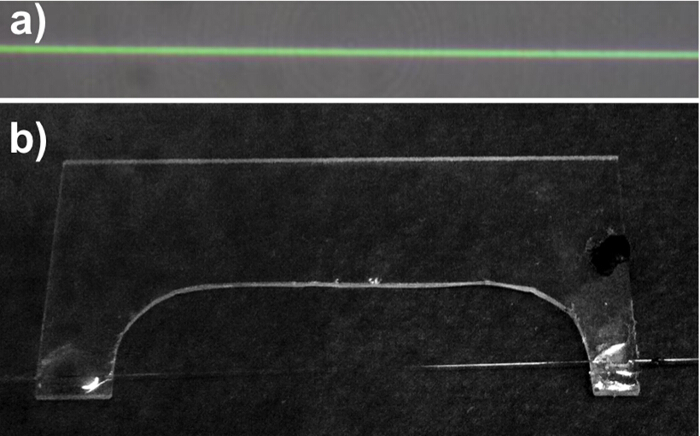 Figure 3. A taper fiber. (A) Optical micrograph of a taper waist. The green color is due to interference effects, and its homogeneity indicates the homogeneity in thickness along the tapered section. (B) The taper glued to its U-shaped glass support. Please click here to view a larger version of this figure.
 Figure 4. Experimental set-up: the signal from a tunable diode laser (TDL) is amplified by an EDFA and, after passing an attenuator and a polarizer, is launched into the WGMR by means of a tapered fiber. The output signal is split and sent into an optical spectrum analyzer (OSA) and to a photodiode to monitor the signal into an oscilloscope. Please click here to view a larger version of this figure.
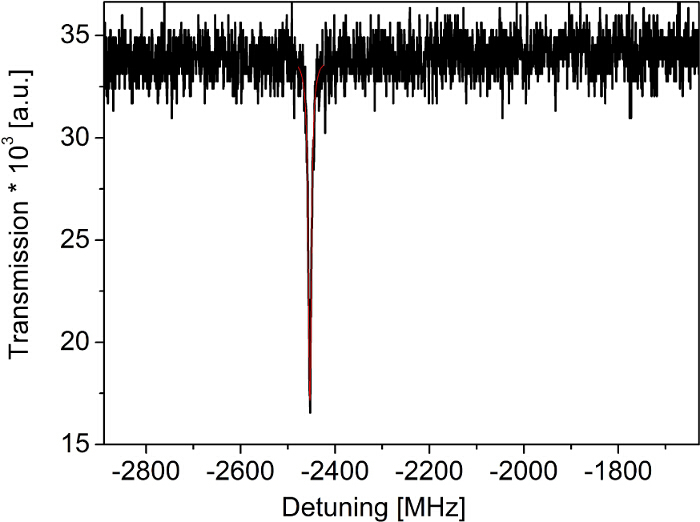 Figure 5. Resonances. WGM resonance of a silica sphere with a diameter of 250 μm coupled to a 4 μm waist tapered fiber. Red line is the best fit using a Lorentz function. Please click here to view a larger version of this figure.
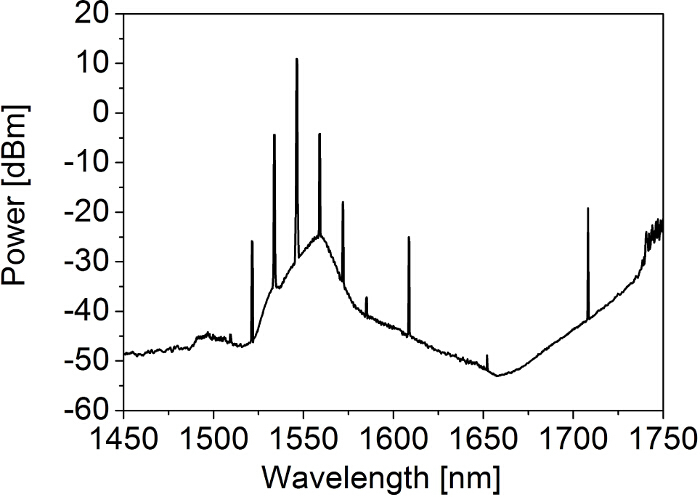 Figure 6. Nonlinear spectrum of small microspheres. Experimental spectrum of FWM and cascaded Raman lines in a microsphere of 50 μm diameter. The pump is the peak at 1,546.6 nm, cascaded FWM peaks are the symmetrical lines that appear close to the pump (separation of 13 nm), whereas cascaded Raman lines separated at about 13.5 THz (or about 100 nm) from the pump and from themselves (1,608 nm first line, 1,708 nm second line). Please click here to view a larger version of this figure.
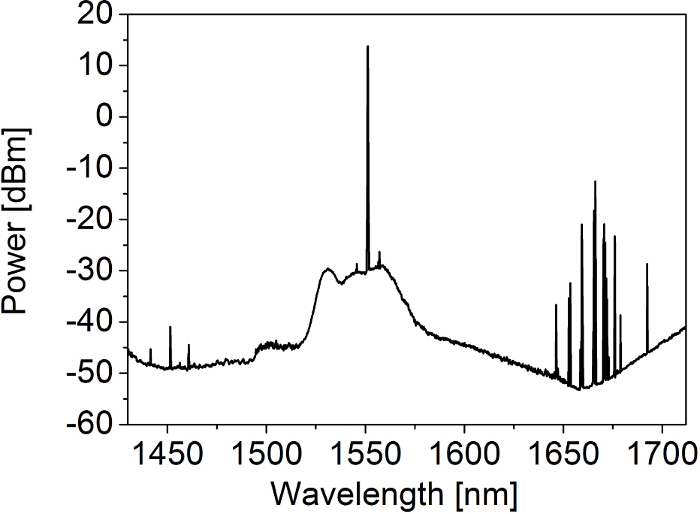 Figure 7. Nonlinear spectrum of ultrahigh Q microspheres. Experimental spectrum of SARS, FWM in the vicinity of the pump and SRS comb in a microsphere of 98 μm diameter. The pump is the peak centered at 1,551 nm, degenerated FWM is seen close to pump. The SRS line separated by 100 nm is centered at 1,646 nm and the corresponding SARS is centered at 1,451.5 nm. The two symmetric lines in the vicinity of the SARS line are degenerated FWM. The Raman comb is centered at 1,666.2 nm. Please click here to view a larger version of this figure.
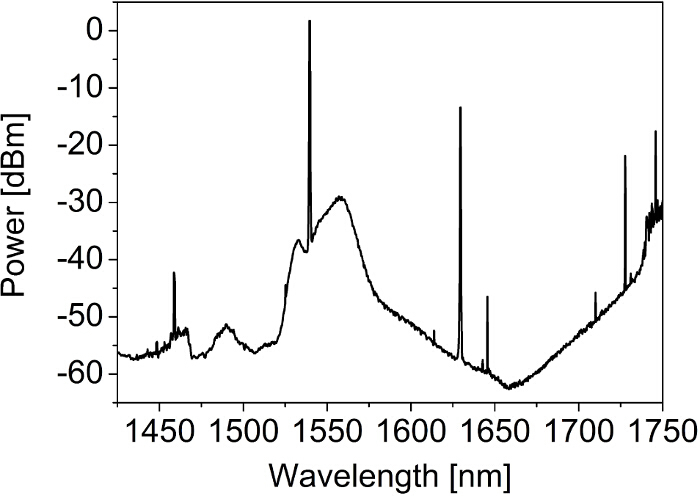 Figure 8. Cavity enhanced SARS Spectrum. Experimental spectrum of SARS in a microsphere of 40 µm diameter. The pump is centered at 1,539.4 nm, the SRS line is centered at 1,629.6 nm and the corresponding SARS is centered at 1,459 nm. The other SRS lines are centered at 1,613.8 nm, 1,645.6 nm, 1,710 nm, 1,727.6 nm and 1,745.8 nm. Please click here to view a larger version of this figure.
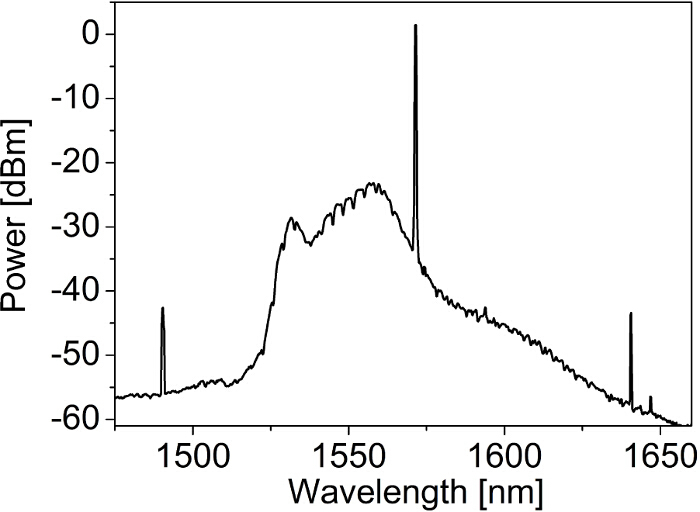 Figure 9. Perfect Phase Matched SRS-SARS. Experimental spectrum of SARS and SRS perfectly phase matched with a SARS-SRS intensity ratio close to 1. The microsphere diameter is 65 μm. Please click here to view a larger version of this figure.
Discussion
Microspheres are compact and efficient nonlinear oscillators and they are very easy to fabricate and handle. Tapered fibers can be used for coupling and extracting the light in/from the resonator. Resonance contrast up to 95% and Q factors of about 3 x 10⁸ can be obtained.
The main limitation of these fabrication techniques is mass production and integration. Cleanliness of the fibers is critical to both microspheres and tapers, and so is humidity. Both devices must be kept in dry environment for a long lasting laboratory life. Very thin tapers are fragile; great care should be taken when coupling. Regarding the Q factor, the microsphere size can be critical. In microspheres with diameters ranging from 50 to 500 μm, Q's in excess of 1010 have been demonstrated in vacuum23. The intrinsic Q of a microsphere is determined by contributions from several types of losses: intrinsic curvature losses (Qrad), Raman Scattering and Rayleigh scattering losses on residual surface inhomogeneity (the latter are size dependent, the lower the diameter the higher the losses22), intrinsic material losses, and losses introduced by surface contaminants. Qrad-1 vanishes with increasing size: it decreases faster than R-5/2.24 Our microspheres that range from diameters of 25 to 250 μm have Q factors several magnitudes below the ultimate vacuum value of Q. The Q factors obtained ranged from 5 x 10⁶ up to 3 x 10⁸.
Other methods used for fabrication of microspheres involve the use of CO2 or butane/N2O torch. In all procedures, the surface tension will draw the melted silica into a spheroid. Here, the choice of the instrument for melting the fiber is only economical. CO2 lasers are expensive, torches or splicers are present in all labs using fibers. Tapers could also be fabricated by hydrofluoric acid (HF) erosion of the glass cladding and core. This method is extremely long; about 5 hours are needed for thinning a 125 μm fiber to a 4 μm taper. Another drawback is the lack of adiabaticity, HF will erode all glass at the same rate.
Tapers should show low losses; otherwise it will be difficult to observe nonlinear effects. Coupling efficiency is also very important. The gap between the taper and the microsphere will determine the coupling regime. By direct change of the gap, and/or slight detuning from the resonance, the nonlinear effect can be either enhanced or decreased.
WGMR can pave the way to non-classical light generation for quantum computing applications. Atoms can be trapped near their surfaces for quantum electrodynamics experiments and taper fibers will allow an efficient transport in challenging environments. SRS and SARS can be used as radiation for spectroscopic measurements and also for active sensing as it has been recently proved25.
Disclosures
The authors declare that they have no competing financial interests. D.F. is a PhD student at the University of Parma.
Acknowledgments
Museo Storico della Fisica e Centro Studi e Ricerche Enrico Fermi
Ente Cassa di Risparmio di Firenze (No. 2014.0770A2202.8861)
References
- Kozyreff G, Dominguez-Juarez JL, Martorell J. Non linear optics in spheres: from second harmonic scattering to quasi-phase matched generation in whispering gallery modes. Laser Photon. Rev. 2011;5(6) [Google Scholar]
- Farnesi D, Barucci A, Righini GC, Berneschi S, Soria S, Nunzi Conti G. Optical frequency generation in silica microspheres. Phys. Rev. Lett. 2014;112(9):093901. doi: 10.1103/PhysRevLett.112.093901. [DOI] [PubMed] [Google Scholar]
- Liang W, et al. Miniature multioctave light source based on a monolithic microcavity. Optica. 2015;2(1):40–47. [Google Scholar]
- Maker AJ, Armani AM. Fabrication of Silica Ultra High Quality Factor Microresonators. J. Vis. Exp. 2012. p. e4164. [DOI] [PMC free article] [PubMed]
- Coillet A, Henriet R, Phan Huy K, Jacquot M, Furfaro L, Balakireva I, et al. Microwave Photonics Systems Based on Whispering-gallery-mode Resonators. J. Vis. Exp. 2013. p. e50423. [DOI] [PMC free article] [PubMed]
- Han K, Kim KH, Kim J, Lee W, Liu J, Fan X, et al. Fabrication and Testing of Microfluidic Optomechanical Oscillators. J. Vis. Exp. 2014. p. e51497. [DOI] [PMC free article] [PubMed]
- Arnold S. Microspheres, Photonic Atoms, and the Physics of Nothing. American Scientist. 2001;89(5):414–421. [Google Scholar]
- Chiasera A, et al. Spherical whispering gallery mode microresonators. Laser Photon. Rev. 2010;4(3):457–482. [Google Scholar]
- Helt LG, Liscidini M, Sipe JE. How does it scale? Comparing quantum and classical nonlinear optical processes in integrated devices. J. Opt. Soc. Am. B. 2012;29(8):2199–2212. [Google Scholar]
- Leach DH, Chang RK, Acker WP. Stimulated anti-Stokes Raman scattering in microdroplets. Opt. Lett. 1992;17(6):387–389. doi: 10.1364/ol.17.000387. [DOI] [PubMed] [Google Scholar]
- Farnesi D, Cosi F, Trono C, Righini GC, Nunzi Conti G, Soria S. Stimulated Antistokes Raman scattering resonantly enhanced in silica microspheres. Opt. Lett. 2014;39(20):5993–5996. doi: 10.1364/OL.39.005993. [DOI] [PubMed] [Google Scholar]
- Qian SX, Chang RK. Multiorder Stokes emission from micrometer size droplets. Phys. Rev. Lett. 1986;56(9):926–929. doi: 10.1103/PhysRevLett.56.926. [DOI] [PubMed] [Google Scholar]
- Lin HB, Campillo AJ. CW nonlinear optics in droplet microcavities displaying enhanced gain. Phys. Rev. Lett. 1994;73(18):2440–2443. doi: 10.1103/PhysRevLett.73.2440. [DOI] [PubMed] [Google Scholar]
- Spillane SM, Kippenberg TJ, Vahala KJ. Ultralow threshold Raman laser using a spherical dielectric microcavity. Nature. 2002;415(6872):621–623. doi: 10.1038/415621a. [DOI] [PubMed] [Google Scholar]
- Kippenberg TJ, Spillane SM, Vahala KJ. Kerr-Nonlinearity optical parametrical oscillation in an ultrahigh Q toroid microcavity. Phys. Rev. Lett. 2004;93(8):083904. doi: 10.1103/PhysRevLett.93.083904. [DOI] [PubMed] [Google Scholar]
- Hill SC, Leach DH, Chang RK. Third order sum frequency generation in droplets: model with numerical results for third-harmonic generation. J. Opt. Soc. Am. B. 1993;10(1):16–33. [Google Scholar]
- Kozyreff G, Dominguez Juarez JL, Martorell J. Whispering gallery mode phase matching for surface second order nonlinear optical processes in spherical microresonators. Phys. Rev. A. 2008;77(4):043817. [Google Scholar]
- Jouravlev MV, Kurizki G. Unified theory of Raman and parametric amplification in nonlinear microspheres. Phys. Rev. A. 2004;70(5):053804. [Google Scholar]
- Brenci M, Calzolai R, Cosi F, Nunzi Conti G, Pelli S, Righini GC. Microspherical resonators for biophotonic sensors. Proc. SPIE. 2006;6158:61580S. [Google Scholar]
- Carmon T, Yang L, Vahala KJ. Dynamical thermal behavior and thermal self-stability of microcavities. Opt. Express. 2004;12(20):4742–4750. doi: 10.1364/opex.12.004742. [DOI] [PubMed] [Google Scholar]
- Kippenberg TJ, Spillane SM, Min B, Vahala KJ. Theoretical and experimental study of stimulated and cascaded Raman scattering in ultrahigh Q optical microcavities. J. Sel. Quantum Electron. 2004;10(5):1219–1228. [Google Scholar]
- Bloembergen N, Shen YR. Coupling between vibrations and light waves in Raman laser media. Phys. Rev. Lett. 1964;12(18):504–507. [Google Scholar]
- Gorodestky ML, Pryamikov AD, Ilchenko VS. Rayleigh scattering in high Q microspheres. J. Opt. Soc. Am. B. 2000;17(6):1051–1057. [Google Scholar]
- Arnold S, Ramjit R, Keng D, Kolchenko V, Teraoka I. Microparticle photophysics illuminates viral bio-sensing. Faraday Discuss. 2008;137:65–83. doi: 10.1039/b702920a. [DOI] [PubMed] [Google Scholar]
- Ozdemir SK, et al. Highly sensitive detection of nanoparticle with a self referenced and self-heterodyned whispering gallery Raman microlaser. Proc. Natl. Acad. Sci USA. 2014;11(37):E3836–E3844. doi: 10.1073/pnas.1408283111. [DOI] [PMC free article] [PubMed] [Google Scholar]


