Abstract
Perturbed mitochondrial metabolism has received renewed interest as playing a causative role in a range of diseases. Probing alterations to metabolic pathways requires a model in which external factors can be well controlled, allowing for reproducible and meaningful results. Many studies employ transformed cellular models for these purposes; however, metabolic reprogramming that occurs in many cancer cell lines may introduce confounding variables. For this reason primary cells are desirable, though attaining adequate biomass for metabolic studies can be challenging. Here we show that human platelets can be utilized as a platform to carry out metabolic studies in combination with liquid chromatography-tandem mass spectrometry analysis. This approach is amenable to relative quantification and isotopic labeling to probe the activity of specific metabolic pathways. Availability of platelets from individual donors or from blood banks makes this model system applicable to clinical studies and feasible to scale up. Here we utilize isolated platelets to confirm previously identified compensatory metabolic shifts in response to the complex I inhibitor rotenone. More specifically, a decrease in glycolysis is accompanied by an increase in fatty acid oxidation to maintain acetyl-CoA levels. Our results show that platelets can be used as an easily accessible and medically relevant model to probe the effects of xenobiotics on cellular metabolism.
Keywords: Environmental Sciences, Issue 110, Metabolism, isotopic tracers, platelets, mass spectrometry, mitochondria, rotenone, xenobiotics
Introduction
Dysfunctional mitochondrial metabolism has been implicated in a wide range of diseases including neurodegeneration, cancer, and cardiovascular disease 30. As such, great effort has been placed on characterizing metabolic defects that contribute to disease pathogenesis. Liquid chromatography-tandem mass spectrometry (LC-MS/MS) is considered the gold standard for quantification of analytes from complex biological matrices and is often employed for metabolic studies 8. However, as is often the case with biomedical studies, attaining an accessible and well-defined model relevant to human disease is a challenge.
Many studies employ transformed cellular models for probing the impact of xenobiotics or genetic abnormalities on cellular metabolism 7,9. The metabolic reprogramming that occurs in cancer cells can introduce confounding factors 21 and are therefore not ideal. These issues can be circumvented with primary cell models, although obtaining sufficient biomass for metabolic analyses can be challenging. Furthermore, the impact of high amounts of antibiotics used in culture has been highlighted as potentially confounding mitochondrial studies 16.
Human platelets afford the opportunity to utilize a primary cell model with sufficient mitochondrial content for metabolic studies 5,22,27,32. First, platelets can be easily acquired, through blood draws from individual donors, or in large volumes from blood banks, and therefore provide a model in which external factors can be readily controlled. Secondly, due to their small size, platelets can be easily isolated from other blood components with minimal preparatory work in even minimally equipped laboratories 5. Of note, platelets do not contain nuclei and can therefore be used to study alterations to metabolism independently of transcriptional regulation. Here we show that in addition to relative quantification of acyl-coenzyme A (CoA) thioesters, the isolated platelet system can be used to examine carbon metabolism. Specifically, we report the use of metabolic labeling with stable isotope (non-radioactive) labeled [13C6]-glucose and [13C16]-palmitate to probe incorporation of the [13C]-label into the important metabolite acetyl-CoA via glycolysis or fatty acid oxidation. This provides a powerful, generalizable, and versatile platform due to the extensive involvement of acyl-CoA species in biochemical pathways 13,24 and the tractability of this system to testing other variables, such as inhibition of complex I with rotenone 3,33. In addition to information provided in the Protocol below, an extensive description of the methods used for isotope labeling and for the LC-MS-based analyses can be found in Basu and Blair 4.
Protocol
Ethics Statement: All protocols concerning the treatment of human samples follow the guidelines of The University of Pennsylvania's human research ethics committee.
1. Preparation of Buffers and 100x Stock Solutions
Prepare 1 L of base Tyrode's buffer. Combine 8.123 g NaCl, 1.428 g NaHCO3, 0.466 g CaCl2∙2 H2O, 0.224 g KCl, and 0.095 g MgCl2. Adjust total volume to 1 L with ddH2O. Filter sterilize base Tyrode's buffer.
Prepare 100x stock solutions of glucose and palmitic acid. For 100x glucose stock solutions, dissolve 100 mg glucose or [13C6]-glucose in 1 ml of ddH2O. For 100x palmitate solutions, dissolve 2.56 mg of palmitic acid or 2.72 mg of [13C16]-palmitic acid in 1 ml of ethanol. Filter sterilize 100x stock solutions.
- Prepare Appropriate Enriched Tyrode's Buffers
- For non-labeling studies, add 1 ml of 100x glucose stock solution and 1 ml of 100x palmitic acid stock solution to 98 ml of base Tyrode's buffer.
- For glucose labeling studies, add 1 ml of 100x [13C6]-glucose stock solution and 1 ml of 100x palmitic acid stock solution to 98 ml of base Tyrode's buffer.
- For palmitic acid labeling studies, add 1 ml of 100x glucose stock solution and 1 ml of [13C16]-palmitic acid stock solution to 98 ml of base Tyrode's buffer.
- Prepare Solutions for Rotenone Treatment
- Prepare a 10 mM stock solution of rotenone in dimethyl sulfoxide (DMSO).
- For non-labeling dose-response studies, proceed to 1.4.3. For labeling studies at a single dose, proceed to 1.4.5.
- Perform a serial dilution of the 10 mM rotenone stock in DMSO to obtain solutions with rotenone concentrations ranging from 1 nM to 100 µM. These are 100x stocks.
- Add 50 µl of each stock to 5 ml of base Tyrode's buffer + glucose + palmitic acid from 1.3.1 to prepare solutions with rotenone concentrations ranging from 10 pM to 1 µM. Alternatively, add 50 µl of DMSO to serve as a vehicle control. Proceed to 2.1.
- Dilute the 10 mM stock solution 1,000-fold in DMSO to obtain a 10 µM working solution.
- Add 50 µl of this stock to 5 ml each of base Tyrode's buffer + [13C6]-glucose + palmitic acid from 1.3.2 and base Tyrode's buffer + glucose + [13C16]-palmitic acid from 1.3.3. The final concentration is 100 nM rotenone. Alternatively, add 50 µl of DMSO to each buffer to serve as vehicle controls.
2. Platelet Isolation
Note: This method is amenable to platelets derived from either whole blood or from platelet bags. The example data contained herein was prepared using platelets derived from platelet bags. Please see Basu et al.5 for more details regarding using platelets isolated from whole blood.
- Platelet Isolation from Whole Blood NOTE: If isolating platelets from a bag of platelets, proceed to 2.2.1.
- Centrifuge whole blood at 175 x g for 15 min with no brakes.
- Transfer 1 ml of the upper platelet-rich plasma (PRP) layer to a 1.5 ml microcentrifuge tube.
- Centrifuge the PRP at 400 x g for 5 min.
- Aspirate supernatant and proceed to step 3.1 or 3.2.
- Platelet Isolation from a Platelet Bag
- Transfer 1 ml of the platelet suspension to a 1.5 ml microcentrifuge tube.
- Centrifuge the suspension at 400 x g for 5 min.
- Aspirate supernatant and proceed to step 3.1. or 3.2.
3. Performing an Experiment
- To determine the effect of xenobiotic treatment (e.g., rotenone) on the levels of a metabolite of interest (e.g., acetyl-CoA), proceed to 3.1.1. To determine the effect of a xenobiotic (e.g., rotenone) on the incorporation of a metabolic precursor into a downstream metabolite of interest, proceed to 3.2.1.
- Using no fewer than three biological replicates for each condition, resuspend platelet pellet from step 2.1.4 or 2.2.3 in 1 ml of each solution from step 1.4.4.
- Incubate resuspended platelets in a water-jacketed CO2 incubator set to 95% humidity, 5% CO2 and 37 °C for 1 hr. Proceed to step 4.1 Note: Here we describe a dose response experiment. Alternatively, a time course experiment could be done in which the dose was fixed and the length of incubation was varied instead.
- To determine the effect of xenobiotic treatment on incorporation of a metabolic precursor into a downstream metabolite of interest.
- Using no fewer than three biological replicates for each condition, resuspend platelet pellet from step 2.1.4 or 2.2.3 in 1ml of each formulation of labeled Tyrode's buffer from step 1.4.6.
- Incubate resuspended platelets in a water-jacketed CO2 incubator set to 95% humidity, 5% CO2 and 37 °C for 1 hr. Proceed to step 4.1.
4. Quenching and CoA Extraction
Pellet platelets by centrifuging at 3,000 x g for 3 min.
Aspirate supernatant.
Resuspend platelets in 750 µl ice cold 10% trichloroacetic acid (w/v).
Add appropriate stable isotope-labeled internal standard. For example, if the goal is to compare the levels of CoA species across samples, use 100 µl of a mixture of stable-isotope labeled CoA thioesters obtained from yeast as described previously (SILEC technique) 29.
Pulse-sonicate each sample 30 times with 0.5 sec pulses.
Centrifuge samples at 16,000 x g for 10 min at 4 °C.
Affix C18 solid-phase extraction (SPE) columns to vacuum manifold.
Condition the columns with 1 ml methanol.
Equilibrate the columns with 1 ml ddH2O.
Run sample-derived supernatant (approximately 850 µl in this case) through the columns.
Wash the columns with 1 ml water.
Load 10 ml glass centrifuge tubes into the vacuum manifold to collect elution fraction.
Elute the columns with 1 ml of 25 mM ammonium acetate in methanol.
Dry eluate under nitrogen gas.
Resuspend dried residues in 50 µl 5% (w/v) 5-sulfosalicylic acid and transfer into HPLC vials.
5. HPLC Setup
Using the control software for the HPLC system, create a method with HPLC conditions optimized for the target analytes and utilized column, as listed in Table 1. Note: The column temperature used for the generation of this data was 25 °C but the specific parameters will vary by instrument and with respect to the compounds of interest. For acyl-CoA quantitation, multiple methods of LC-MS analysis have been reported, and validated for different analytes in different LC conditions 14,19,20.
Allow the HPLC to Adequately Equilibrate. Note: This should include both priming of solvents before attaching a column and equilibration of the column at the starting solvent conditions for the method. The equilibration volume should follow the manufacturer's directions, and resulting effluent should be diverted to waste. Note: Consult Basu and Blair 5 for more details regarding the HPLC settings.
6. Mass Spectrometer Setup
Using the control software for the mass spectrometer, create a targeted method for detection of ionized forms of the compounds of interest. Parameters are presented in Table 2. Note: Stable isotope analogues of these compounds should be used to determine whether a positive or negative mode gives superior sensitivity and to optimize the source and optics condition for their detection. The total detection time of the mass spectrometer method should correspond to the time component of the associated HPLC method. Note: As previously mentioned, multiple methods of acyl-CoA analysis have been reported, including positive 14 and negative ionization 15 modes and use of a high resolution mass spectrometer 17 rather than a triple quadrupole instrument 28.
Clean and calibrate the instrument, establish a stable spray into the spectrometer, and allow time for the calibration solution to adequately dissipate from the source and optics according to manufacturer's instructions.
Set up a sequence for all the samples with the mass spectrometer control software. Include the name or numerical identifiers and indicate the appropriate injection volume and instrument method. Run a blank before the first sample, and run other blanks and washes between samples as needed to mitigate carryover or matrix effects. Note: A processing method for peak integration of selected analytes' liquid chromatograms can often be set within this sequence or subsequently applied in data processing.
Begin the sequence and monitor the mass spectrometer and HPLC system periodically for problems including pressure fluctuations or system failures and loss of signal intensity during the run. Note: Severe problems or persistent run failures may require stopping the run and purging and re-equilibrating the HPLC system as well as cleaning and calibrating the mass spectrometer. Consult Basu and Blair 5 for more details regarding the MS settings and data processing.
Representative Results
To demonstrate the utility of this methodology we have reproduced the generalizability of previously described compensatory metabolic adaptation resulting from exposure to rotenone. This finding was previously identified in cell culture models and this investigation was aimed to test if this metabolic shift also occurs in platelets, which are anuclear and not prone to the same experimental artifacts as cell culture. This work was performed with 6-day-old platelets from the Penn Trauma Center, which had been deemed too old for human infusion, although they retained their metabolic activity. The isolation was performed as shown in Figure 1. The total workflow can be scaled easily from a limited number of clinical samples or experimental conditions to 96-well plate based higher throughput with the availability of platelets that are no longer useful for infusion into patients.
Our group has previously reported changes in relative levels of acyl-CoA thioesters in response to rotenone in cell lines that are hypothesized to result from the inhibition of complex I (Figure 2). Specifically we have observed in SH-SY5Y cells a dose dependent decrease in succinyl-CoA (IC50 = 25 nM) with a simultaneous increase in β-hydroxybutyryl (HB)-CoA (ED50 = 75 nM), while acetyl-CoA levels were unchanged 1. Our analysis of human platelets treated with rotenone revealed highly consistent results (Figure 3). This provides a unique set of experimental data in human platelets pointing to the mitochondrial dependence of the response to rotenone. This response cannot be mediated through conventional transcriptional mechanisms because platelets lack nuclei.
Relative quantification provides one dimension of metabolic information, but isotopic labeling provides invaluable complementary insight into the activity of specific metabolic pathways. This is critical in metabolic studies because multiple pathways may converge through a single intermediate. To demonstrate this point, platelets were treated with either 100 nM rotenone or DMSO in the presence of either [13C6]-glucose or [13C16]-palmitate for 1 hr. Co-elution of isotopologues of acyl-CoAs from the LC column allows for definitive determination of isotopic composition of analytes (Figure 4). Following correction for the natural abundance of heavy isotopes as described 11 this approach showed a significant decrease in glycolytic production of acetyl-CoA in the platelets while palmitate incorporation was increased significantly (Figure 5). These findings are similar to those observed previously in the SH-SY5Y cell culture model 33 and so provide additional evidence that this pathway could be important in vivo.
| Time (min) | 0 | 0 | 1.5 | 5 | 12 | 17 | 18 | 23 | 25 | 30 |
| Total Flow (μl/min) | 200 | 200 | 200 | 200 | 200 | 250 | 200 | 200 | 200 | 200 |
| % A | 98 | 98 | 98 | 80 | 0 | 0 | 0 | 0 | 98 | 98 |
| % B | 2 | 2 | 2 | 20 | 100 | 100 | 0 | 0 | 2 | 2 |
| % C | 0 | 0 | 0 | 0 | 0 | 0 | 100 | 100 | 0 | 0 |
Table 1. Liquid Chromatography Gradient. Solvent A: 5 mM Ammonium Acetate in Water, Solvent B: 5 mM Ammonium Acetate in 95:5 ACN/Water Solvent C: 80:20 ACN/Water 0.1% Formic Acid
| Parameter | Value |
| Spray Voltage (V) | 4,000 |
| Vaporizer Temperature (°C) | 400 |
| Sheath Gas Pressure | 35 |
| Auxiliary Gas Pressure | 10 |
| Capillary Temperature (°C) | 350 |
| Tube Lens Offset (V) | 100 |
Table 2. Mass Spectrometer Parameters.
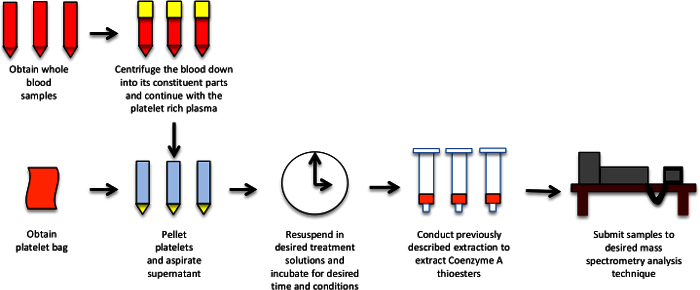 Figure 1. Generalized Workflow for Sample Preparation and Analysis. This schematic depicts the workflow for platelet isolation and treatment for metabolic studies by LC-MS/MS analysis. Please click here to view a larger version of this figure.
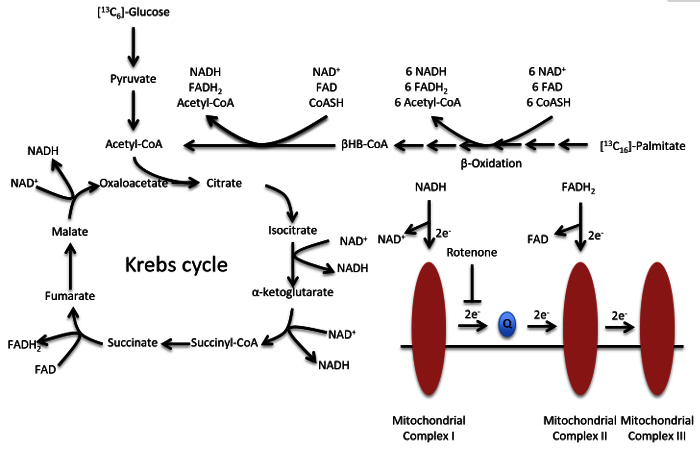 Figure 2. Metabolic Scheme of Glucose and Lipid Metabolism and the Electron Transport Chain. Acetyl-CoA can be synthesized from either glucose or palmitate. Rotenone inhibits the proper shuttling of electrons by mitochondrial complex I. Please click here to view a larger version of this figure.
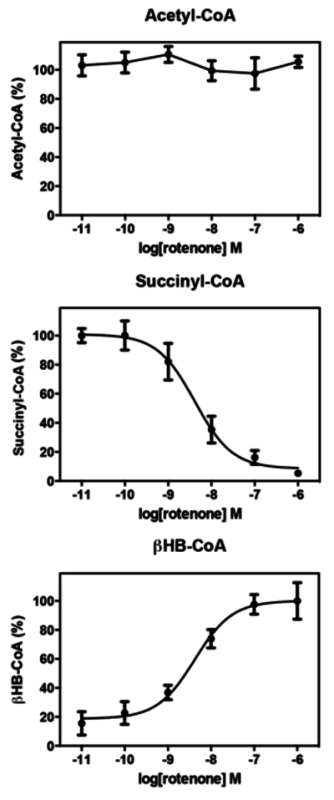 Figure 3. Quantitation of CoA-thioesters in Response to Rotenone. Rotenone treatment does not affect acetyl-CoA levels but induces a dose-dependent decrease in succinyl-CoA (IC50 = 4.1 nM) with a concomitant increase in βHB-CoA (ED50 = 4.2 nM). Error bars represent standard error of the mean (SEM); n = 4. Please click here to view a larger version of this figure.
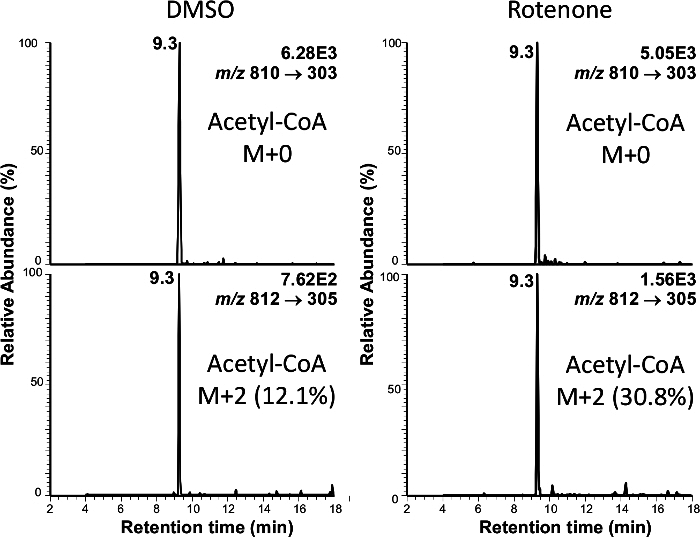 Figure 4. Representative Chromatograms Showing Isotopic Labeling from Palmitate into Acetyl-CoA. Rotenone treatment increases the incorporation of palmitate into acetyl-CoA. Please click here to view a larger version of this figure.
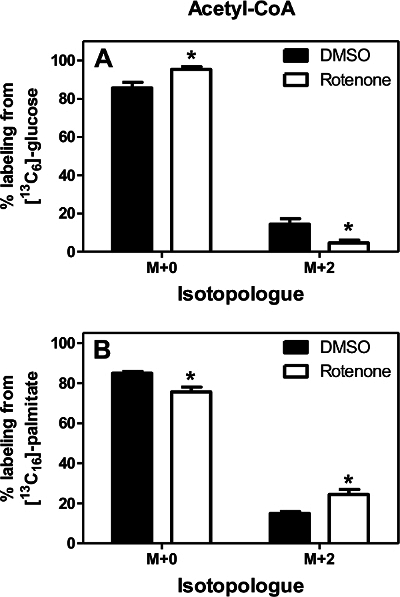 Figure 5. Relative Incorporation of [13C6]-glucose or [13C16]-palmitate into Acetyl-CoA. Rotenone treatment decreases glucose incorporation into acetyl-CoA and increases palmitate incorporation. Error bars represent SEM; n = 4. Asterisks denote p <0.05 (Student's unpaired t-test). Please click here to view a larger version of this figure.
Discussion
Here we have shown the utility of isolated platelets as a platform for studying perturbed mitochondrial metabolism. Specifically, we have characterized metabolic adaptation in response to complex I inhibition by rotenone.
The present study has extended previously reported findings on the role of complex I inhibition by rotenone in cell lines to human platelets. Importantly, this has revealed that rotenone also inhibited platelet succinyl-CoA formation, stimulated an increase in platelet βHB-CoA and had no effect on platelet levels of acetyl-CoA.
Great care must be taken to ensure the validity and reproducibility of any analysis of this type. If platelets are to be isolated from whole blood, the isolation should proceed exactly as described above in order to prevent lymphocyte contamination and platelet activation, with special attention devoted to leaving the buffy coat containing the lymphocytes undisturbed. In order for dose response curves to be meaningful, serial dilutions must be performed precisely, with mixing to homogeneity at each step. After platelet resuspension, incubation conditions may be modified from those detailed above, but they must be rigorously standardized across treatment groups to allow for meaningful comparisons to be made. Perhaps the most important step in any quantitative LC/MS-based analysis is the use of stable-isotope labeled internal standards.
The use of internal standards is critical in this setting because it protects against potentially confounding "batch effects" such as variable extraction efficiencies and analyte stability across samples. Addition of the internal standard, (again, mixing to homogeneity) as early as possible in an experimental protocol reduces the potential for artifacts. Finally, as in any experiment, the use of multiple replicates for each experimental condition is essential, and if feasible, power calculations based on pilot experiments may be useful.
Platelets can be rapidly isolated from individual or pooled sources 5,27,32, making this approach amenable to a wide range of applications. It is important to note that the ability to perform studies involving both relative quantification and isotopic labeling allows for a more comprehensive characterization of a metabolic system. Currently, this demands two separate assays, which increases the demand for biomass required for the experiment. For this reason, platelets, which can be readily obtained in large numbers, are more efficient than other cell culture models.
However, despite the numerous advantages conferred by the use of platelets, there are drawbacks. First, care must be taken in the selection of human donors because there are many disorders that affect platelet physiology 25. In addition, platelet activation during the course of sample preparation and analysis is a potential confounding variable in any platelet-based assay. For these reasons, concomitant assessment of markers of platelet activation by ELISA 26, flow cytometry 1, or assays such as the light transmission aggregometry (LTA) assay 34 could prove prudent.
Although the present study has focused on the analysis of acyl-CoA thioesters, this approach can be readily expanded to include a wider range of analytes. Untargeted metabolomics approaches are providing mechanistic insight into an array of disease states 23. Applying such untargeted approaches to platelet models will likely provide additional insight into the underlying biochemical mechanisms involved in dysregulated cellular metabolism.
This approach can be readily expanded to include investigations of other environmental chemicals and drugs known to interfere with mitochondrial metabolism 6,12,18,31 as well as a system to test the effects of xenobiotics as potential modulators of CoA metabolism 10. In addition, the general approach can be employed to study metabolic defects in genetic diseases such as Friedreich's ataxia 5,32. Moreover, any of the aforementioned experimental designs could be coupled with a functional respiration assay in order to more robustly characterize the state of mitochondria in each context 2. Thus, coupling stable isotopes and LC-MS analysis with metabolic studies in isolated platelets is likely to afford novel opportunities to further characterize aberrant mitochondrial metabolism.
Disclosures
The authors declare no competing financial interests.
Acknowledgments
We acknowledge the support of NIH grants P30ES013508 and T32ES019851.
References
- Ault KA. The clinical utility of flow cytometry in the study of platelets. Semin. Hematol. 2001;38(2):160–168. doi: 10.1016/s0037-1963(01)90049-6. [DOI] [PubMed] [Google Scholar]
- Avila C, et al. Platelet mitochondrial dysfunction is evident in type 2 diabetes in association with modifications of mitochondrial anti-oxidant stress proteins. Exp. Clin. Endocrinol. Diabetes. 2012;120(4):248–251. doi: 10.1055/s-0031-1285833. [DOI] [PMC free article] [PubMed] [Google Scholar]
- Basu SS, Blair IA. Rotenone-mediated changes in intracellular coenzyme A thioester levels: implications for mitochondrial dysfunction. Chem. Res. Toxicol. 2011;24(10):1630–1632. doi: 10.1021/tx200366j. [DOI] [PMC free article] [PubMed] [Google Scholar]
- Basu SS, Blair IA. SILEC: a protocol for generating and using isotopically labeled coenzyme A mass spectrometry standards. Nat. Protoc. 2012;7(1):1–12. doi: 10.1038/nprot.2011.421. [DOI] [PMC free article] [PubMed] [Google Scholar]
- Basu SS, Deutsch EC, Schmaier AA, Lynch DR, Blair IA. Human platelets as a platform to monitor metabolic biomarkers using stable isotopes and LC-MS. Bioanalysis. 2013;5(24):3009–3021. doi: 10.4155/bio.13.269. [DOI] [PMC free article] [PubMed] [Google Scholar]
- Berson A, et al. Mechanisms for experimental buprenorphine hepatotoxicity: major role of mitochondrial dysfunction versus metabolic activation. J. Hepatol. 2001;34(2):261–269. doi: 10.1016/s0168-8278(00)00050-7. [DOI] [PubMed] [Google Scholar]
- Castell JV, Jover R, Martinez-Jimenez CP, Gomez-Lechon MJ. Hepatocyte cell lines: their use, scope and limitations in drug metabolism studies. Expert. Opin. Drug Metab Toxicol. 2006;2(2):183–212. doi: 10.1517/17425255.2.2.183. [DOI] [PubMed] [Google Scholar]
- Ciccimaro E, Blair IA. Stable-isotope dilution LC-MS for quantitative biomarker analysis. Bioanalysis. 2010;2(2):311–341. doi: 10.4155/bio.09.185. [DOI] [PMC free article] [PubMed] [Google Scholar]
- Dang CV. Links between metabolism and cancer. Genes Dev. 2012;26(9):877–890. doi: 10.1101/gad.189365.112. [DOI] [PMC free article] [PubMed] [Google Scholar]
- Darnell M, Weidolf L. Metabolism of xenobiotic carboxylic acids: focus on coenzyme A conjugation, reactivity, and interference with lipid metabolism. Chem. Res. Toxicol. 2013;26(8):1139–1155. doi: 10.1021/tx400183y. [DOI] [PubMed] [Google Scholar]
- Des Rosiers C, Fernandez CA, David F, Brunengraber H. Reversibility of the mitochondrial isocitrate dehydrogenase reaction in the perfused rat liver. Evidence from isotopomer analysis of citric acid cycle intermediates. J. Biol. Chem. 1994;269(44):27179–27182. [PubMed] [Google Scholar]
- Ellis JK, et al. Metabolic profiling detects early effects of environmental and lifestyle exposure to cadmium in a human population. BMC. Med. 2012;10:61. doi: 10.1186/1741-7015-10-61. [DOI] [PMC free article] [PubMed] [Google Scholar]
- Grevengoed TJ, Klett EL, Coleman RA. Acyl-CoA metabolism and partitioning. Annu. Rev. Nutr. 2014;34:1–30. doi: 10.1146/annurev-nutr-071813-105541. [DOI] [PMC free article] [PubMed] [Google Scholar]
- Haynes CA, et al. Quantitation of fatty acyl-coenzyme As in mammalian cells by liquid chromatography-electrospray ionization tandem mass spectrometry. J. Lipid Res. 2008;49(5):1113–1125. doi: 10.1194/jlr.D800001-JLR200. [DOI] [PMC free article] [PubMed] [Google Scholar]
- Ikegawa S, et al. Characterization of cholyl-adenylate in rat liver microsomes by liquid chromatography/electrospray ionization-mass spectrometry. Anal. Biochem. 1999;266(1):125–132. doi: 10.1006/abio.1998.2944. [DOI] [PubMed] [Google Scholar]
- Kalghatgi S, et al. Bactericidal antibiotics induce mitochondrial dysfunction and oxidative damage in Mammalian cells. Sci. Transl. Med. 2013;5(192):192ra85. doi: 10.1126/scitranslmed.3006055. [DOI] [PMC free article] [PubMed] [Google Scholar]
- Liu X, et al. High-Resolution Metabolomics with Acyl-CoA Profiling Reveals Widespread Remodeling in Response to Diet. Mol. Cell Proteomics. 2015;14(6):1489–1500. doi: 10.1074/mcp.M114.044859. [DOI] [PMC free article] [PubMed] [Google Scholar]
- Lopez-Gallardo E, Iceta R, Iglesias E, Montoya J, Ruiz-Pesini E. OXPHOS toxicogenomics and Parkinson's disease. Mutat. Res. 2011;728(3):98–106. doi: 10.1016/j.mrrev.2011.06.004. [DOI] [PubMed] [Google Scholar]
- Magnes C, Sinner FM, Regittnig W, Pieber TR. LC/MS/MS method for quantitative determination of long-chain fatty acyl-CoAs. Anal. Chem. 2005;77(9):2889–2894. doi: 10.1021/ac048314i. [DOI] [PubMed] [Google Scholar]
- Mauriala T, Herzig KH, Heinonen M, Idziak J, Auriola S. Determination of long-chain fatty acid acyl-coenzyme A compounds using liquid chromatography-electrospray ionization tandem mass spectrometry. J. Chromatogr. B Analyt. Technol. Biomed. Life Sci. 2004;808(2):263–268. doi: 10.1016/j.jchromb.2004.05.012. [DOI] [PubMed] [Google Scholar]
- Murphy TA, Dang CV, Young JD. Isotopically nonstationary 13C flux analysis of Myc-induced metabolic reprogramming in B-cells. Metab Eng. 2013;15:206–217. doi: 10.1016/j.ymben.2012.07.008. [DOI] [PMC free article] [PubMed] [Google Scholar]
- Paglia G, et al. Metabolomic analysis of platelets during storage: a comparison between apheresis- and buffy coat-derived platelet concentrates. Transfusion. 2015;55(2):301–313. doi: 10.1111/trf.12834. [DOI] [PubMed] [Google Scholar]
- Patti GJ. Separation strategies for untargeted metabolomics. J. Sep. Sci. 2011;34(24):3460–3469. doi: 10.1002/jssc.201100532. [DOI] [PubMed] [Google Scholar]
- Robishaw JD, Neely JR. Coenzyme A metabolism. Am. J. Physiol. 1985;248(1 Pt 1):E1–E9. doi: 10.1152/ajpendo.1985.248.1.E1. [DOI] [PubMed] [Google Scholar]
- Rodgers GM. Overview of platelet physiology and laboratory evaluation of platelet function. Clin. Obstet. Gynecol. 1999;42(2):349–359. doi: 10.1097/00003081-199906000-00019. [DOI] [PubMed] [Google Scholar]
- Salles I, et al. Development of a high-throughput ELISA assay for platelet function testing using platelet-rich plasma or whole blood. Thromb. Haemost. 2010;104(2):392–401. doi: 10.1160/TH09-07-0505. [DOI] [PubMed] [Google Scholar]
- Snyder NW, Basu SS, Worth AJ, Mesaros C, Blair IA. Metabolism of propionic acid to a novel acyl-coenzyme A thioester by mammalian cell lines and platelets. J. Lipid Res. 2015;56(1):142–150. doi: 10.1194/jlr.M055384. [DOI] [PMC free article] [PubMed] [Google Scholar]
- Snyder NW, Basu SS, Zhou Z, Worth AJ, Blair IA. Stable isotope dilution liquid chromatography/mass spectrometry analysis of cellular and tissue medium- and long-chain acyl-coenzyme A thioesters. Rapid Commun. Mass Spectrom. 2014;28(16):1840–1848. doi: 10.1002/rcm.6958. [DOI] [PMC free article] [PubMed] [Google Scholar]
- Snyder NW, et al. Production of stable isotope-labeled acyl-coenzyme A thioesters by yeast stable isotope labeling by essential nutrients in cell culture. Anal. Biochem. 2015;474:59–65. doi: 10.1016/j.ab.2014.12.014. [DOI] [PMC free article] [PubMed] [Google Scholar]
- Wallace DC. Mitochondrial diseases in man and mouse. Science. 1999;283(5407):1482–1488. doi: 10.1126/science.283.5407.1482. [DOI] [PubMed] [Google Scholar]
- Wojtovich AP, Brookes PS. The complex II inhibitor atpenin A5 protects against cardiac ischemia-reperfusion injury via activation of mitochondrial KATP channels. Basic Res. Cardiol. 2009;104(2):121–129. doi: 10.1007/s00395-009-0001-y. [DOI] [PMC free article] [PubMed] [Google Scholar]
- Worth AJ, et al. Stable isotopes and LC-MS for monitoring metabolic disturbances in Friedreich's ataxia platelets. Bioanalysis. 2015;7(15):1843–1855. doi: 10.4155/bio.15.118. [DOI] [PMC free article] [PubMed] [Google Scholar]
- Worth AJ, Basu SS, Snyder NW, Mesaros C, Blair IA. Inhibition of neuronal cell mitochondrial complex I with rotenone increases lipid beta-oxidation, supporting acetyl-coenzyme A levels. J. Biol. Chem. 2014;289(39):26895–26903. doi: 10.1074/jbc.M114.591354. [DOI] [PMC free article] [PubMed] [Google Scholar]
- Zhou L, Schmaier AH. Platelet aggregation testing in platelet-rich plasma: description of procedures with the aim to develop standards in the field. Am. J. Clin. Pathol. 2005;123(2):172–183. doi: 10.1309/y9ec-63rw-3xg1-v313. [DOI] [PubMed] [Google Scholar]


