Abstract
Comprehensive understanding of thermomechanical response and microstructure evolution during surface severe plastic deformation (S2PD) is important towards establishing controllable processing frameworks. In this study, the evolution of crystallographic textures during directional surface mechanical attrition treatment on copper was studied and modelled using the visco-plastic self-consistent framework. In situ high-speed imaging and digital image correlation of surface deformation in circular indentation were employed to elucidate mechanics occurring in a unit process deformation and to calibrate texture model parameters. Material response during directional surface mechanical attrition was simulated using a finite-element model coupled with the calibrated texture model. The crystallographic textures developed during S2PD were observed to be similar to those resultant from uniaxial compression. The implications of these results towards facilitating a processing-based framework to predict deformation mechanics and resulting crystallographic texture in S2PD configurations are briefly discussed.
Keywords: severe plastic deformation, surfaces, texture
1. Introduction
Surface modification methods have long been used to endow mechanical components with enhanced properties across an array of technological applications. Functionalization of component surfaces generally involves altering the chemistry, microstructure, topography and stress state—collectively termed as integrity—of the material surface and subsurface. Methods used for surface functionalization are broadly classified as being either additive-based (e.g. coating, deposition, implantation) or deformation-based (e.g. machining [1], burnishing [2], surface impact [3]) treatments. Among these, the latter grouping is inherently more scalable for structural component applications as they are integrable in processing frameworks based on severe plastic deformation (SPD: ϵ≫1) to tailor surface microstructure and stress state. For deformation-based configurations, surface integrity is determined by the deformation field and corresponding strain rate, strain and temperature. In this regard, a fundamental need exists to understand and quantify relationships between deformation mechanics and controllable processing parameters, as well as corresponding effects on various elements of surface integrity. Such process–mechanics–structure frameworks are essential towards optimization of surface severe plastic deformation (S2PD) methods for engineering high-performance mechanical components.
Surface mechanical attrition treatment (SMAT) is an S2PD method that has been used to endow metallic components with enhanced structural (e.g. subdued wear [4], increased fatigue life [5]) and functional (e.g. subdued corrosion [6]) response. This process involves repeated surface impact by solid or fluidic shots (e.g. shot peening, cavitation peening) or actuated tooling (e.g. ultrasonic impact treatment [7]). SPD imposed due to the repetitive deformation results in grain fragmentation, leading to formation of ultrafine-grained (UFG) and nanostructured microstructures in the surface and subsurface [3,8]. The mechanics of microstructure evolution during surface deformation have been studied and effects of thermomechanical conditions (e.g. strain rate, strain, temperature) on resulting microstructures have been delineated in several materials featuring different intrinsic properties in terms of crystallography and stacking fault energy [3,9,10].
While the fundamental mechanisms driving grain refinement in S2PD have been addressed, limited attention has been devoted to evolution of surface integrity in terms of crystallographic texture. Among the limited observations that have been made, an absence of strong crystallographic textures (i.e. preferred orientations) has been noted in severely deformed surfaces, such as that which have been shown for fcc [10] and bcc [9] materials processed by SMAT. This has been attributed to microstructure-dominated mechanisms such as grain boundary sliding (GBS)-assisted grain rotation [10] and the activation of discontinuous dynamic recrystallization (DDRX). GBS-assisted grain rotation dominates at ambient temperatures when δ15° < ∼20 nm [11] or under thermal activation at larger homologous temperatures T>0.3Tm in microcrystalline regimes δ15°<10 μm [12], where δ15° refers to the mean grain diameter with misorientation θ>15°. Therefore, the contribution of GBS towards accommodation of plastic flow during S2PD is negligible in prototypical pre-SMAT polycrystalline solids at near ambient temperatures, these often featuring δ15°>100 μm. On the other hand, DDRX generally manifests under extreme thermomechanical conditions ( and ) [13]. DDRX is a discontinuous mechanism of microstructure evolution wherein new randomly oriented grains nucleate within the severely deformed microstructure, resulting in an eventual absence of preferred orientations [14]. However, the thermomechanical space relevant to S2PD complemented by the aforementioned DDRX dominated space is governed by a suite of other microstructural mechanisms such as continuous/geometric dynamic recrystallization (CDRX/GDRX) and twinning [15–18]. Herein, evidence of a dramatically different evolution of crystallographic textures than that governed by DDRX and GBS during S2PD of microcrystalline (δ15°>100 μm) oxygen free high conductivity (OFHC) copper by SMAT has been found at low temperatures (T≪Tm/2) [19]. In this work, clear concentrations of preferred orientation were seen at the end of S2PD. However, the exact nature of the mechanics that resulted in the formation of preferred orientations during S2PD by SMAT was not elucidated.
In this study, evolution of microstructure and crystallographic texture during S2PD in directional SMAT is investigated. As the microstructure created during SMAT is a consequence of the coupled effect of multiple surface impacts/indentations, insights are drawn from elucidating the mechanics and microstructure evolution in a unit surface indentation process. To this end, the present article focuses on evolution of crystallographic textures during SMAT, known to play an important role in determining the structural [20] and functional response [2] of metallic components.
2. Experimental methods
Indentation experiments at a speed of v=0.1 mm s−1 were performed on annealed OFHC Cu workpieces with a circular steel indenter (diameter d=1 mm, thickness t=25 mm) in a custom designed set-up depicted in figure 1a. The front plane, YZ in figure 1a, of the workpiece was in constant contact with a tempered glass window, ensuring a plane strain condition under the indenter. Material flow was imaged using a high-speed digital camera (PCO Dimax) and corresponding displacement fields were determined using a digital image correlation (DIC) algorithm. From these measurements, the deformation in terms of strain rate fields, strain fields and rotation fields was evaluated, following the method described in [21]. The resulting deformation histories were coupled with the visco-plastic self-consistent (VPSC) framework to simulate evolution of crystallographic textures, as is described in the ensuing sections. To complement these unit deformation tests, S2PD experiments were performed. Directional SMAT was performed on as-received OFHC Cu (alloy 101, 2.3 mm thick) using spherical silica SiO2 shots (diameter dshot∼200 μm) accelerated by a directed blast of air at 0.4 MPa. The area of the specimens was 25.4 mm×25.4 mm. The blast of SiO2 impacts was directed normally with respect to the surface near the centre of the workpiece. Consequently, the area close to the centre of the specimen was exposed to several hundred overlapping impacts oriented in near parallel orientations with respect to the Z-axis in figure 1b. The surface treatment was performed for durations of 600 s and 1200 s. The velocity of impact vimpact was measured to be approximately 10 m s−1 by recording the mass flow rate.
Figure 1.
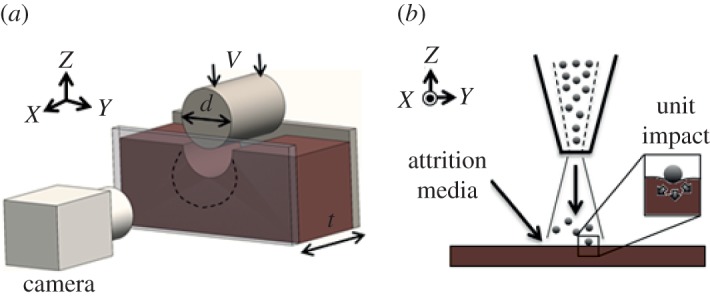
(a) Schematic of indentation set-up for performing in situ characterization of deformation zone (dotted line) and (b) configuration of direction SMAT. (Online version in colour.)
Orientation imaging microscopy (OIM) was performed using electron back scattered diffraction (EBSD) using a Tescan field emission scanning electron microscope (SEM). Specimens were prepared by mechanical polishing and ion beam polishing (Hitachi 4000). Scan step sizes between 1 μm and 0.1 μm were used, the beam diameter was approximately 80 nm and accelerating voltage was 20 kV. Microstructure was also characterized using a Panalytical X'Pert X-ray diffractometer. Measurements were performed at 45 kV and 40 mA using the Kα1 radiation of Cu λ=0.1540598 nm with a scan step size of 5°. For this, the surface perpendicular to the Z-direction in figure 1b was exposed to the incident beam. Pole figures corresponding to the first three peaks in Cu viz. (111), (200) and (220) at diffraction angles of approximately 43°,50° and 74° were measured, respectively. Background noise was measured at θ±4°, where θ is the diffraction angle. Defocusing correction was performed be measuring defocusing error curves from non-textured Cu powder. Post measurement analyses including pole figure inversion were performed using Matlab-based MTEX, which employs the inversion algorithm described in [22]. For this, fcc crystal symmetry (Laue group: Fm3m, MTEX: m-3m) and triclinic sample symmetries were used.
3. Simulation methods
Deformation in SMAT was simulated as a sequence of impacts and was implemented through Python subroutines and built-in scripting interface in ABAQUS [23]. Using these subroutines, the mechanical state of the workpiece prior to a single impact was extracted from the post-deformation state from the previous impact simulation. Impacting shots were modelled as spherical elastic bodies with diameter=200 μm, E=73 GPa and ν=0.17 using tetrahedral (C3D4) mesh elements. The workpiece was modelled as an isothermal body using hexahedral elements (C3D84, element size: 10 μm) with reduced integration and hourglass control [23]. The iso-thermal state of the workpiece was governed by the diffuse nature of deformation imposed by spatially and temporally discrete impacts across the work surface that prohibit concentrated heat dissipation. Note that high pressure air blast also would act to subdue temperature rise by enhancing thermal dissipation. The Johnson–Cook material model was used: , where for OFHC Cu [24]. To impose isothermal conditions, T=Tr was maintained. Gaussian-distributed velocities of V x=N(0,0.5), V y=N(0,0.5), V z=(10,0.01) ms−1 were assigned to the impacting shots. Initial positions of shots were also Gaussian-distributed at N(0,10),N(0,10) μm with respect to the workpiece centre. Post-simulation processing was performed in order to numerically model evolution of crystallographic textures during S2PD. Pertaining details are described in the appendix section.
4. Result and discussion
(a). Unit deformation field
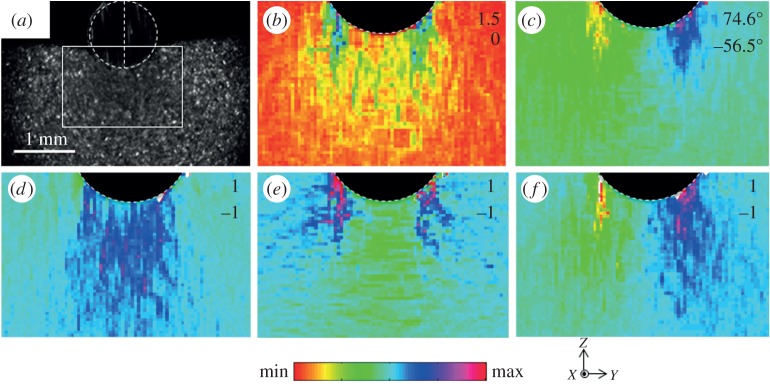
Material flow in the deformation zone during a unit surface indentation was recorded in situ and subsequently characterized using DIC. A representative high-speed image captured during this process is provided in figure 2a, which also demarcates the field of view captured in the DIC analysis. Figure 2b shows the effective strain field developed underneath the indenter, obtained by integrating the incremental strains experienced by each material point (x,y) as , where refers to the path line of point (x,y) and , where Dp is the symmetric component of the velocity gradient tensor
In this case, u and v are velocity components along the Y- and Z-directions of figure 1a, respectively. From the figure, a maximum effective strain of 1.5 was observed underneath the indenter, this occurring at lines approximately 45° from the indenter centreline. Additionally, the effective strain field features a minimum directly underneath the indenter (ϵ∼0.5) that can be attributed to the formation of the so-called ‘dead metal zones’ [25] during the surface deformation process. It was seen that a zone approximately 1 mm wide was affected by the deformation imposed, wherein effective strains were found to be radially decaying outwards with respect to the indenter. Figure 2c shows the corresponding rotation field, calculated by polar decomposition of the deformation gradient tensors F, which were calculated using . The rotation tensor is related to physical angles of rotation θ with respect to the X-axis (figure 2c) using . From the figure, this rotation ranges from −56.5° to 74.6° across the deformation field. Finally, the heterogeneity present in the deformation field is also clearly observed in the Lagrangian tensorial components provided in figure 2d,e. It was seen that comparable Lagrangian strain components are imposed during circular indentation with for all components. However, these components feature characteristically different distributions with respect to the indenter. For instance, E11 and E22 fields were seen to be symmetric about the centreline of the indenter, whereas E12 was seen to be antisymmetric. The Lagrangian components were calculated as , where is the Lagrangian strain tensor. Understanding of this heterogeneity in the Lagrangian strain components imposed during indentation is important towards elucidating the role strain path changes and reversals play during unit deformation processes in S2PD [26].
Figure 2.
(a) Representative high-speed image showing in situ characterization of material flow during surface deformation, (b) effective strain field, (c) rotation field and (d–f) Lagrangian strain components E11, E22, E12, respectively. Maximum and minimum values of the strain fields are provided in the inset data. (Online version in colour.)
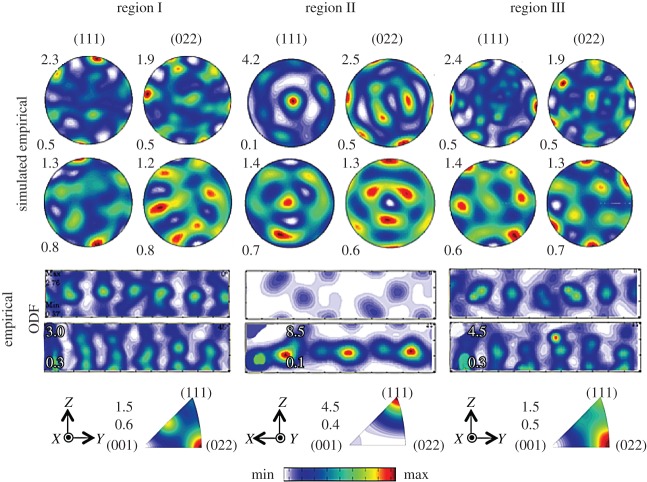
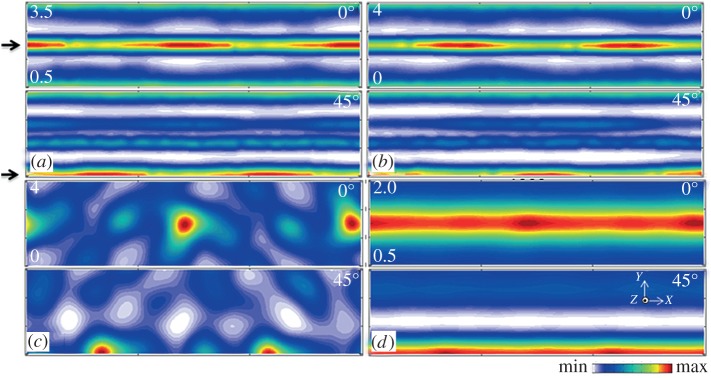
The deformed microstructure for specific locations in the deformation zone is shown in the inverse pole figures (IPFs) of figure 3. In the vicinity of the indenter–workpiece interface, labelled as region I (figure 3a), the deformed grains exhibited an elongated morphology due to the severe shear strain (approx. 1.5) imposed in the work material. At greater distances from the indenter, as in regions II and III (figure 3b,c), the effects of deformation were not as clear with grains exhibiting microcrystalline equiaxed morphology. To quantify the effects of the deformation on crystallographic texture, orientation distribution functions (ODFs) and pole figures were extracted from these IPFs by discrete binning of the orientations (bin size: 5°). From figure 4, substantial differences between the crystallographic textures extracted from regions I–III can be identified; these differences can be explained by considering the heterogeneity in the flow field evident in the DIC-measured strain tensor components (figure 2). The strain tensor components were calculated using , where is the identity tensor. In this regard, the textures in region I of figure 4a exhibited a dominant simple shear character, featuring concentrations along fibres similar to the f1, f2 and f3 fibres conventionally seen in simple shear deformation geometries [1,27]. The Lagrangian strain tensor components in this region were E11= ∼0.1, E22= ∼−0.1,E12= ∼0.9. E11 and E22 refer to the horizontal EYY and vertical EZZ Lagrangian strain components, respectively (see axis inset in figure 3a). On the other hand, crystallographic textures in region II of figure 4b exhibited tensile character, with the tensile axis oriented along the sample horizontal (Y) direction [28]. In this region, the strain tensor components were E11= ∼0.2,E22= ∼−0.2,E12= ∼0.01.
Figure 3.
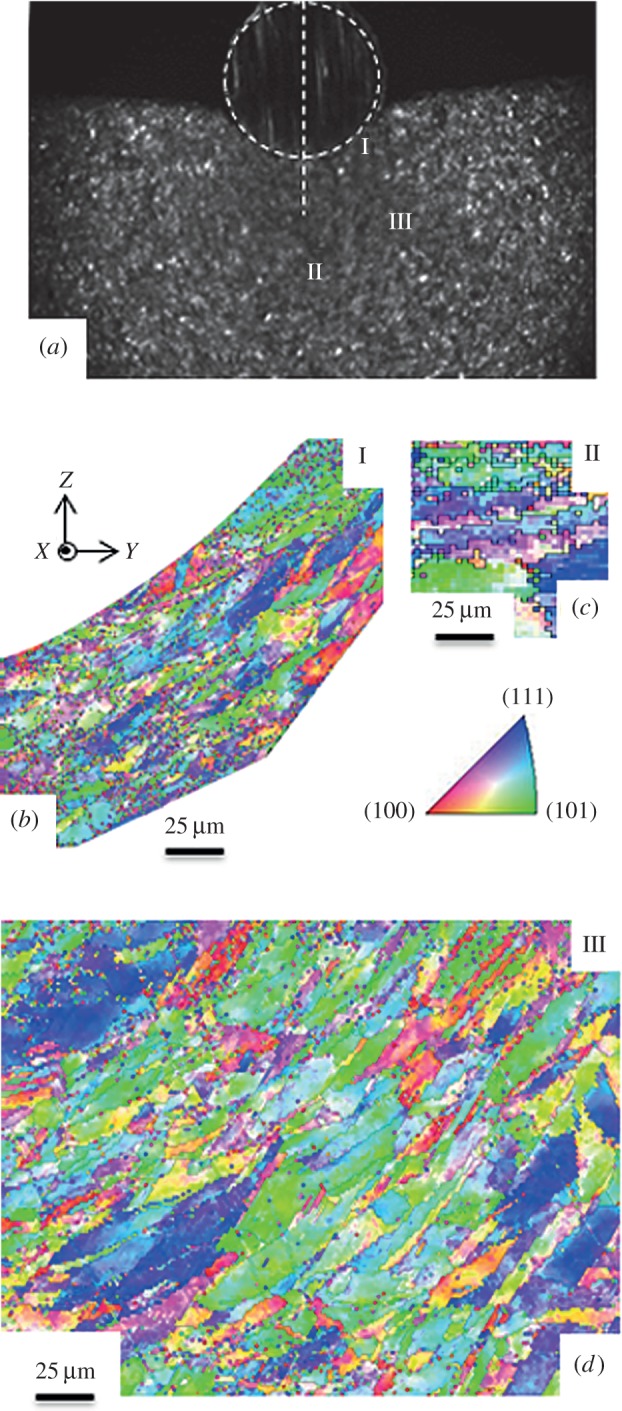
(a) Surface deformation configuration and (b–d) OIM measurements for regions I, II and III, respectively. (Online version in colour.)
Figure 4.
Empirical and simulated crystallographic textures from surface indentation tests. (111) and (022) pole figures, ϕ2 sections {0°,45°} and inverse pole figures are shown for (a) region I, (b) region II and (c) region III. (Online version in colour.)
Texture evolution was simulated using the VPSC framework and the deformation histories obtained from the in situ DIC-based characterization of the deformation zone. The texture of initial undeformed samples was characterized by OIM using EBSD and revealed a lack of preferred orientations (i.e. random crystallographic textures). In this regard, the initial undeformed discretized ODFs that were inputted to the VPSC framework were produced by sampling uniformly distributed orientation space. Simulated crystallographic textures for regions I–III in the deformation field are shown in figure 4. For these simulated pole figures and ODFs, the parameters of the VPSC framework were tuned until good agreement was met between simulated and empirically obtained results. A grain fragmentation scheme with aspect ratio R=5 was adequate for simulating evolution of the crystallographic texture, where R is the maximum aspect ratio that determines sub-grain fragmentation with crystallographic orientation of the split grains being the same as that of the mother grain [27,29]. Beyond this stage, each grain evolves independently through the numerical simulation. This process is in the same vein as that occurring during GDRX, which involves elongated grains fragmenting into small grains during evolution to mechanistically defined aspect ratios [17]. Herein, it is noted that the framework is also capable of accounting for CDRX happening due to gradual formation and consolidation of dislocation cell walls, wherein progressively smaller grains featuring large disorientation with respect to their neighbours are created. In this regard, GDRX and CDRX were accounted for through the visco-plastic self-consistent framework while simulating evolution of crystallographic textures. While discrepancies exist in the maximum intensities of the empirical and simulated pole figures in figure 4, the calibrated VPSC framework was capable of reproducing the primary characteristics of the deformed crystallographic textures. The variations in these intensities can be explained by the contributions of sufficiently large grain sizes to concentrations in the orientation space.
(b). Surface severe plastic deformation
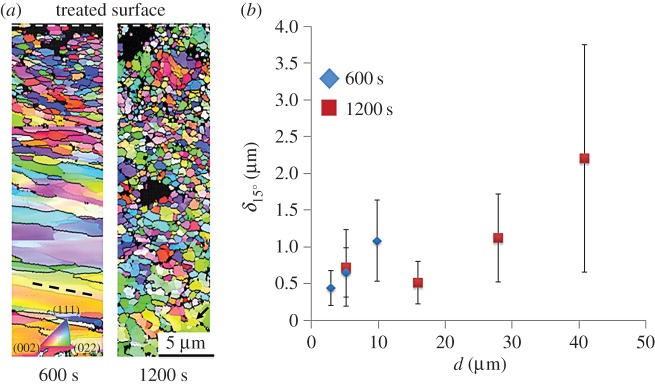
The deformed microstructures in the SMAT-processed surfaces are depicted in figure 5a. From the OIM measurements, equiaxed UFG microstructures are clearly evident in the vicinity of the treated surfaces. The evolution of these microstructures is likely to be a consequence of CDRX in the deformed surface. In CDRX, progressive formation and subdivision of dislocation structures takes place due to increased levels of deformation, this resulting in grain fragmentation and formation of UFG states [18,30]. The relationship between grain size and treatment time is summarized in the δ15° versus d profiles provided in figure 5b. For the 600 s treatment, a grain size of δ15°= ∼0.5 μm was observed over a relatively small subsurface depth of less than 3 μm. At the longer treatment duration of 1200 s, a similar grain size existed over a deeper zone approximately 15 μm in the deformed subsurface. The longer duration treatment also featured a smaller gradient in microstructure, with empirically obtained ∂δ15°/∂d=0.068 and 0.092 for the 1200 s and 600 s treatments, respectively. OIM scans performed on 1200 s specimens exhibited a lower degree of alignment in their dislocation structures compared with those seen in OIM of 600s specimens. These structures existed in zones between the severely deformed layer close to the surface and the pristine material existing at larger depths and are demarcated using thin black lines in figure 5a, referring to boundaries featuring disorientation θ>2°. Such dislocation structures are known to originate from strain path changes and accelerate microstructure evolution with respect to imposed effective strains [26,31]. Dominance of such dislocation structures exhibited by specimens that underwent S2PD for longer durations suggests an increasing and cumulative contribution of strain path changes to the mechanics of material evolution. In this regard, it can be anticipated that the thickness of the zone featuring ultra-fine grain sizes should expand nonlinearly with respect to treatment times due to the accelerated microstructure response as seen empirically: d=3 μm,15 μm at t=600 s, 1200 s, respectively. However, this trend can be expected to disappear at longer treatment durations owing to strain hardening of the material directly beneath the surface, wherein a constant thickness of the zone featuring deformed grains can be anticipated despite an increasing number of impacts. Further investigations are needed to verify this claim.
Figure 5.
(a) Orientation imaging microscopy using electron back scattered diffraction of treated surface, (b) variation in grain size δ15° with respect to depth d from treated surface. Dashed line in (a) shows orientation of dislocation structures. Arrow in (a) points at zone featuring poorly aligned dislocation structures. (Online version in colour.)
The crystallographic textures of the initial material and the deformed surfaces are depicted in the ODFs and (111) and (022) pole figures of figure 6a–c. Prior to SMAT, the workpiece surface exhibits a cube texture depicted in figure 6a. After processing by SMAT, the crystallographic textures exhibit a centro-symmetric fibre about the workpiece surface normal direction, Z in figure 1b. This evolution is a result of the directional nature of the deformation, which was oriented perpendicular to the work surface. From figure 6b,c, it is also clear that negligible variation exists between the crystallographic textures observed for the 600 s and 1200 s samples. Microstructural states exhibiting negligible evolution of crystallographic textures with respect to imposition of further strains are commonly seen during imposition of SPD [32,27].
Figure 6.

Empirical and simulated (111) and (022) pole figures for (a) initial undeformed sample, (b) SMAT treatment for 600 s, (c) SMAT treatment for 1200 s, (d) numerical simulation of 850 impacts and (e) 360°ϕ1 symmetry after 850 impacts. (Online version in colour.)
The simulated deformation field for a unit surface deformation is given in figure 7a for , where eX,eY and eZ are unit vectors. The effective strain field and Lagrangian strain components in figure 7b–h reveal a three-dimensional material flow pattern involving comparable strain components featuring of similar orders of magnitude, where |En| refers to components in the Lagrangian strain tensor . The three-dimensional nature of the deformation field is important for understanding potential strain path changes, reversals and strain heterogeneity in the final deformed surface that can lead to accelerated microstructure refinement during S2PD [26,31]. In terms of strain rate, a maximum effective strain rate was observed during the surface deformation process.
Figure 7.
(a) Simulation of surface deformation for unit impact, (b) effective strain field and (c–h) Lagrangian strain tensor field components (E11, E22, E33, E12, E13, E23, respectively). Maximum and minimum values of the strain fields are provided in the inset data. (Online version in colour.)
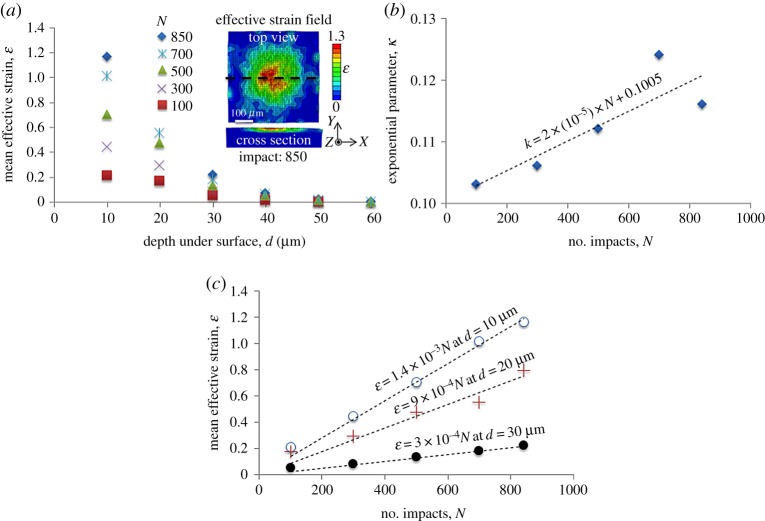
The deformation occurring after multiple surface impacts was simulated up to a total of 850 impacts. The final effective strain field exhibited a Gaussian-type spatial distribution as evident in figure 8, this arising due to the Gaussian-distributed spatial locations of the spherical shots. Figure 8a also shows the numerically simulated strain profiles under the surfaces treated using SMAT. From the plot, it is clearly evident that the maximum strain in the deformed surface increases with the number of impacts and decays exponentially with increased depth into the work subsurface. In terms of maximum strain, at 850 impacts a peak effective strain in the deformed subsurface of ϵ∼1.3 at d=10 μm was seen. The exponential variation of strain can be modelled as , where ϵs is the effective strain imposed on the surface and κ is an empirically obtained constant. After 850 impacts, the effective strain in the subsurface followed with an R2=0.98. Both ϵs and κ were seen to increase monotonically with the number of surface impacts. From figure 8b,c, these variations were seen to be κ=2×10⁻⁵ N+0.1005 and ϵs=1.4×10⁻³ N at d=10 μm, respectively, where N is the number of impacts. This variation manifests in the deformation affected zone increasing in dimensions with respect to the number of impacts. Further, the linear increase of ϵd with the number of impacts implies that imposition of larger effective strains in the subsurface is possible with directly increasing surface treatment times. Interestingly, exponential variations in effective strains with respect to depths under the surfaces have also been seen in other controlled S2PD platforms such as machining wherein parameters of the same were found to be relatable to process variables [33,34]. In this regard, it is evident that mechanical attrition processes avail similar control on process mechanics and microstructure response trajectories, the process variables of relevance being treatment times and energy of impact as discussed in the ensuing sections.
Figure 8.
(a) Numerically obtained strain profiles under the surface deformed by SMAT. Inset shows strain field after 850 impacts on the surface and in cross section. (b) Variation in exponential parameter with respect to number of impacts N. (c) Variation in strain with respect to number of impacts at specified depths from treated surface. (Online version in colour.)
Texture evolution was simulated using the VPSC framework and the deformation histories obtained from the finite-element (FE) simulations. In this regard, velocity gradient tensors from elements near the centre of the workpiece were used, as these correspond to the peak in the Gaussian-distributed effective strain field (inset, figure 8a). The initial workpiece texture, which also comprises input to the VPSC framework in a discretized ODF form (i.e. list of grain orientations corresponding to the ODF), was obtained by sampling grains from the empirically measured pre-deformed ODF. Simulated pole figures and ODFs are shown in figures 6d and 9c, respectively, and these exhibit qualitative similarity with their empirical counterparts. For the numerically simulated ODFs in figure 9c, concentrations are present along fibres featuring ϕ1 symmetry (demarcated with black arrows in figure 9), which corresponds to 360° symmetry of the deformed sample. The location of these fibres was coincident with those measured from samples deformed after SMAT treatments of 600 s and 1200 s, as in figure 9a,b. The discontinuous nature of the fibres obtained in the numerical simulation can be explained by considering the spatially discontinuous deformation imposed during the limited number of impacts. This was not the case for the empirically measured ODFs of figure 9a,b, which contain a significantly greater number of impacts that resulted in a more continuous distribution of fibres in orientation space. To better elucidate the resulting texture in the limiting case, 360°ϕ1 symmetry was imposed on the numerically obtained crystallographic textures and is given in figures 6e and 9d. Results using this approach coincided well with empirically obtained crystallographic textures, as is seen by a comparison of the pole figures and ODFs.
Figure 9.
Measured ODFs for SMAT treatment for: (a) 600 s and (b) 1200 s. Simulated ODFs for (c) 850 impacts and (d) 360°ϕ1 symmetry after 850 impacts. Black arrows show coincidence of dominant fibres in measured and simulated samples. (Online version in colour.)
The crystallographic textures obtained during SMAT share similarities with compression-type textures, which have been observed to constitute fibres that are coincident with those obtained empirically in this study for SMAT [35,36]. An example of typical compression textures in fcc crystals of medium-to-high stacking fault energy is shown in figure 10. These were obtained by numerical simulation of compression deformation using the aforementioned calibrated VPSC framework. Here, effective strains ϵ were limited to 0.6 at nominal strain rates . A potential source of the similarity between textures produced by directional SMAT and uniaxial compression could be in strain path changes present during the surface deformation process. Evidence of strain path changes during S2PD were seen in results obtained from OIM of specimens, these exhibiting poorly aligned dislocation structures. Strain path changes involve path reversals that act to negate contributions from other Lagrangian strain components and additively amplify the compression E33 component under the surface. Subdued crystallographic textures due to reversals have been seen in the C route of ECAP, wherein texture strengths in even numbered passes, these involving reversals, were found to be smaller than their odd numbered counterparts [27].
Figure 10.
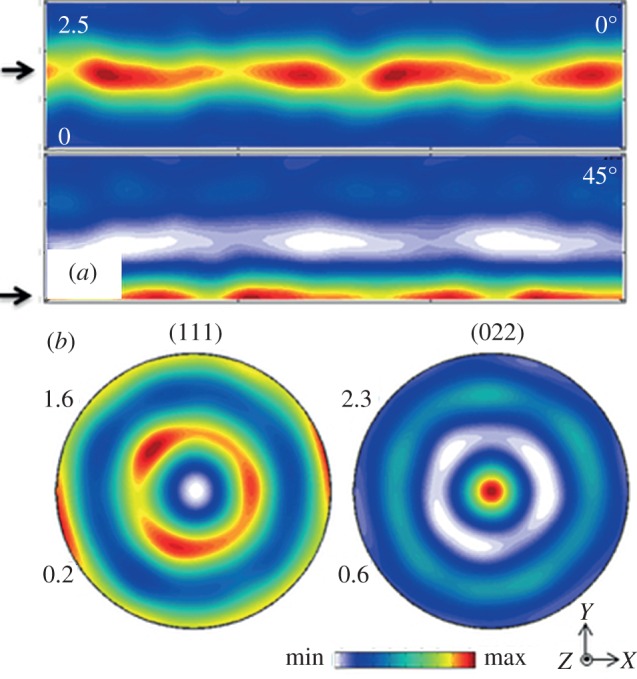
(a) ODFs and (b) pole figures for Cu deformed by uniaxial compression, with compression axis aligned along the Z-direction. Refer bottom for colour bar and orientation axis. Black arrows show location of fibres in empirically obtained and numerically simulated SMAT samples. (Online version in colour.)
The subsurface zones affected by deformation during attrition-based S2PD feature smaller dimensions in this study (15 μm at 1200 s of treatment) when compared with others (approx. 300 μm for 300 s of treatment in [3]). Potential origins of this discrepancy lie in the differences between the attrition media used. Wang et al. [3] employed steel balls with diameter d=8 mm, compared to the SiO2 balls of d=200 μm used in this study. It has been shown that such attributes influence the dimensions of subsurface zones deformed during S2PD [37], primarily due to the role of impact energy in determining subsurface plastic zone extent. In this regard, the family of attrition-based S2PD process is also fraught with variability in the geometry of its microstructure evolution trajectories that could arise from fluctuations in velocity V as well as diameter d of individual particles. These fluctuations will result in variance in the energy delivered by the impacting particles: , where . Control over the intensity of directional SMAT can be achieved by tuning the energy of individual impacts precisely and thereby decreasing standard deviations associated with the same. In this regard, empirical characterization of the attrition media and the deformation set-up employed for experiments herein exhibited a linear variation in total energies delivered to the workpiece with respect to the number of impacts. These estimates were based on empirically characterized mass flow rates. Furthermore, linear variations in energies delivered can be expected to result in linear variations in strain with respect to the number of impacts as found numerically and depicted in figure 8c, validating the process control necessary in realizing attrition-based S2PD for tailoring final microstructures a priori.
5. Summary
This study investigated the mechanics of texture evolution occurring during S2PD of pure Cu. Deformation in directional surface mechanical attrition in terms of thermomechanical variables (i.e. strain, strain rate) and their decay into the subsurface was investigated using an FE model. It was observed that surface strain levels as well as the extent of the subsurface strained layer are directly related to the number of impacts on the workpiece surface. Complementary to these mechanics-based investigations, the evolution of crystallographic textures during the directional SMAT was also directly measured and numerically simulated. The texture simulations were conducted using a visco-plastic self-consistent modelling framework based on CDRX material flow rules that was coupled with the FE model results. Experimental calibration of the texture prediction model parameters was achieved by simulating texture evolution for a representative unit-level surface deformation occurring during circular indentation. In situ high-speed imaging and digital image correlation measurements of indentation were used to quantify the mechanics of surface deformation in terms of displacement, strain rate, strain and rotational tensorial quantities. Coupled with experimental texture measurements made of the resulting surface state in the unit-level surface deformation, the in situ mechanics measurements were used to establish model parameters that provide accurate visco-plastic self-consistent model predictions for texture in S2PD. Using this methodology, the present research identified a hitherto unknown aspect of material response trajectory manifesting evolution of strong crystallographic textures during S2PD of Cu. In this regard, it became evident that the mechanistic underpinnings of evolving textures during S2PD lie in CDRX. Some stochastic aspects of material response during S2PD were discussed.
Acknowledgements
The authors would like to acknowledge Mr David Tavakoli's help with collection of XRD data at Georgia Institute of Technology.
Appendix A. Calibrated framework-based simulation of crystallographic textures
Post-simulation processing was performed to couple the simulated flow fields with the VPSC framework [38] for simulating evolution of crystallographic textures. This was done using Python subroutines whereby displacements undergone by element nodes close to the deformed surface were converted to velocity gradient tensors for input to the VPSC framework. Subsequent analysis of crystallographic textures, including pole figure inversion and orientation distribution function reconstruction, was performed using MTEX. In VPSC, grains within a polycrystal are assumed to be embedded as inclusions in a homogeneous equivalent medium, the mechanical behaviour of which is governed by the mean behaviour of all grains combined [29]. The framework simulates evolution of texture of individual grains based on the deformation history while self-consistently updating properties of the medium. The isotropic Voce hardening law was used for simulating hardening and is given by: , where and are the initial critical resolved shear stress (CRSS), back extrapolated CRSS, initial hardening rate and asymptotic hardening rate, respectively, and Γ=ΣΔγs is the shear strain. It was assumed that deformation is accommodated by dislocation slip on (111)〈110〉 slip systems, with twinning ignored. Simulations of singular impacts in the ensuing revealed and ϵ∼0.08. Prior work in SPD of Cu has shown negligible contribution from twinning under these conditions. Hardening parameters were [1,31]. A strain rate sensitivity=20 was used in the visco-plastic strain rate law. The framework was calibrated by simulating crystallographic textures during indentation using DIC-based flow fields and tuning parameters until good match was found between empirical and simulated textures.
Data accessibility
Datasets supporting this article are available upon request to Dr Christopher Saldana: christopher.saldana@me.gatech.edu.
Author' contributions
S.B. designed the experimental study related to SMAT, carried out experiments related to SMAT, performed characterization of indentation and surface mechanical attrition treated work pieces, set up numerical simulation of deformation, did primary analysis; Z.W. carried out all experiments and digital image correlation based characterization of deformation during indentation, participated in data analysis; C.S. conceived of the study, coordinated and helped draft the manuscript. All authors gave final approval for publication.
Competing interests
The authors have no competing interests.
Funding
This work was supported by NSF grant CMMI1254818 and Third Wave Systems via DOE (grant no. DE-EE0005762).
References
- 1.Basu S, Ravi Shankar M. 2015. Crystallographic textures resulting from severe shear deformation in machining. Metall. Mater. Trans. A 46, 801–812. (doi:10.1007/s11661-014-2672-8) [Google Scholar]
- 2.Pu Z, Yang S, Song GL, Dillon OW Jr, Puleo DA, Jawahir IS. 2011. Ultrafine-grained surface layer on Mg–Al–Zn alloy produced by cryogenic burnishing for enhanced corrosion resistance. Scr. Mater. 65, 520–523. (doi:10.1016/j.scriptamat.2011.06.013) [Google Scholar]
- 3.Wang K, Tao NR, Liu G, Lu J, Lu K. 2006. Plastic strain-induced grain refinement at the nanometer scale in copper. Acta Mater. 54, 5281–5291. (doi:10.1016/j.actamat.2006.07.013) [Google Scholar]
- 4.Zhang YS, Han Z, Wang K, Lu K. 2006. Friction and wear behaviors of nanocrystalline surface layer of pure copper. Wear 260, 942–948. (doi:10.1016/j.wear.2005.06.010) [Google Scholar]
- 5.Roland T, Retraint D, Lu K, Lu J. 2006. Fatigue life improvement through surface nanostructuring of stainless steel by means of surface mechanical attrition treatment. Scr. Mater. 54, 1949–1954. (doi:10.1016/j.scriptamat.2006.01.049) [Google Scholar]
- 6.Balusamy T, Kumar S, Narayanan TSNS. 2010. Effect of surface nanocrystallization on the corrosion behaviour of AISI 409 stainless steel. Corrosion Sci. 52, 3826–3834. (doi:10.1016/j.corsci.2010.07.004) [Google Scholar]
- 7.Dutta RK, Malet L, Gao H, Hermans MJM, Godet S, Richardson IM. 2015. Formation of nanostructures in severely deformed high-strength steel induced by high-frequency ultrasonic impact treatment. Metall. Mater. Trans. A 46, 813–830. (doi:10.1007/s11661-014-2658-6) [Google Scholar]
- 8.Lemiale V, Estrin Y, Kim H, O'Donnell R. 2011. Forming nanocrystalline structures in metal particle impact. Metall. Mater. Trans. A 42, 3006–3012. (doi:10.1007/s11661-010-0588-5) [Google Scholar]
- 9.Tao NR, Wang ZB, Tong WP, Sui ML, Lu J, Lu K. 2002. An investigation of surface nanocrystallization mechanism in Fe induced by surface mechanical attrition treatment. Acta Mater. 50, 4603–4616. (doi:10.1016/S1359-6454(02)00310-5) [Google Scholar]
- 10.Zhang HW, Hei ZK, Liu G, Lu J, Lu K. 2003. Formation of nanostructured surface layer on AISI 304 stainless steel by means of surface mechanical attrition treatment. Acta Mater. 51, 1871–1881. (doi:10.1016/S1359-6454(02)00594-3) [Google Scholar]
- 11.Schiotz J, Di Tolla FD, Jacobsen KW. 1998. Softening of nanocrystalline metals at very small grain sizes. Nature 391, 561–563. (doi:10.1038/35328) [Google Scholar]
- 12.Ashby MF, Verrall RA. 1973. Diffusion-accommodated flow and superplasticity. Acta Metall. 21, 149–163. (doi:10.1016/0001-6160(73)90057-6) [Google Scholar]
- 13.Humphreys FJ, Hatherly M. 2004. Recrystallization and related annealing phenomena, 2nd edn Amsterdam, The Netherlands: Elsevier. [Google Scholar]
- 14.Doherty RD. et al. 1997. Current issues in recrystallization: a review. Mater. Sci. Eng. A 238, 219–274. (doi:10.1016/S0921-5093(97)00424-3) [Google Scholar]
- 15.Brown TL. et al. 2009. A study of the interactive effects of strain, strain rate and temperature in severe plastic deformation of copper. Acta Mater. 57, 5491–5500. (doi:10.1016/j.actamat.2009.07.052) [Google Scholar]
- 16.Abolghasem S, Basu S, Shekhar S, Cai J, Shankar MR. 2012. Mapping subgrain sizes resulting from severe simple shear deformation. Acta Mater. 60, 376–386. (doi:10.1016/j.actamat.2011.09.055) [Google Scholar]
- 17.Abolghasem S, Basu S, Shankar MR. 2013. Quantifying the progression of dynamic recrystallization in severe shear deformation at high strain rates. J. Mater. Res. 28, 2056–2069. (doi:10.1557/jmr.2013.201) [Google Scholar]
- 18.Hughes DA, Hansen N. 2000. Microstructure and strength of nickel at large strains. Acta Mater. 48, 2985–3004. (doi:10.1016/S1359-6454(00)00082-3) [Google Scholar]
- 19.Darling KA, Tschopp MA, Roberts AJ, Ligda JP, Kecskes LJ. 2013. Enhancing grain refinement in polycrystalline materials using surface mechanical attrition treatment at cryogenic temperatures. Scr. Mater. 69, 461–464. (doi:10.1016/j.scriptamat.2013.05.036) [Google Scholar]
- 20.Faurie D, Renault PO, Bourhis EL, Goudeau P. 2006. Study of texture effect on elastic properties of Au thin films by X-ray diffraction and in situ tensile testing. Acta Mater. 54, 4503–4513. (doi:10.1016/j.actamat.2006.05.036) [Google Scholar]
- 21.Du F, Yadav S, Moreno C, Murthy TG, Saldana C. 2014. Incipient straining in severe plastic deformation methods. J. Mater. Res. 29, 718–728. (doi:10.1557/jmr.2014.26) [Google Scholar]
- 22.Hielscher R, Schaeben H. 2008. A novel pole figure inversion method: specification of the MTEX algorithm. J. Appl. Crystallogr. 41, 1024–1037. (doi:10.1107/S0021889808030112) [Google Scholar]
- 23.ABAQUS 6.14. 2014. ABAQUS Documentation. Providence, RI: Dassault Systèmes Simulia Corp. [Google Scholar]
- 24.Johnson GR, Cook WH. 1983. A constitutive model and data for metals subjected to large strain, high strain rates and high temperatures. In Proc. of 7th Int. Symp. on Ballistics, The Hague, The Netherlands, 19–21 April. Tokyo, Japan: International Ballistics Society.
- 25.Murthy TG, Saldana C, Hudspeth M, M'saoubi R. 2014. Deformation field heterogeneity in punch indentation. Proc. R. Soc. A 470, 20130807 (doi:10.1098/rspa.2013.0807) [DOI] [PMC free article] [PubMed] [Google Scholar]
- 26.Gu CF, Tóth LS, Arzaghi M, Davies CHJ. 2011. Effect of strain path on grain refinement in severely plastically deformed copper. Scr. Mater. 64, 284–287. (doi:10.1016/j.scriptamat.2010.10.002) [Google Scholar]
- 27.Li S, Beyerlein IJ, Alexander DJ, Vogel SC. 2005. Texture evolution during multi-pass equal channel angular extrusion of copper: neutron diffraction characterization and polycrystal modeling. Acta Mater. 53, 2111–2125. (doi:10.1016/j.actamat.2005.01.023) [Google Scholar]
- 28.Hosford WF. 1993. The mechanics of crystals and textured polycrystals. New York, NY: Oxford University Press. [Google Scholar]
- 29.Lebensohn RA, Tomé CN. 1993. A self-consistent anisotropic approach for the simulation of plastic deformation and texture development of polycrystals: Application to zirconium alloys. Acta Metall. Mater. 41, 2611–2624. (doi:10.1016/0956-7151(93)90130-K) [Google Scholar]
- 30.Nes E. 1997. Modelling of work hardening and stress saturation in {FCC} metals. Progress Mater. Sci. 41, 129–193. (doi:10.1016/S0079-6425(97)00032-7) [Google Scholar]
- 31.Beyerlein IJ, Tomé CN. 2007. Modeling transients in the mechanical response of copper due to strain path changes. Int. J. Plasticity 23, 640–664. (doi:10.1016/j.ijplas.2006.08.001) [Google Scholar]
- 32.Sabbaghianrad S, Wongsa-Ngam J, Kawasaki M, Langdon TG. 2014. An examination of the saturation microstructures achieved in ultrafine-grained metals processed by high-pressure torsion. J. Mater. Res. Technol. 3, 319–326. (doi:10.1016/j.jmrt.2014.10.002) [Google Scholar]
- 33.Guo Y, Saldana C, Compton WD, Chandrasekar S. 2011. Controlling deformation and microstructure on machined surfaces. Acta Mater. 59, 4538–4547. (doi:10.1016/j.actamat.2011.03.076) [Google Scholar]
- 34.Shekhar S, Abolghasem S, Basu S, Cai J, Shankar MR. 2012. Effect of severe plastic deformation in machining elucidated via rate-strain-microstructure mappings. J. Manuf. Sci. Eng. 134, 031008 (doi:10.1115/1.4006549) [Google Scholar]
- 35.Bronkhorst CA, Kalidindi SR, Anand L. 1992. Polycrystalline plasticity and the evolution of crystallographic texture in FCC metals. Phil. Trans. R. Soc. Lond. A 341, 443–447. (doi:10.1098/rsta.1992.0111) [Google Scholar]
- 36.Kocks UF, Tomé CN, Wenk HR. 2000. Texture and anisotropy: preferred orientations in polycrystals and their effect on materials properties. Cambridge, UK: Cambridge University Press. [Google Scholar]
- 37.Ortiz AL, Tian JW, Shaw LL, Liaw PK. 2010. Experimental study of the microstructure and stress state of shot peened and surface mechanical attrition treated nickel alloys. Scr. Mater. 62, 129–132. (doi:10.1016/j.scriptamat.2009.10.015) [Google Scholar]
- 38.Tome C, Lebensohn RA. 2009. Manual for code: visco plastic self consistent. Los Alamos, NM: Los Alamos National Laboratory. [Google Scholar]
Associated Data
This section collects any data citations, data availability statements, or supplementary materials included in this article.
Data Availability Statement
Datasets supporting this article are available upon request to Dr Christopher Saldana: christopher.saldana@me.gatech.edu.


