Abstract
Two novel 2′-deoxyadenosine (dA) analogues, Si2-dA-SCN and Si2-dA-SeCN, and two novel phenylalanine (Phe) analogues, Boc-Me-PheCH2SCN and Boc-Me-PheCH2SeCN, have been synthesized and the thiocyanate (SCN) and selenocyanate (SeCN) functional groups evaluated as vibrational reporters. The syntheses of Si2-dA-SCN and Si2-dA-SeCN were accomplished in three steps in 16% and 32% overall yields, respectively, and the syntheses of Boc-Me-PheCH2SCN and Boc-Me-PheCH2SeCN were completed in four steps in 8.9% and 2.3% overall yields, respectively. The SCN and SeCN stretch vibrational modes were shown to be sensitive to the local environment by frequency shifts and full-width half-maximum (fwhm) changes in response to tetrahydrofuran (THF) and THF/water solvent mixtures. The vibrational lifetimes of the Si2-dA-SeCN (237±12 ps) and Boc-Me-PheCH2SeCN (295±31 ps) in THF solution were determined by ultrafast infrared pump-probe spectroscopy to be 1.5 to 3 times longer than those for Si2-dA-SCN (140±6 ps) and Boc-Me-PheCH2SCN (102±4 ps). The longer lifetimes for the SeCN analogues were attributed to the better insulating effects of the heavier selenium atom compared to the sulfur atom. The solvent sensitivity and longer vibrational lifetimes compared to other vibrational reporters suggest that SCN and SeCN vibrational reporters are well suited to studying several dynamic processes including protein and nucleic acid hydration and conformational changes, however stability issues may require post-synthetic modification methods to incorporate these reporters into biomacromolecules.
Introduction
Reporter groups with unique spectroscopic signatures have been successfully employed to probe local environments, measure distances, and study dynamic processes in proteins and nucleic acids. Spectroscopic reporters that absorb in the infrared are termed vibrational reporters and have become increasingly important because of advances in two-dimensional IR (2D-IR) spectroscopic techniques.1–7 Vibrational reporter functional groups that absorb in an open window of the IR spectrum (ca. 2000–2500 cm−1) are especially useful.8–11 Specifically, in terms of unnatural amino acid (UAA) vibrational reporters, important examples include cyanophenylalanine;12 azidomethylphenylalanine;13, 14 methionine-d3;15 an isonitrile analogue of alanine;16 a thiocyanate analogue of cysteine;17 cyanate, thiocyanate, and selenocyanate analogues of proline;18 and a metal-carbonyl-triazole analogue of homoalanine19 (Figure 1a–1g, respectively). With the exception of the isonitrile, cyanate, and selenocyanate reporters, all of these vibrational reporters have been successfully incorporated into proteins.
Figure 1.
Vibrational reporters (in blue) with absorptions in an open window of the infrared (a) cyanophenylalanine;12 (b) azidomethylphenylalanine;13, 14 (c) methionine-d3;15 (d) isonitrile analogue of alanine;16 (e) thiocyanate analogue of cysteine;17 (f) cyanate (X = O), thiocyanate (X = S), selenocyanate (X = Se) analogues of proline;18 (g) metal-carbonyl-triazole analogue of homoalanine.19 The proline cyanate (OCN) analogue was too unstable to be studied experimentally.
When selecting a reporter the goals of the specific experiment and the relative strengths of the reporter need to be carefully considered. Important parameters of vibrational reporters include the magnitude of perturbation it will cause, the strength of the signal (transition dipole), and the vibrational lifetime. These parameters will determine, respectively, how closely the experiment represents the native system, how easily the signal can be detected under physiologically relevant conditions, and the duration of dynamic processes that can be observed. Table 1 displays an approximate ranking of these vibrational reporters with respect to each of these parameters. It is clear that the ideal vibrational reporter has not been developed to date. For example, while the C–D bond vibrational reporters15, 20, 21 are the least likely to perturb the native protein structure, they have some of the shortest vibrational lifetimes.22 On the other hand, metal carbonyls5, 19, 23, 24 have the largest transition dipole strengths and intermediate values for vibrational lifetimes, but are also the bulkiest reporters sterically and therefore the most likely to cause perturbations of the native structure. Isonitriles are small and have intermediate values for transition dipoles and vibrational lifetimes, however it is unknown if these reporters will be able to be effectively incorporated into protein and nucleic acid systems.16 Finally, thiocyanates17, 25–28 and especially selenocyanates29, 30 have, based upon initial literature reports,18, 31 the longest vibrational lifetimes and intermediate size making them promising candidates in need of further investigation. Herein, the utility of these reporters will be expanded upon.
Table 1.
Relative Ranking of Vibrational Reporters[a]
| Steric Perturbative Effects | Transition Dipole Strength | Vibrational Lifetime | |
|---|---|---|---|
| Most favorable | CD | CpM(CO)3[b] | SeCN |
| CN | N3 | SCN | |
| NC | NC | CpM(CO)3 | |
| N3 | NC | ||
| SCN | CN, SCN, SeCN | ||
| SeCN | |||
| Least favorable | CpM(CO)3 | CD | CN, N3, CD |
Results and Discussion
Synthetic Chemistry
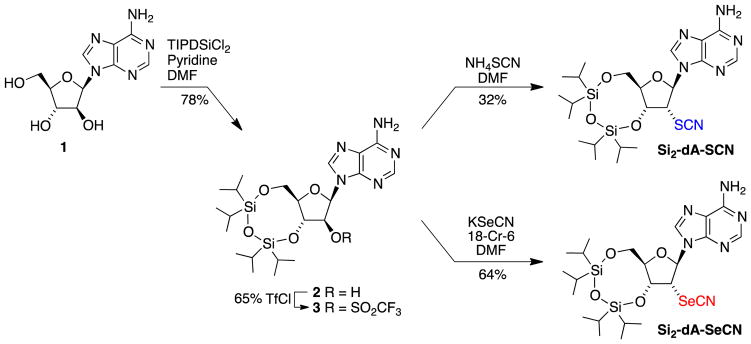
The syntheses of the two 2′-deoxyadenosine (dA) analogues began with the simultaneous protection of the 3′- and 5′-hydroxyl groups of arabinosyl adenine 1 with the tetraisopropyldisiloxyl group (78%) and conversion of the 2′-hydroxyl group to the triflate (65%) following literature procedures (Scheme 1). The syntheses diverged in the last step where SN2 displacement of the triflate with thiocyanate provided Si2-dA-SCN (32%) and displacement with selenocyanate provided Si2-dA-SeCN (64%). Attempts to remove the silicon protecting groups under acidic or basic conditions led to the decomposition of the thiocyanate and selenocyanate groups. A possible cause for the instability of these groups in the nucleoside analogues is the presence of the adjacent 3′-hydroxyl group as previously observed in related systems.32
Scheme 1.
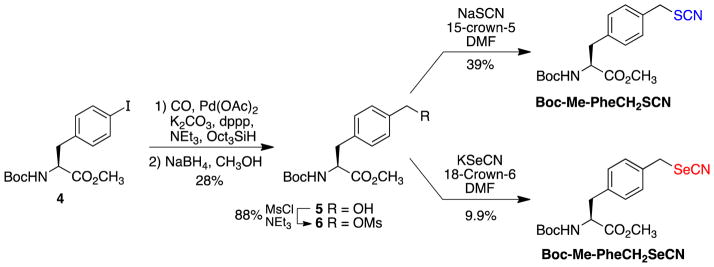
The syntheses of the two phenylalanine (Phe) analogues began with the palladium-catalyzed carbonylation of known iodo-Phe 4 to give the aldehyde, which was then reduced with sodium borohydride to give alcohol 5 in 28% for the two steps (Scheme 2). Conversion of alcohol 5 to mesylate 6 proceeded smoothly with an 88% yield. As with the dA analogues, the syntheses diverged in the last step where SN2 displacement of the mesylate with thiocyanate provided Boc-Me-PheCH2SCN (39%) and displacement with selenocyanate provided Boc-Me-PheCH2SeCN (9.9%). Attempts to hydrolyze the ester of Boc-Me-PheCH2SeCN led to the loss of the selenocyanate group. Mass spectra evidence suggests that in this analogue the nitrile group was lost and a diselenide product formed, i.e. a mass of 517 Da was observed with an isotope pattern that is consistent with a structure represented by PheCH2Se-SeCH2Phe (see Electronic Supplementary Information). Preliminary results suggest that these Phe analogues containing SCN and SeCN groups are stable to slightly acidic conditions.
Scheme 2.
Linear Infrared Spectroscopy
Using this set of unnatural nucleosides and amino acids, the IR extinction coefficients for the SCN or the SeCN stretch vibration were determined to be in the range of ~50–120 M−1cm−1. FTIR spectroscopic studies were performed to evaluate the solvent sensitivity of the thiocyanate and selenocyanate moieties as IR reporters. Figure 2 shows the IR absorbance bands resulting from the SCN or the SeCN stretch vibration of Si2-dA-SCN, Si2-dA-SeCN, Boc-Me-PheCH2SCN, and Boc-Me-PheCH2SeCN in tetrahydrofuran (THF) solution in the 2120–2200 cm−1 region. The SCN vibrational stretching frequencies of Si2-dA-SCN and Boc-Me-PheCH2SCN are 2157.0 cm−1 and 2154.6 cm−1, respectively, while the SeCN vibrational stretching frequencies are 2154.1 cm−1 and 2151.2 cm−1 for Si2-dA-SeCN and Boc-Me-PheCH2SeCN, respectively. These vibrational frequencies are similar to those previously reported for proline analogues containing SCN and SeCN vibrational reporters (Figure 1f).18 Overall, the SCN stretch vibrations are blue-shifted relative to the corresponding SeCN stretch vibrations. The IR absorbance bands for these vibrational reporters are relatively symmetrical and narrow as illustrated by the full width half maximum (fwhm) values of 7.1 cm−1 for Si2-dA-SCN, Si2-dA-SeCN, and Boc-Me-PheCH2SeCN and the fwhm of 6.6 cm−1 for Boc-Me-PheCH2SCN. These features of the IR bands (symmetrical and narrow) are beneficial in the correlation of absorption frequency and local environment. This is in stark contrast to the complicated absorption profiles observed for other vibration reporter modified molecules such as phenyl cyanate and 3-azido-pyridine.33–35
Figure 2.
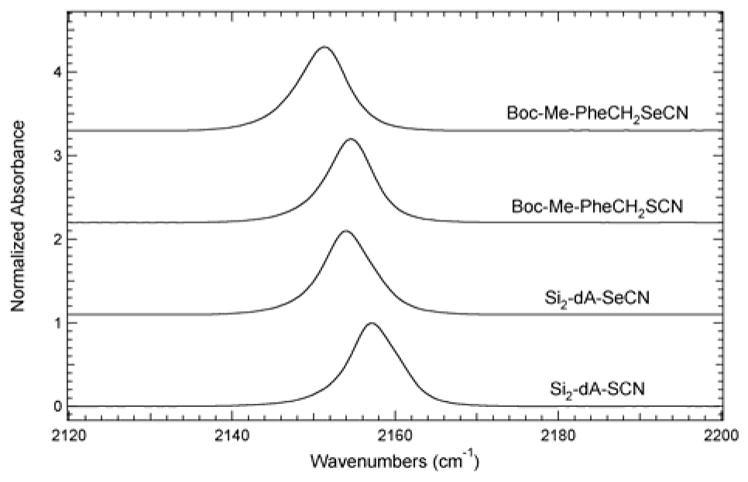
FTIR absorbance spectra of Si2-dA-SCN, Si2-dA-SeCN, Boc-Me-PheCH2SCN, and Boc-Me-PheCH2SeCN dissolved in THF at a concentration of 40 mM. The spectra were recorded at 25 °C, baseline corrected, and intensity normalized.
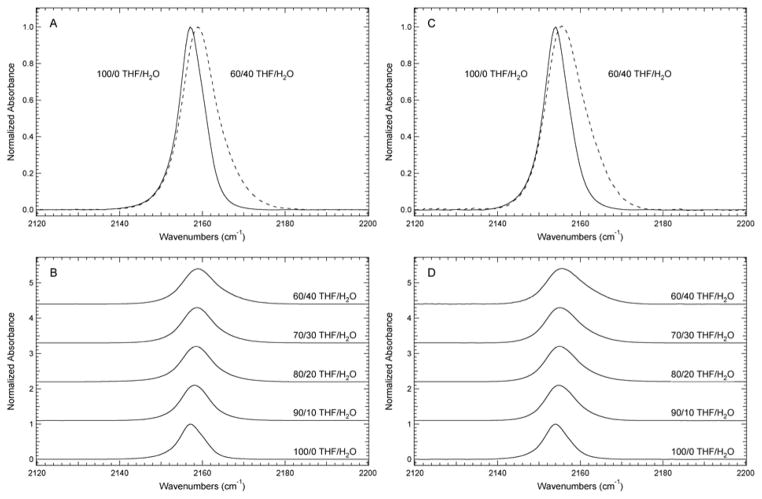
FTIR solvent studies in mixtures of THF and water were conducted to test the sensitivity of these vibrational reporters to their local hydration environment. The SCN and SeCN IR absorbance bands in Si2-dA-SCN and Si2-dA-SeCN undergo a monotonic increase in position and fwhm with increasing percent water relative to pure THF as shown in Figure 3. For Si2-dA-SCN, the central frequency of the SCN vibrational transition blue shifts from 2157.0 cm−1 in THF to 2158.9 cm−1 in 40% (v/v) H2O/THF and broadens from 7.1 to 9.6 cm−1 over the same range. The SeCN vibrational transition in Si2-dA-SeCN shifts similarly from 2154.1 cm−1 in THF to 2155.6 cm−1 in 40% (v/v) H2O/THF. This band broadens from 7.1 to 10.9 cm−1 over the same range, which is similar to Si2-dA-SCN although the broadening is slightly more pronounced in the SeCN analogue. Solubility limitations prevented investigation at higher percentages of water, however the observed trends are similar to previous studies of vibrational reporters such as N3, CN, SCN, and SeCN in terms of the impact hydrogen bonding (H-bonding) with H2O has on the observed frequency and fwhm of the vibrational reporter absorbance band. 17, 36, 37 Extrapolating the observed solvent-induced frequency shifts to pure water as the solvent for Si2-dA-SCN and Si2-dA-SeCN suggests a slightly smaller, but similar dynamic range of the SCN and SeCN reporters when compared to CN reporters, and a smaller range than those reported for N3 reporters in similar molecules.38
Figure 3.
FTIR absorbance spectra of (A) Si2-dA-SCN and (C) Si2-dA-SeCN dissolved in THF and 40% (v/v) H2O/THF. FTIR absorbance spectra of (B) Si2-dA-SCN and (D) Si2-dA-SeCN dissolved in H2O/THF mixtures from 0–40% (v/v) in 10% intervals. The spectra were recorded at 25°C, baseline corrected, and intensity normalized. The concentration of the samples was 40 mM except for the 40% (v/v) H2O/THF samples, which were 30 mM due to solubility limitations.
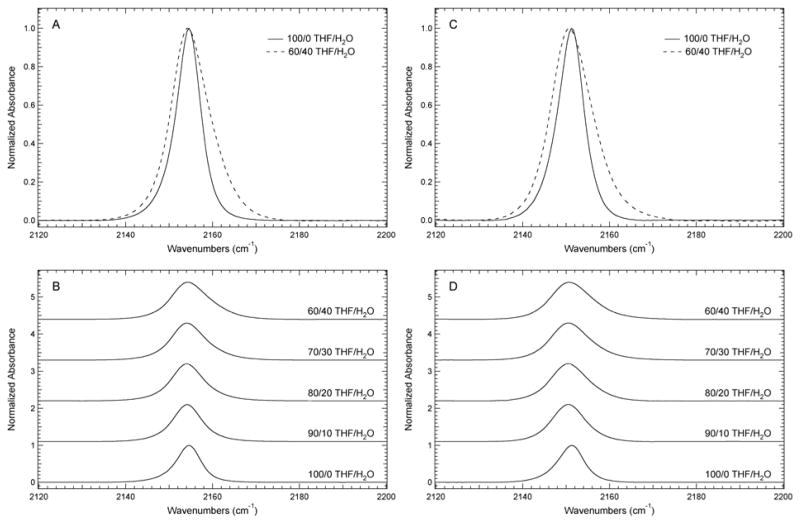
In the Phe analogues, the SCN and SeCN IR absorbance bands undergo a small decrease in frequency when going from THF to 10% H2O/THF, and then the frequency remains constant with increasing percent water up to 40% H2O/THF (Figure 4). However, there is a significant and monotonic increase in the fwhm with increasing percent water that is more substantial than the broadening effect observed in the SCN and SeCN bands in the dA analogues described above. For Boc-Me-PheCH2SCN, the central frequency of the SCN band red-shifts from 2154.6 cm−1 in THF to 2154.1 cm−1 in 40% (v/v) H2O/THF and the fwhm increases from 6.6 to 10.3 cm−1 over the same range. The SeCN absorbance band of Boc-Me-PheCH2SeCN follows a similar trend over the 0–40% (v/v) H2O/THF range, shifting from 2151.2 to 2150.7 cm−1, and broadening from 7.1 to 11.0 cm−1. Although the red-shift with increasing water percentages is somewhat unusual, it is not unprecedented as a similar small red-shift along with a significant increase in fwhm has been observed in other nitrile vibrational reporters such as a 5-cyanotryptophan analogue.39 Cho et al. observed a similar red-shift with acetonitrile and proposed that, in general, the solvent-dependent shift is determined by the geometry of the hydrogen bonding interactions between the nitrile group and H2O.36, 37 Specifically, σ-bonding with the lone-pair of electrons on the nitrogen atom leads to the typical blue-shift of the absorbance band, while π-bonding leads to red-shifts, which was observed here for the SCN and SeCN bands of Boc-Me-PheCH2SCN and Boc-Me-PheCH2SeCN.11 The apparent difference in the hydrogen bonding geometry between the Phe analogues and the dA analogues demonstrates that structural features of the molecule can influence the solvent-dependency of the stretch vibrational mode and further highlights the sensitivity of these vibrational reporters to their local environment.
Figure 4.
FTIR absorbance spectra (A) Boc-Me-PheCH2SCN and (C) Boc-Me-PheCH2SeCN dissolved in THF and 40% (v/v) H2O/THF. FTIR absorbance spectra of (B) Boc-Me-PheCH2SCN and (D) Boc-Me-PheCH2SeCN in H2O/THF mixtures from 0–40% (v/v) dissolved in 10% intervals. The spectra were recorded at 25 °C, baseline corrected, and intensity normalized. The concentration of the samples was 40 mM.
Vibrational Lifetimes
The vibrational lifetimes of CN for Si2-dA-SCN and Si2-dA-SeCN along with Boc-Me-PheCH2SCN and Boc-Me-PheCH2SeCN in THF were measured using ultrafast IR pump-probe spectroscopy. The transient absorption spectra of Si2-dA-SeCN and Boc-Me-PhCH2SCN are shown in Figure 5. These spectra are representative of the quality of data measured for acquiring the kinetic traces (see Electronic Supplementary Information for Si2-dA-SCN and Boc-Me-PheCH2SeCN). The ground state bleach (ν= 0 → 1 transition) for Si2-dA-SCN and Si2-dA-SeCN are at 2156 cm−1 and 2150 cm−1, respectively, with their corresponding excited state absorptions (ν = 1 → 2) shifted to 2135 cm−1 and 2136 cm−1, respectively. Similarly, the ground state bleach transitions of Boc-Me-PheCH2SCN and Boc-Me-PheCH2SeCN occur at 2153 cm−1 and 2149 cm−1 and their corresponding excited state absorption bands are observed at 2132 cm−1 and 2121 cm−1. The t = 0 and the t = 80 ps transient absorption spectra are presented illustrating the decrease in the intensity of the ν = 1 → 2 transition observed as function of time. The spectra collected prior to t = 0 are also included for each case to demonstrate the baseline associated with the each measurement. It is expected that the heating effects in THF do not play a significant role in the kinetic data, indicated by the lack of solvent contributions observed in the transient absorption spectra. It should be noted that some stray light is likely detected in the signal direction resulting in small artifacts within the pump probe spectra. However, the overall values of the vibrational lifetimes should not be significantly affected as indicated by our global analysis approach (see SI). The errors associated with these lifetimes based on the quality of fit can slightly be affected by the presence of small amounts of scattered light.
Figure 5.
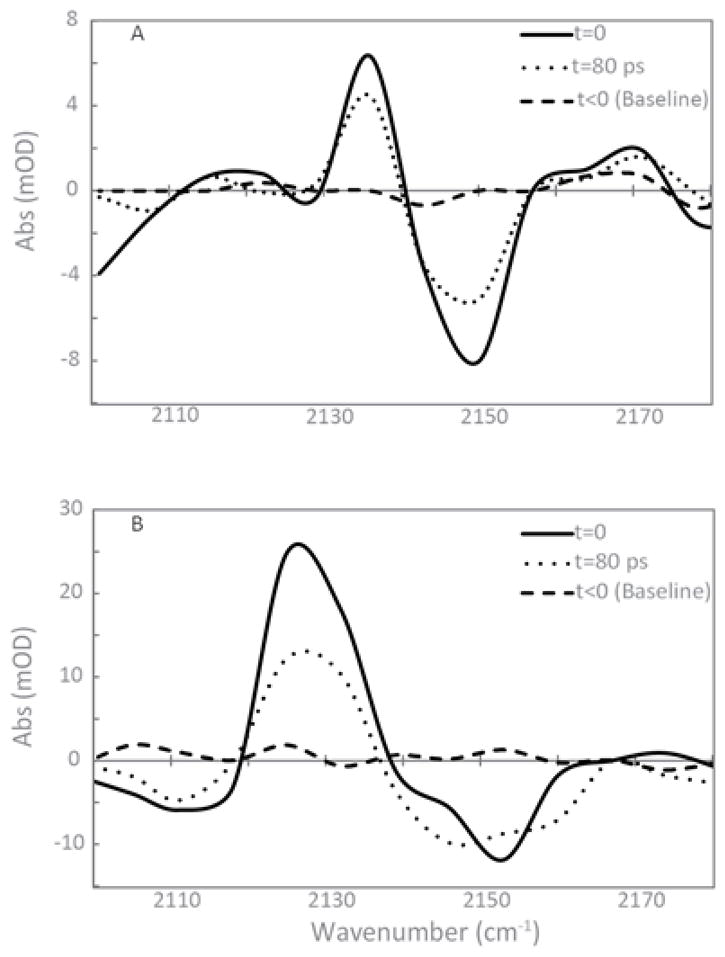
Transient absorption spectra of (A) Si2-dA-SeCN and (B) Boc-Me-PhCH2SCN at t = 0 and 80 ps. A single linear baseline correction was applied to each spectrum for every compound. The spectra collected prior to t = 0 is also shown for each measurement.
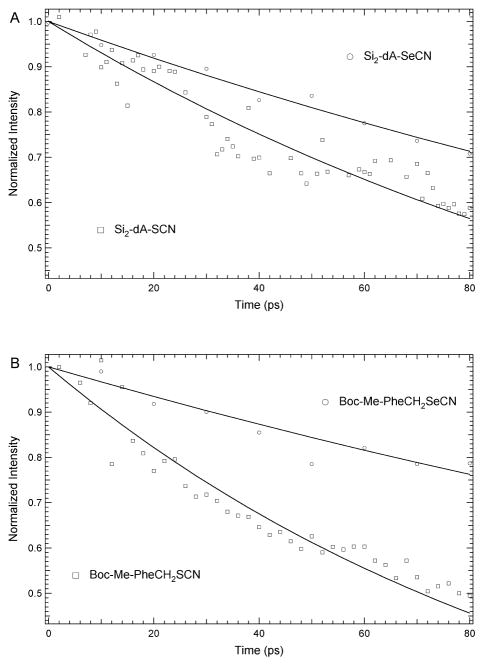
Using a global analysis approach, the vibrational lifetimes at multiple frequencies within the excited state absorption band of each sample were measured. The determined decay values were similar to those measured by taking the trace of the peak maximum of the SCN or SeCN signals as a function of time. The normalized intensity decay is shown in Figure 6. The observed vibrational population decays for Si2-dA-SCN and Boc-Me-PheCH2SCN were 140±6 and 102±4 ps, respectively. The population decays of the SeCN vibrational modes were 1.5 to 3 times longer than that of SCN, having a value of 237±12 and 295±31 ps for Si2-dA-SeCN and Boc-Me-PheCH2SeCN compounds, respectively. The observed lifetimes are similar to the timescales observed by Cho et al. for comparable proline analogues (Figure 1f)18 and by Bredenbeck et al. for methyl thiocyanate in THF.31
Figure 6.
Population relaxation decays, normalized to the intensity at t = 0, of transient absorption signals for SeCN (empty circles) and SCN (empty squares) in (A) Si2-dA-SeCN and Si2-dA-SCN and (B) Boc-Me-PheCH2SeCN and Boc-Me-PheCH2SCN at the peak maximum from 0 to 80 ps.
These types of site-specific IR reporters have lifetimes greater than an order of magnitude larger than typical azide and nitrile reporters,40, 41 where the population decays are between 1–5 ps. Although azide and nitrile vibrational reporters are quite useful for detecting water dynamics, hydrogen-bond making/breaking and small motions,41–43 the observation window is limited and often cannot detect dynamics on longer timescales. However, by adding a bridging atom between the nitrile and the compound of interest, it has been shown here, as well as by others,18 that the lifetimes can be extended into the tens to hundreds of picoseconds regime. This increase in lifetime is due to the decrease in intramolecular energy transfer to other vibrational modes of the compound that the localized nitrile transition is attached. Acting as barrier to the flow of vibrational energy transfer, the heavy S and Se atoms and the somewhat bent configuration limit the possible relaxation pathways.18 Although the intramolecular energy sink of the vibrational motions is hindered, the intermolecular energy transfer to the solvent molecules is still a viable pathway.
Since the vibrational lifetimes represent when the signal strength has decayed by approximately 1/e, it is expected that the observation window will be opened for hundreds of picoseconds to even longer timescales. By reaching these timescales, the vibrational dynamics of these reporters can be utilized to detect motions beyond simple bond rotations to larger scale structural changes, such as folding-unfolding dynamics in RNA molecules or protein-protein binding equilibrium dynamics. However, it should be noted that the transition dipole strength also plays a significant role in the observation windows. Since the oscillator strength of these SCN and SeCN reporters are typically an order of magnitude less than N3, it makes nonlinear spectroscopy experiments more challenging to obtain an adequate signal. The quartic dependence of 2D IR spectroscopy on the transition dipole strength in combination with the intrinsically narrow transitions can offer an avenue to detect these typically weak transitions. Despite these advantages, the transition dipole strength still creates challenges in detecting these signals, even in 3rd order spectroscopy. In general, the specific reporter must be chosen based upon what best suits the desired application and scientific question being studied.11
Conclusion
In this work two novel dA analogues and two novel Phe analogues containing SCN and SeCN reporters were synthesized. Although the ideal vibrational reporter has not yet been developed, SCN and SeCN groups are relatively small in size, have similar sensitivities to hydration as CN groups, and offer significant advantages over all other current reporters in terms of vibrational lifetimes. The vibrational lifetimes of the SCN analogues were determined by ultrafast IR pump-probe spectroscopy to be in the 102–140 ps range, which was 1.5 to 3 times shorter than those for the SeCN analogues, which were in the 237–295 ps range. With the observed lifetimes, these vibrational reporters are expected to measure dynamics events out to approximately 500 ps for thiocyanate reporters and approximately 1.4 ns for selenocyanate reporters, based on the decay of the signal strength to ~1% of its maximum amplitude. However, in practice, the signal-to-noise ratio can create challenges for the detection of these weak signals at much longer timescales. Nevertheless, these reporters still have the potential to measure dynamics on timescales two orders of magnitude greater than those observed using traditional nitrile and azide reporters. The enhanced dynamic range measured for the SeCN analogues is attributed to the superior insulating effects of the heavier selenium atom compared to the sulfur atom. Thiocyanate reporters have been routinely incorporated into proteins but selenocyanate reporters have not yet been incorporated. The problems encountered herein with deprotection of the SeCN analogues suggest that incorporation of these vibrational reporters into proteins may require posttranslational modification to account for the stability of this group.
Supplementary Material
Acknowledgments
We thank Rui Song and Hongyi Kyle Pan for initial synthetic work on dA analogues; Ken Hess for mass spectral (ESI) analyses; Lisa Mertzman for ordering supplies; and Beth Buckwalter for acquiring NMR spectra. This work was supported by F&M Hackman funds, F&M Eyler Funds, NSF (CHE-1053946) to SHB and NIH (R15GM093330-02) to EEF and SHB.
References
- 1.Demirdoven N, Cheatum CM, Chung HS, Khalil M, Knoester J, Tokmakoff A. J Am Chem Soc. 2004;126:7981–7990. doi: 10.1021/ja049811j. [DOI] [PubMed] [Google Scholar]
- 2.Bandaria JN, Dutta S, Hill SE, Kohen A, Cheatum CM. J Am Chem Soc. 2008;130:22–23. doi: 10.1021/ja077599o. [DOI] [PMC free article] [PubMed] [Google Scholar]
- 3.Kim YS, Hochstrasser RM. J Phys Chem B. 2009;113:8231–8251. doi: 10.1021/jp8113978. [DOI] [PMC free article] [PubMed] [Google Scholar]
- 4.Cho M. Two-Dimensional Optical Spectroscopy. CRC Press; Boca Raton: 2009. [Google Scholar]
- 5.Baiz CR, Mcrobbie PL, Anna JM, Geva E, Kubarych KJ. Acc Chem Res. 2009;42:1395–1404. doi: 10.1021/ar9000263. [DOI] [PubMed] [Google Scholar]
- 6.Hamm P, Zanni MT. Concepts and Methods of 2D Infrared Spectroscopy. Cambridge; New York: 2011. [Google Scholar]
- 7.Chung JK, Thielges MC, Fayer MD. Proc Natl Acad Sci USA. 2011;108:3578–3583. doi: 10.1073/pnas.1100587108. [DOI] [PMC free article] [PubMed] [Google Scholar]
- 8.Suydam IT, Boxer SG. Biochemistry. 2003;42:12050–12055. doi: 10.1021/bi0352926. [DOI] [PubMed] [Google Scholar]
- 9.Lindquist BA, Furse KE, Corcelli SA. Phys Chem Chem Phys. 2009;11:8119–8132. doi: 10.1039/b908588b. [DOI] [PubMed] [Google Scholar]
- 10.Waegele MM, Culik RM, Gai F. J Phys Chem Lett. 2011;2:2598–2609. doi: 10.1021/jz201161b. [DOI] [PMC free article] [PubMed] [Google Scholar]
- 11.Kim H, Cho M. Chem Rev. 2013;113:5817–5847. doi: 10.1021/cr3005185. [DOI] [PubMed] [Google Scholar]
- 12.Getahun Z, Huang CY, Wang T, De Leon B, DeGrado WF, Gai F. J Am Chem Soc. 2003;125:405–411. doi: 10.1021/ja0285262. [DOI] [PubMed] [Google Scholar]
- 13.Bazewicz CG, Liskov MT, Hines KJ, Brewer SH. J Phys Chem B. 2013;117:8987–8993. doi: 10.1021/jp4052598. [DOI] [PMC free article] [PubMed] [Google Scholar]
- 14.Tookmanian EM, Fenlon EE, Brewer SH. RSC Adv. 2015;5:1274–1281. doi: 10.1039/C4RA14244F. [DOI] [PMC free article] [PubMed] [Google Scholar]
- 15.Adhikary R, Zimmermann J, Dawson PE, Romesberg FE. Chemphyschem. 2014;15:849–853. doi: 10.1002/cphc.201400017. [DOI] [PubMed] [Google Scholar]
- 16.Maj M, Ahn C, Kossowska D, Park K, Kwak K, Han H, Cho M. Phys Chem Chem Phys. 2015;17:11770–11778. doi: 10.1039/c5cp00454c. [DOI] [PubMed] [Google Scholar]
- 17.Fafarman AT, Webb LJ, Chuang JI, Boxer SG. J Am Chem Soc. 2006;128:13356–13357. doi: 10.1021/ja0650403. [DOI] [PMC free article] [PubMed] [Google Scholar]
- 18.Park KH, Jeon J, Park Y, Lee S, Kwon HJ, Joo C, Park S, Han H, Cho M. J Phys Chem Lett. 2013;4:2105–2110. [Google Scholar]
- 19.Peran I, Oudenhoven T, Woys AM, Watson MD, Zhang TQO, Carrico I, Zanni MT, Raleigh DP. J Phys Chem B. 2014;118:7946–7953. doi: 10.1021/jp5008279. [DOI] [PMC free article] [PubMed] [Google Scholar]
- 20.Kinnaman CS, Cremeens ME, Romesberg FE, Corcelli SA. J Am Chem Soc. 2006;128:13334–13335. doi: 10.1021/ja064468z. [DOI] [PubMed] [Google Scholar]
- 21.Zimmermann J, Romesberg FE. Protein Dynamics. Humana Press; 2014. [Google Scholar]
- 22.Naraharisetty SRG, Kasyanenko VM, Zimmermann J, Thielges MC, Romesberg FE, Rubtsov IV. J Phys Chem B. 2009;113:4940–4946. doi: 10.1021/jp8112446. [DOI] [PubMed] [Google Scholar]
- 23.King JT, Kubarych KJ. J Am Chem Soc. 2012;134:18705–18712. doi: 10.1021/ja307401r. [DOI] [PubMed] [Google Scholar]
- 24.Woys AM, Mukherjee SS, Skoff DR, Moran SD, Zanni MT. J Phys Chem B. 2013;117:5009–5018. doi: 10.1021/jp402946c. [DOI] [PMC free article] [PubMed] [Google Scholar]
- 25.Maienschein-Cline MG, Londergan CH. J Phys Chem A. 2007;111:10020–10025. doi: 10.1021/jp0761158. [DOI] [PubMed] [Google Scholar]
- 26.McMahon HA, Alfieri KN, Clark CAA, Londergan CH. J Phys Chem Lett. 2010;1:850–855. doi: 10.1021/jz1000177. [DOI] [PMC free article] [PubMed] [Google Scholar]
- 27.Rock W, Li YL, Pagano P, Cheatum CM. J Phys Chem A. 2013;117:6073–6083. doi: 10.1021/jp312817t. [DOI] [PMC free article] [PubMed] [Google Scholar]
- 28.Walker DM, Hayes EC, Webb LJ. Phys Chem Chem Phys. 2013;15:12241–12252. doi: 10.1039/c3cp51284c. [DOI] [PubMed] [Google Scholar]
- 29.Guillemin JC. Curr Org Chem. 2011;15:1670–1687. [Google Scholar]
- 30.Toshimitsu A. Patai’s Chemistry of Functional Groups. Wiley; 2013. Organic Selenocyanates, Tellurocyanates and Related Compounds. [Google Scholar]
- 31.van Wilderen LJ, Kern-Michler D, Muller-Werkmeister HM, Bredenbeck J. Phys Chem Chem Phys. 2014;16:19643–19653. doi: 10.1039/c4cp01498g. [DOI] [PubMed] [Google Scholar]
- 32.Chambert S, Thomasson F, Decout JL. J Org Chem. 2002;67:1898–1904. doi: 10.1021/jo016200q. [DOI] [PubMed] [Google Scholar]
- 33.Tucker MJ, Kim YS, Hochstrasser RM. Chem Phys Lett. 2009;470:80–84. doi: 10.1016/j.cplett.2009.01.025. [DOI] [PMC free article] [PubMed] [Google Scholar]
- 34.Nydegger MW, Dutta S, Cheatum CM. J Chem Phys. 2010;133:134506. doi: 10.1063/1.3483688. [DOI] [PubMed] [Google Scholar]
- 35.Lipkin JS, Song R, Fenlon EE, Brewer SH. J Phys Chem Lett. 2011;2:1672–1676. doi: 10.1021/jz2006447. [DOI] [PMC free article] [PubMed] [Google Scholar]
- 36.Choi JH, Oh KI, Lee H, Lee C, Cho M. J Chem Phys. 2008;128:134506. doi: 10.1063/1.2844787. [DOI] [PubMed] [Google Scholar]
- 37.Oh KI, Choi JH, Lee JH, Han JB, Lee H, Cho M. J Chem Phys. 2008;128:154504, 154501–154510. doi: 10.1063/1.2904558. [DOI] [PubMed] [Google Scholar]
- 38.Gai XS, Coutifaris BA, Brewer SH, Fenlon EE. Phys Chem Chem Phys. 2011;13:5926–5930. doi: 10.1039/c0cp02774j. [DOI] [PMC free article] [PubMed] [Google Scholar]
- 39.Waegele MM, Tucker MJ, Gai F. Chem Phys Lett. 2009;478:249–253. doi: 10.1016/j.cplett.2009.07.058. [DOI] [PMC free article] [PubMed] [Google Scholar]
- 40.Urbanek DC, Vorobyev DY, Serrano AL, Gai F, Hochstrasser RM. J Phys Chem Lett. 2010;1:3311–3315. doi: 10.1021/jz101367d. [DOI] [PMC free article] [PubMed] [Google Scholar]
- 41.Tucker MJ, Gai XS, Fenlon EE, Brewer SH, Hochstrasser RM. Phys Chem Chem Phys. 2011;13:2237–2241. doi: 10.1039/c0cp01625j. [DOI] [PMC free article] [PubMed] [Google Scholar]
- 42.Kim YS, Hochstrasser RM. Proc Natl Acad Sci USA. 2005;102:11185–11190. doi: 10.1073/pnas.0504865102. [DOI] [PMC free article] [PubMed] [Google Scholar]
- 43.Bagchi S, Charnley AK, Smith AB, Hochstrasser RM. J Phys Chem B. 2009;113:8412–8417. doi: 10.1021/jp811168x. [DOI] [PMC free article] [PubMed] [Google Scholar]
Associated Data
This section collects any data citations, data availability statements, or supplementary materials included in this article.


