Abstract
Biological clocks are self-sustained oscillators that adjust their phase to the daily environmental cycles in a process known as entrainment. Molecular dissection and mathematical modeling of biological oscillators have progressed quite far, but quantitative insights on the entrainment of clocks are relatively sparse. We simultaneously tracked the phases of hundreds of synthetic genetic oscillators relative to a common external stimulus to map the entrainment regions predicted by a detailed model of the clock. Synthetic oscillators were frequency-locked in wide intervals of the external period and showed higher-order resonance. Computational simulations indicated that natural oscillators may contain a positive-feedback loop to robustly adapt to environmental cycles.
One focus of synthetic biology is the genome-scale synthesis of DNA for the creation of novel cell types (1). This approach could lead to cells with highly reduced genomic complexity, as genes that govern the ability to adapt to multiple environments are eliminated to construct specialized organisms for bio-technology and basic research. Another branch of synthetic biology involves the engineering of gene circuits, in which mathematical tools are developed to systematically design and construct circuits from a standardized list of biological parts (2–11). The engineering approach allows the construction of circuits that mimic natural networks to understand the design principles that underlie a given network motif (12, 13). In this context, molecular clocks are a natural application of synthetic biology, and recent efforts have led to a deeper understanding of the robustness and reliability of time-keeping at the intracellular level (3, 7, 8, 10).
Almost all organisms use molecular clocks to keep their physiology and behavior in synchrony with their surroundings (14). Such coordination is mediated by entrainment, whereby a population of intracellular clocks oscillate in unison guided by a common external signal (14, 15). Quantitative descriptions of entrainment that arise from the tight coupling of computational modeling and experimentation are challenging to develop because of the complexity of the underlying gene-regulatory networks, in which dozens of genes are involved in the core clocks and hundreds more act as their modifiers (16). Moreover, a quantitative description of inherently stochastic circadian clocks requires abundant long-term single-cell data, which are technically challenging to obtain (17–19). We combined synthetic biology, microfluidic technology (20), and computational modeling to investigate the fundamental process of entrainment at the genetic level.
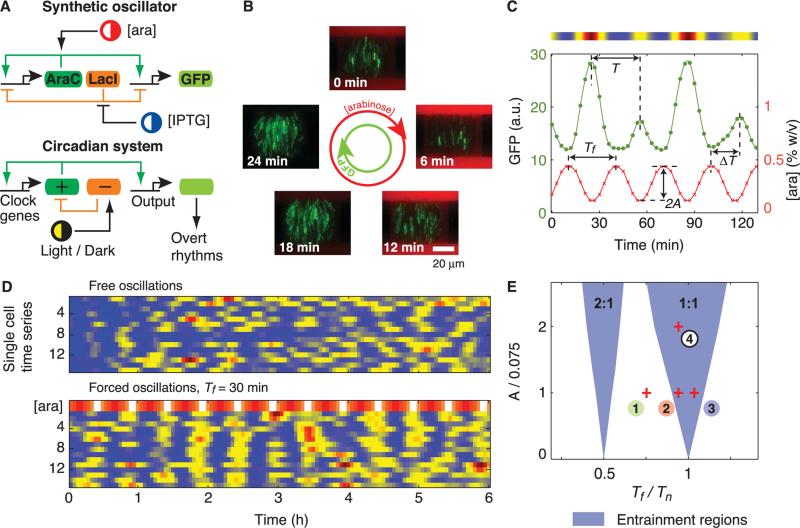
We used a synthetic oscillator that has coupled positive- and negative-feedback loops that are characteristic of many circadian gene-regulatory networks (Fig. 1A) (7). The green fluorescent protein (GFP) was used as a readout of the transcriptional activation state of the promoter that drives the expression of the oscillator genes. We stimulated the expression of the oscillator genes (araC and lacI) by periodically modulating the concentration of the transcriptional inducer arab-inose, which acts on the positive-feedback loop. Such stimulation is referred to as the forcing of the oscillator. To generate long-term single-cell data for comparison with computational modeling, we constructed microfluidic devices in which bacterial colonies can grow exponentially for at least 150 generations (fig. S1) (21). For each experimental run, we tracked the phase of the oscillations with respect to the arabinose signal in ~1600 cells (Fig. 1B and movies S1 and S6) (21). The period of oscillations T was measured as the peak-to-peak interval in the GFP fluorescence time series. The phase difference between an oscillator and the arabinose signal was calculated as Δϕ = 2πΔT/Tf, where Tf is the period of the forcing signal and ΔT is the measured time interval between a crest of arabinose and the immediate following peak of GFP fluorescence (Fig. 1C). Entrainment of the intracellular oscillations to the chemical signal was readily identified from color density maps of the fluorescence trajectories (Fig. 1D); by taking crests of GFP fluorescence as a marker of the phase, one can see that whereas in the autonomous set single cells are not always in phase with respect to each other, maxima in the forced colony occur almost simultaneously during most of the run.
Fig. 1.
We use single-cell data from time-lapse fluorescence experiments to investigate the entrainment of a synthetic oscillator. (A) Architectures of eukaryotic circadian clocks and bacterial synthetic oscillators contain positive- and negative-feedback loops that are sensitive to external stimuli. (B) Fluorescence images from a time-lapse experiment show coherent GFP oscillations (green) in a colony of single-cell oscillators subject to a 30-min cycle of arabinose (red) (movie S1). (C) Fluorescence time series of a single-cell oscillator (green). The concentration of arabinose (red) changes sinusoidally according to [ara](t) = 0.3 + Asin(2πt/Tf) [percent weight/volume (% w/v)], with A = 0.15% and Tf = 30 min. The intensity plot above the graph corresponds to the cell trace. a.u., arbitrary units. (D) Fluorescence intensity plots of free-running and forced oscillators. Each row in the two panels represents a single-cell trace. The top row of the forced set represents the modulated concentration of arabinose (A = 0.15%). (E) Entrainment regions indicate which forcing periods (Tf) and amplitudes (A) result in locking of the oscillator according to a deterministic model (SOM text). Entrainment of order 2:1 means that two oscillation peaks are observed for one peak of arabinose. Tn is the natural period of the oscillator. Images and cell traces shown in (B), (C) and [(D), forced oscillations] correspond to point 4. Points 1 to 3 signal some parameter values explored experimentally.
The entrainment of any self-sustained oscillator can be characterized by comparing its natural period (Tn) and phase (ϕ) to those of the external signal. When Tf is sufficiently close to the natural period of the oscillator, the oscillator can be entrained. In the entrainment regime, the period of the oscillator T is equal to Tf, and the phase difference Δϕ between the oscillator and the forcing signal is fixed. In the plane defined by the period and amplitude of the external signal (Tf, A), a triangular region near Tf/Tn = 1 indicates where the oscillator is entrained [Fig. 1E and supporting online material (SOM) text]. Entrainment may also occur near other rational values of Tf/Tn. Collectively, these regions are known as Arnold tongues. The order of locking in each region is indicated by the ratio n:m, which denotes that m oscillations of the clock correspond to n oscillations of the arabinose signal. We computed the tongues for entrainment of order 1:1 and 2:1 with a deterministic model of the synthetic oscillator (7), in which we periodically modulated the arabinose concentration.
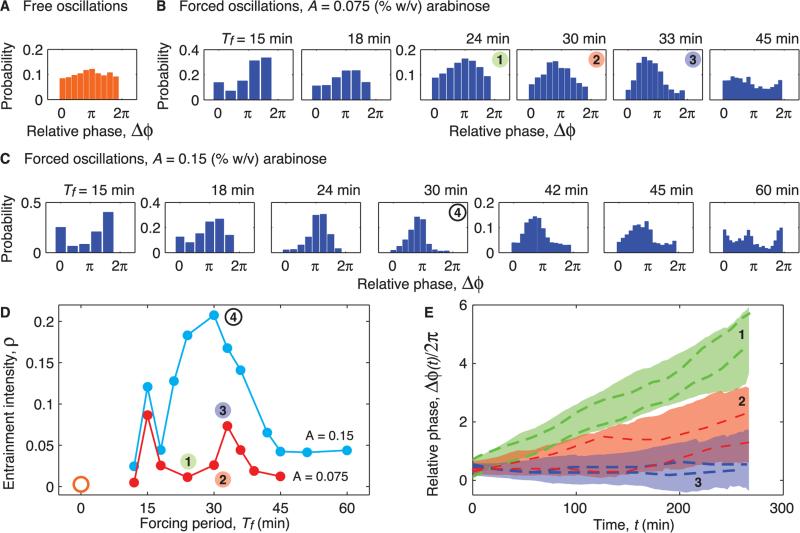
To experimentally map the entrainment regions, we first determined the natural period of the oscillator by tracking the expression of GFP of cells at constant inducer concentrations (movie S2). Because the oscillators are not synchronized with respect to each other, their phases are uniformly distributed between 0 and 2π (Fig. 2A). Similar to its naturally occurring counterparts (17, 18, 22), the synthetic oscillator shows considerable fluctuations (Fig. 3A). Given the natural period of ~32 min, we varied the period of the arabinose concentration from 6 to 60 min for two values of the amplitude. Coherent oscillations emerged over a range of periods that bounded the natural period (movie S3). Phase-locking was characterized by a narrow peak in the phase distribution (23), which became difficult to discern as the period of the signal diverged from the natural period but reappeared as the forcing period approached half of the natural period (Fig. 2B and movie S4). An increase in the forcing amplitude by a factor of 2 led to sharper distributions of the relative phase (Fig. 2C and movies S1 and S5). To quantify the degree of phase-locking, we used an entropy-based index (ρ) to characterize the width of the distributions (23); wider distributions imply less phase-locking and lead to smaller values of ρ (SOM text). Accordingly, maxima of the entrainment index appeared at both the natural period and half of the natural period (Fig. 2D).
Fig. 2.
Probability distributions of the relative phase of oscillators with respect to the external signal allow the detection of entrainment. (A) Probability distribution of the relative phase of free-running oscillators in several colonies with respect to a virtual sinusoidal signal of period Tf = 30 min. Constant concentrations of inducers were used (, ). (B) Probability distributions of the relative phase for multiple forcing periods with amplitude A = 0.075% (w/v). In the presence of the external stimulus, distributions acquired a preferred phase that depends on the forcing period Tf. (C) Same as (B) for stronger forcing with A = 0.15%. Increased amplitude sharpens the peaks of the relative phase distributions with respect to those for A = 0.075% as in Tf = 15, 30, and 45 min. (D) Intensity of entrainment as a function of the forcing period for the two values of the forcing amplitude. In each curve, two peaks centered near Tf ~ Tn = 31.8 min and Tf ~ Tn/2 = 15.9 min reveal the intervals of Tf where the phase is locked to the arabinose input. For free-running oscillators, ρ is nearly zero (orange open circle). (E) Relative phase as a function of time for three experiments shown in (B). Colored regions correspond to ±SD around the mean phase drift. Dashed lines indicate representative single-cell traces.
Fig. 3.
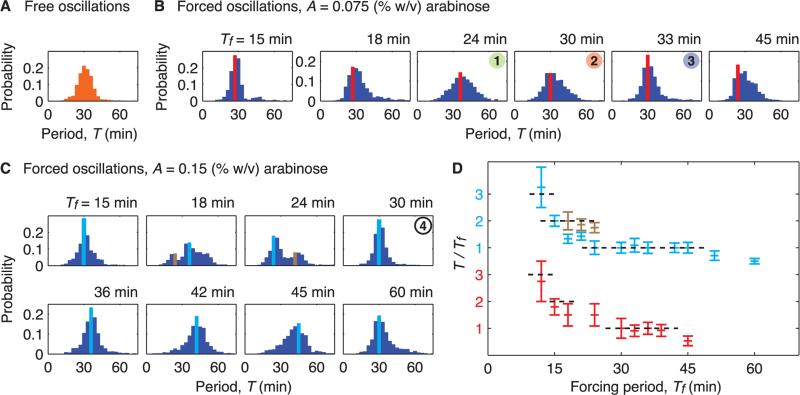
Probability distributions of the period of oscillations allow us to find the forcing periods that lead to frequency-locking. (A) Probability distribution for the period of free-running oscillators in constant concentrations of inducers (, ). In forcing experiments, the concentration of arabinose oscillates sinusoidally around . We defined the natural period as the mean period of free oscillations, Tn = 31.8 min with standard deviation δT = 5.7 min. (B) Probability distributions of the period for multiple values of the Tf with A = 0.075%. For Tf near Tn = 31.8 min or Tn/2 = 15.9 min, the dispersion of the period is the least. Red bars indicate the mode of the distributions. (C) Probability distributions of the period for multiple values of the forcing period with A = 0.15%. Period distributions for this higher amplitude can contain two modes (light blue and brown bars). (D) The ratio T/Tf as a function of Tf for the two forcing amplitudes, where T is the mode(s) of the period distributions. The intervals of the forcing period where T/Tf ~ 1,2 provided evidence for entrainment of order 1:1 and 2:1, respectively.
The flattening of phase distributions and the decay of the phase-locking index around Tf/Tn = 1/2,1 indicates the breaking of entrainment. To investigate this transition in more detail, we examined the dynamics of the oscillation phase relative to the forcing signal in single cells. We chose three values of the forcing period that cross the left boundary of the computed main Arnold tongue (Fig. 1E). We used peak positions to determine the phases of the arab-inose signal ϕara(t) and single-cell oscillations ϕc(t), and we calculated their difference Δϕ(t) = ϕara(t) – ϕc(t) (Fig. 2E). Near the center of the entrainment region (Tf = 33 min), Δϕ for most oscillators was nearly constant (Fig. 2E, blue shaded region and curves). Toward the left boundary of the tongue (Tf = 30 min), there is a slow mean phase drift with a broad distribution (Fig. 2E, red shaded area and curves); some cells exhibit phase drift (with an evidence of occasional phase slips), whereas other cells are still phase-locked. Finally, between the two Arnold tongues (Tf = 24 min), the rate of phase drift was even faster and almost uniform because the phases of most oscillators did not lock to the arabinose signal (Fig. 2E, green shaded area and curves). The continuous phase drift indicates quasi-periodic behavior outside entrainment regions, which is observed in the computation of Arnold tongues (Fig. 1E and SOM text).
We also used period distributions to characterize the response of the oscillator (Fig. 3). Forcing periods close to both the natural period and half of the natural period reduce the spread of the period distribution in a manner similar to that observed with light pulses resetting peripheral clocks (22). For a lower amplitude of the arabinose signal, oscillators were entrained over an interval of periods that was consistent with the width of the 1:1 phase-locking regime determined with the use of the entropy-based measure (Figs. 2D and 3D). For a larger forcing amplitude, the 1:1 plateau extended over a larger interval of periods, and a 2:1 plateau indicated the presence of the higher-order resonance. Some of these distributions displayed two modes, which presumably indicated simultaneous occurrence of 1:1 and 2:1 frequency-locking.
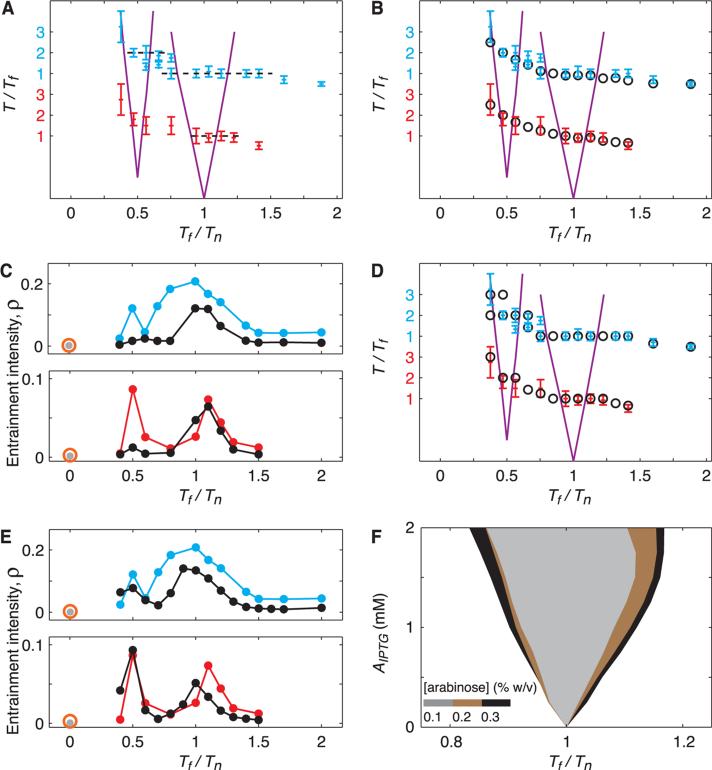
Direct comparison between our experimental results and the computed Arnold tongues indicated that the locations of the experimental entrainment plateaux correspond closely to the regions where frequency-locking is predicted (Fig. 4A). The width of the plateau increased with the amplitude of the forcing signal, as follows from classical theory (24). However, the experimental entrainment regions were consistently wider than the computed Arnold tongues. The major discrepancy between the naive model and experiment is that the model assumes that all oscillators are identical and have the same natural period, whereas the bacterial colony exhibits a broad distribution of periods (Fig. 3A).
Fig. 4.
Computational modeling shows that extrinsic sources are the dominant contribution to variability. Blue and red data points indicate experimental data for A = 0.075% and A = 0.15%, respectively. Error bars represent ±SD. (A) Experimental values of T/Tf alongside computed entrainment regions (purple lines), which are shifted with respect to each other to account for the gap between the T/Tf = 1 and T/Tf = 2. Entrainment was observed for Tf outside the computed entrainment areas. (B and D) Same as (A), along with the prediction for the ratio T/Tf (open circles) from a stochastic model (B) and from a deterministic model with distributed parameters in a set of 550 oscillators (D). Unlike the oscillator subject to intrinsic noise (B), the oscillator with distributed kinetic parameters became phase-locked outside computed entrainment regions (D). The ratio T/Tf diverges from 1 or 2 outside Arnold tongues (B). (C and E) Experimental values of the intensity of entrainment ρ alongside the prediction (black circles) from a stochastic model (C) and a deterministic model with distributed parameters in a set of 550 oscillators (E). Intrinsic variability destroys the resonance around Tf/Tn = 0.5 (C), whereas the model with distributed parameters captures it (E). (F) Main entrainment region for forcing with a sinusoidal IPTG signal of amplitude AIPTG for three concentrations of arabinose from a deterministic model (SOM text). When the oscillator is forced through its negative-feedback loop (Fig. 1A), the range of entraining frequencies increases with the constant arabinose concentration (strength of positive-feedback loop).
The observed variability of the oscillatory dynamics can be attributed to both intrinsic and extrinsic origins (25). We incorporated both sources of variability into our model because it is difficult to ascertain which one dominates. We used a Gillespie algorithm (26) to simulate the stochastic model of the oscillator network with intrinsic noise only (the kinetic parameters of all oscillators were set to be identical). Although the simulated distributions appeared similar to experimental data (figs. S2 to S5), the stochastic model did not account for the higher-order (2:1) resonance entrainment, the period bimodality, or the wider entrainment regions (Fig. 4, B and C, black circles, and figs. S2 to S5). We therefore modeled extrinsic variability by varying the kinetic parameters of the deterministic model across a population of 550 cells. In particular, we assumed that the rates of transcription, translation, enzymatic degradation by proteases, and plasmid copy numbers were normally distributed around their nominal values. Using a coefficient of variation (CV) of 0.15, close to CV = 0.18 of the experimental probability distribution of the free-running period, we obtained good agreement between the modes of simulated and experimental period distributions (Fig. 4D, black circles, and figs. S7 and S9). Accordingly, the distributions of the relative phase and the peaks in the curves for the intensity of phase-locking were comparable (Fig. 4E and figs. S6 and S8). Deterministic simulations with randomized parameters accounted for the width of both the 1:1 and 2:1 entrainment regions. Simulations also reproduced peaks in some bimodal period distributions (figs. S7 and S9).
These results can be readily understood in the context of the phase dynamics. For fixed concentrations of arabinose and isopropyl-β-d-thiogalactopyranoside (IPTG), the natural period of the oscillator Tn is a function of the parameters of the model—for instance, the rates of transcription, translation, enzymatic degradation, and of the ratio of activator to repressor plasmids. Therefore, variability in these parameters will lead to the observed variability in the periodicity of free-running oscillations (Fig. 3A). Each individual oscillator will respond differently to the forcing arabinose signal, and depending on its natural frequency, it may or may not entrain. If the natural-frequency distribution occupies an interval of a given width, the entrainment interval will broaden by the same amount (SOM text). Moreover, the broad distribution of natural frequencies of oscillators explains the occurrence of bimodal period distributions. If the forcing frequency is shifted with respect to the peak of the free-running frequency distribution, both the entrainment peak at Tf and the “free” peak at Tn may coexist.
Because circadian oscillators can be entrained by stimuli that act on different components (27), we explored the entrainment of the oscillator through the periodic modulation of the concentration of IPTG (Fig. 1A). We did this through deterministic simulations of the model, in which arabinose was kept constant and the concentration of IPTG oscillated sinusoidally (SOM text). We found a similar behavior to forcing with arabinose, with a main entrainment region that widened with the amplitude of change in IPTG concentration. Because the concentration of arabinose defines the strength of the positive feedback through the AraC-DNA binding rate, we used different values to explore how entrainment depends on the strength of positive feedback. Lower concentrations of arabinose yielded narrower Arnold tongues (Fig. 4F). In other words, a weaker positive loop makes the oscillator less entrainable.
We have shown how the coupling of synthetic biology, microfluidic technology, and computational modeling can be used to explore the complex process of entraining molecular clocks. Our results indicated that the positive-feedback loop widens the entrainment region for single cells, providing insight into the possible role of positive feedback in the robust adaptation of variable clocks to complex environments (28). The observation of higher-order entrainment and the wider entrainment regions allowed us to discriminate intrinsic sources in favor of extrinsic noise as the main contribution to stochastic variability in computational modeling of the clock. Other manifestations of strong cell-cell variability in gene networks have been quantified (29). Although cell-cell variability may be deleterious to biological function, variable entrainment properties across a population may provide increased flexibility to the various signals that reset clocks. This may be relevant in the context of multicellular circadian systems where uncoupled peripheral oscillators display variability and are exposed to multiple signals (17, 18, 22, 30). Other properties at the cell and tissue level have been found to contribute to the flexibility of circadian clocks; recent work found an effect of the strength of coupling between cell clocks on the range of entrainment in mammalian circadian clocks (19).
Supplementary Material
Acknowledgments
This work was supported by the National Institutes of Health and General Medicine (grant R01GM69811), the San Diego Center for Systems Biology (grant P50GM085764), and CONACyT (Mexico, grant 184646 to O.M.-P.). Single-cell data obtained from automated tracking and lineage reconstruction is available online at http://biodynamics.ucsd.edu/downloads.
Footnotes
Supporting Online Material
www.sciencemag.org/cgi/content/full/333/6047/1315/DC1
Materials and Methods
SOM Text
Figs. S1 to S9
References
Movies S1 to S6
References and Notes
- 1.Gibson DG, et al. Science. 2010;329:52. 10.1126/science.1190719. [Google Scholar]
- 2.Gardner TS, Cantor CR, Collins JJ. Nature. 2000;403:339. doi: 10.1038/35002131. [DOI] [PubMed] [Google Scholar]
- 3.Elowitz MB, Leibler S. Nature. 2000;403:335. doi: 10.1038/35002125. [DOI] [PubMed] [Google Scholar]
- 4.Hasty J, McMillen D, Collins JJ. Nature. 2002;420:224. doi: 10.1038/nature01257. [DOI] [PubMed] [Google Scholar]
- 5.Basu S, Gerchman Y, Collins CH, Arnold FH, Weiss R. Nature. 2005;434:1130. doi: 10.1038/nature03461. [DOI] [PubMed] [Google Scholar]
- 6.Endy D. Nature. 2005;438:449. doi: 10.1038/nature04342. [DOI] [PubMed] [Google Scholar]
- 7.Stricker J, et al. Nature. 2008;456:516. doi: 10.1038/nature07389. [DOI] [PMC free article] [PubMed] [Google Scholar]
- 8.Tigges M, Marquez-Lago TT, Stelling J, Fussenegger M. Nature. 2009;457:309. doi: 10.1038/nature07616. [DOI] [PubMed] [Google Scholar]
- 9.Tamsir A, Tabor JJ, Voigt CA. Nature. 2011;469:212. doi: 10.1038/nature09565. [DOI] [PMC free article] [PubMed] [Google Scholar]
- 10.Danino T, Mondragón-Palomino O, Tsimring L, Hasty J. Nature. 2010;463:326. doi: 10.1038/nature08753. [DOI] [PMC free article] [PubMed] [Google Scholar]
- 11.Grilly C, Stricker J, Pang WL, Bennett MR, Hasty J. Mol. Syst. Biol. 2007;3 doi: 10.1038/msb4100168. article 127. [DOI] [PMC free article] [PubMed] [Google Scholar]
- 12.Sprinzak D, Elowitz MB. Nature. 2005;438:443. doi: 10.1038/nature04335. [DOI] [PubMed] [Google Scholar]
- 13.Mukherji S, van Oudenaarden A. Nat. Rev. Genet. 2009;10:859. doi: 10.1038/nrg2697. [DOI] [PMC free article] [PubMed] [Google Scholar]
- 14.Bell-Pedersen D, et al. Nat. Rev. Genet. 2005;6:544. doi: 10.1038/nrg1633. [DOI] [PMC free article] [PubMed] [Google Scholar]
- 15.Johnson CH, Elliott JA, Foster R. Chronobiol. Int. 2003;20:741. doi: 10.1081/cbi-120024211. [DOI] [PubMed] [Google Scholar]
- 16.Zhang EE, Kay SA. Nat. Rev. Mol. Cell Biol. 2010;11:764. doi: 10.1038/nrm2995. [DOI] [PubMed] [Google Scholar]
- 17.Welsh DK, Yoo SH, Liu AC, Takahashi JS, Kay SA. Curr. Biol. 2004;14:2289. doi: 10.1016/j.cub.2004.11.057. [DOI] [PMC free article] [PubMed] [Google Scholar]
- 18.Yoo SH, et al. Proc. Natl. Acad. Sci. U.S.A. 2004;101:5339. [Google Scholar]
- 19.Abraham U, et al. Mol. Syst. Biol. 2010;6:438. doi: 10.1038/msb.2010.92. [DOI] [PMC free article] [PubMed] [Google Scholar]
- 20.Whitesides GM, Ostuni E, Takayama S, Jiang X, Ingber DE. Annu. Rev. Biomed. Eng. 2001;3:335. doi: 10.1146/annurev.bioeng.3.1.335. [DOI] [PubMed] [Google Scholar]
- 21.Materials and methods are available as supporting material on Science Online.
- 22.Carr AJ, Whitmore D. Nat. Cell Biol. 2005;7:319. doi: 10.1038/ncb1232. [DOI] [PubMed] [Google Scholar]
- 23.Tass P, et al. Phys. Rev. Lett. 1998;81:3291. [Google Scholar]
- 24.Pikovsky A, Rosenblum M, Kurths J. Synchronization: A Universal Concept in Nonlinear Sciences. Cambridge Univ. Press; Cambridge: 2003. [Google Scholar]
- 25.Swain PS, Elowitz MB, Siggia ED. Proc. Natl. Acad. Sci. U.S.A. 2002;99:12795. doi: 10.1073/pnas.162041399. [DOI] [PMC free article] [PubMed] [Google Scholar]
- 26.Gillespie D. J. Phys. Chem. 1977;81:2340. [Google Scholar]
- 27.Boothroyd CE, Wijnen H, Naef F, Saez L, Young MW. PLoS Genet. 2007;3:e54. doi: 10.1371/journal.pgen.0030054. [DOI] [PMC free article] [PubMed] [Google Scholar]
- 28.Rand DA, Shulgin BV, Salazar D, Millar AJ, Soc JR. Interface. 2004;1:119. doi: 10.1098/rsif.2004.0014. [DOI] [PMC free article] [PubMed] [Google Scholar]
- 29.Fischer-Friedrich E, Meacci G, Lutkenhaus J, Chaté H, Kruse K. Proc. Natl. Acad. Sci. U.S.A. 2010;107:6134. doi: 10.1073/pnas.0911708107. [DOI] [PMC free article] [PubMed] [Google Scholar]
- 30.Dibner C, Schibler U, Albrecht U. Annu. Rev. Physiol. 2010;72:517. doi: 10.1146/annurev-physiol-021909-135821. [DOI] [PubMed] [Google Scholar]
Associated Data
This section collects any data citations, data availability statements, or supplementary materials included in this article.


