Abstract
Purpose
The current study presents [18F]PARPi as imaging agent for PARP1 expression.
Procedures
[18F]PARPi was generated by conjugating a 2H-phthalazin-1-one scaffold to 4-[18F]fluorobenzoic acid. Biochemical assays, optical in vivo competition, biodistribution analysis, positron emission tomography (PET)/X-ray computed tomography, and PET/ magnetic resonance imaging studies were performed in subcutaneous and orthotopic mouse models of glioblastoma.
Results
[18F]PARPi shows suitable pharmacokinetic properties for brain tumor imaging (IC50=2.8±1.1 nM; logPCHI=2.15±0.41; plasma-free fraction=63.9±12.6 %) and accumulates selectively in orthotopic brain tumor tissue. Tracer accumulation in subcutaneous brain tumors was 1.82±0.21 %ID/g, whereas in healthy brain, the uptake was only 0.04±0.01 %ID/g.
Conclusions
[18F]PARPi is a selective PARP1 imaging agent that can be used to visualize glioblastoma in xenograft and orthotopic mouse models with high precision and good signal/noise ratios. It offers new opportunities to non-invasively image tumor growth and monitor interventions.
Keywords: PARP1, Glioblastoma, PET, Orthotopic, Imaging
Introduction
Poly(ADP-ribose) polymerase 1 (PARP1)-targeted therapeutics have had a major impact on pharmaceutical research and development, and just recently, a therapeutic PARP1 inhibitor, Lynparza (olaparib, Astra-Zeneca), was approved for clinical use by the FDA [1–3]. The therapeutic interest in PARP1 is rooted in the unique role of the enzyme in the DNA damage repair cascade. PARP1 inhibitors inflict their cytotoxic potential by inhibiting certain cellular responses to DNA damage events, leading to cell death [1, 4]. The potential therapeutic impact of PARP1 as a clinical target is high, but the enzyme has also attracted attention as a target for imaging agents. This observation is based on the finding that PARP1 is highly overexpressed in various forms of cancer [5–11], and the degree of upregulation is linked to overall survival [7]. This implies that PARP1 is not only a therapeutic target but also a potentially valuable diagnostic or even prognostic biomarker.
Based on this data, we tested a fluorescent imaging agent, PARPi-FL [12, 13], for imaging of PARP1 expression in vivo. In mouse models of glioblastoma, we showed that PARPi-FL is metabolically stable, clears quickly from the circulation, and that its tumor uptake is closely correlated with PARP1 expression levels [14, 15]. Orthotopic brain tumors were successfully imaged in vivo due to (i) overexpression of PARP1 in glioblastoma, paired with (ii) low expression in healthy brain tissue; (iii) high cell permeability of the imaging agent; and (iv) strong retention in PARP1-expressing nuclei, along with rapid clearance from off-target tissues/cellular compartments.
While the fluorescent PARPi-FL will be of use as a preclinical imaging tool for quantifying PARP1 and might be used as an intraoperative probe, we became interested in creating a positron emission tomography (PET) active companion imaging agent for PARPi-FL. A radiolabeled PARP1 tracer might represent a robust platform for non-invasive PARP1 imaging and could ultimately provide insight into the biology of tumors before and after administration of treatment.
Inspired by our earlier designs [13–19] and the work of others [20], we synthesized [18F]PARPi, an F-18-labeled derivative of PARPi-FL. We determined the performance and basic binding parameters of [18F]PARPi in biochemical assays then showed that in optical imaging experiments, the radiolabeled tracer reaches its target on a cellular level, saturating PARP1 in the nuclei of glioblastoma cells. We determined the biodistribution of [18F]PARPi and showed in subcutaneous and orthotopic mouse models of glioblastoma that PARP1 expression can be visualized by PET with high signal/noise ratios.
Materials and Methods
A detailed description of the preparation of [18F]PARPi as well as of all in vitro, in vivo, and ex vivo experiments can be found in the Supplemental Data, together with additional supporting tables and figures. All animal experiments were done in accordance with protocols approved by the Institutional Animal Care and Use Committee of Memorial Sloan Kettering Cancer Center (MSKCC) and followed the National Institutes of Health guidelines for animal welfare.
Results
Chemistry and Radiochemistry
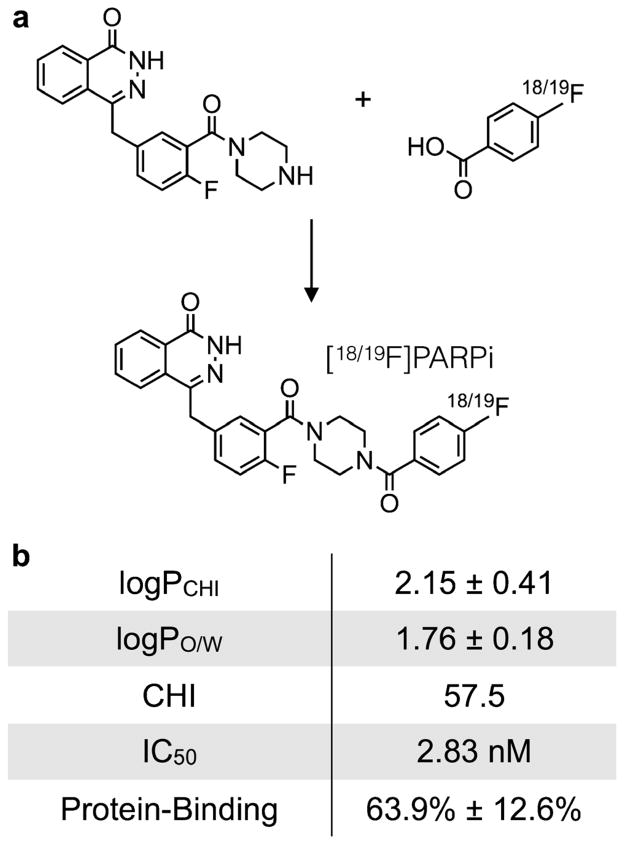
The molecular structure of [18F]PARPi is based on the previously tested and validated (2H)-phthalazin-1-one scaffold of the small molecule therapeutic olaparib [21]. Our tracer was obtained by conjugating a 4-[18F]fluorobenzoic acid group to the PARP1 targeting small molecule. Its cold reference compound, [19F]PARPi, was synthesized in a single synthetic step from 4-(4-fluoro-3-(piperazine-1-carbonyl)benzyl)phthalazin-1(2H)-one [21] and 4-fluorobenzoic acid, similar to coupling procedures applied earlier [13] (Fig. 1a). [19F]PARPi was obtained with an isolated yield of 43 %, and its identity confirmed by ESI-MS, ESI-HRMS, and NMR spectroscopy (Fig. S1a–S1b).
Fig. 1.
Structure of [18/19F]PARPi and biophysical properties. a 4-(4-Fluoro-3-(piperazine-1-carbonyl)benzyl)phthalazin-1(2H)-one (54.5 μmol) was conjugated with 4-fluorobenzoic (65.5 μmol) to yield the final [19F]PARPi. b Key pharmacokinetic properties of [19F]PARPi. logPCHI=logP based on the chemical hydrophobicity index; logPO/W=logP based on the octanol/water partition coefficient; CHI=chemical hydrophobicity index; IC50=half maximal inhibitory concentration.
The radiolabeled version of the PARP1-targeted tracer, [18F]PARPi, was synthesized in three consecutive synthetic transformations. Similar to the cold material, it was produced from the PARP1-targeted (2H)-phthalazin-1-one fragment. Its radiolabeled reaction partner 4-[18F]fluorobenzoic acid was obtained from ethyl 4-nitrobenzoate, which was added to dry K[18F]-K222 and heated to 150 °C for 15 min to give ethyl 4-[18F]fluorobenzoate. The decay-corrected radiochemical yield (dcRCY) for this transformation was determined by HPLC and found to be 70 %. Then, the ethyl protective group was removed in the presence of sodium hydroxide to yield 4-[18F]fluorobenzoic acid (dcRCY>99 %). Analogous to the non-radioactive material, the radiolabeled 4-[18F]fluorobenzoic acid was coupled to the phthalazinone precursor (dcRCY=35 %). The total synthesis time from the start of synthesis to obtaining an injectable formulation was 90 min, and the overall uncorrected radiochemical yield was 10 %, with a specific activity of 48 mCi/μmol (1.8 GBq/umol, Fig. S2).
PARP1 Affinity, LogP, and Plasma Protein Binding of [19F]PARPi
First, we determined the ability of our tracer to bind to PARP1 in a biochemical assay, analogous to methods we have previously described [22]. We found that the IC50 of [19F]PARPi was 2.8±1.1 nM (Fig. S1c), which is on par with the small molecule parent compound olaparib (5 nM, [21]). We calculated the logPCHI of [19F]PARPi from its chemical hydrophobicity index (CHI), a measure of HPLC retention time [23]. The CHI for [19F]PARPi was 57.5, which translates to a logPCHI of 2.15±0.41. This is concordant with measuring the octanol/water partition coefficient of [18F]PARPi, where we determined the logPO/W to be 1.76 ±0.18 (Fig. 1b). The logP of [19F]PARPi was higher than for olaparib (CHI=34.1, logPCHI=0.8), but both small molecules had comparable plasma protein binding (64 and 65 % for [19F]PARPi and olaparib, respectively).
In vitro Characterization of [19F]PARPi
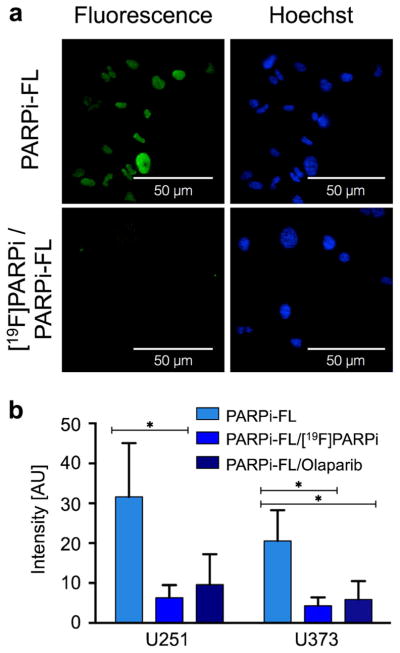
We determined on a subcellular level whether [18F]PARPi binds to the same target as its parent compound olaparib. To show this, we performed in vitro assays with the non-radioactive [19F]PARPi, olaparib, and the fluorescent imaging agent PARPi-FL, which we have shown to be highly selective for PARP1 and suitable as a surrogate marker to infer the subcellular distribution of olaparib [18]. Labeling cells with PARPi-FL leads to strong nuclear fluorescence due to retention of the imaging agent by PARP1. In the presence of olaparib, the binding sites for PARPi-FL were occupied, and the observed fluorescence is reduced by 69.6 ±22.3 % and 71.2±20.0 % for U251 MG and U373 MG cells, respectively. Similarly, [19F]PARPi was able to compete for the same binding sites as PARPi-FL, resulting in a reduction of fluorescence intensity in the nucleus by 80.0±10.8 % and 78.8±10.4 % for U251 MG and U373 MG cells, respectively (Fig. 2).
Fig. 2.
Specificity of [19F]PARPi uptake. U251 MG or U373 MG were incubated either alone with PARPi-FL (500 nM) or with PARPi-FL (500 nM) plus [19F]PARPi (tenfold excess), or PARPi-FL (500 nM) plus olaparib (tenfold excess). [19F]PARPi and olaparib compete for the same binding sites as PARPi-FL, resulting in a reduction of fluorescence intensity in case of specific binding. a Confocal microscopy of U251 MG cells after PARPi-FL or [19F]PARPi /PARPi-FL injection. Green PARPi-FL signal, blue Hoechst nuclear stain. b Quantification of fluorescence intensity in cell nuclei in U251 MG and U373 MG cells after incubation with only PARPi-FL, [19F]PARPi/ PARPi-FL, or olaparib/PARPi-FL. Error bars are mean ±standard deviation (SD). P values were calculated with Student’s t-tests, unpaired; *P<0.05.
Blood Stability and Blood Half-Life of [18F]PARPi
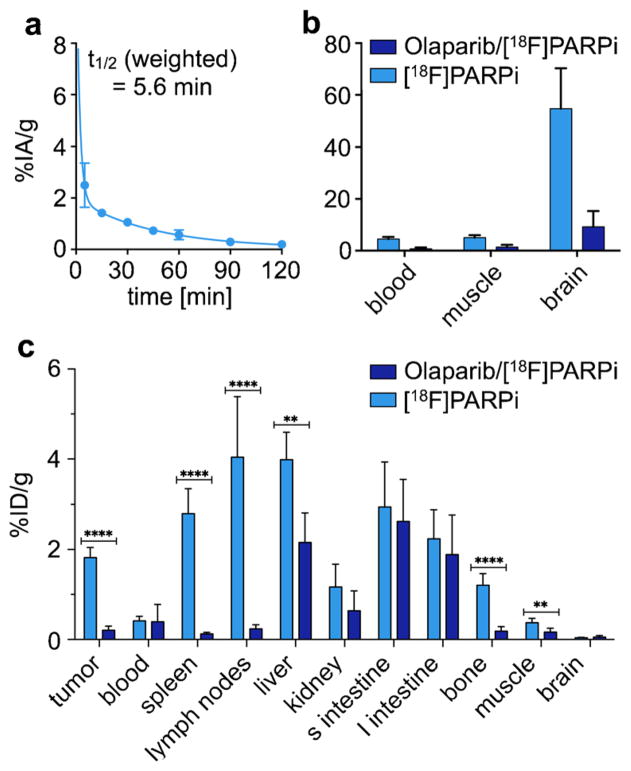
We estimated the in vivo stability of [18F]PARPi by incubating the radiotracer in whole blood for up to 4 h. Over the given time period, no radioactive metabolites were observed, indicating excellent stability and potentially low bone uptake of the tracer for in vivo applications (Fig. S3). The blood half-life of [18F]PARPi was determined in athymic nude mice, which received the tracer via tail vein injection. Analogous to other small molecules of this type [13, 14, 18], the agent was cleared rather quickly, with an alpha blood half-life of 1.27 min (85.51 %) and beta blood half-life of 31.14 min (14.49 %), resulting in a weighted blood half-life of t1/2(weighted)=5.6 min (Fig. 3a).
Fig. 3.
[18F]PARPi in vivo pharmacokinetics. a In vivo blood half-life of [18F]PARPi (n=3). Blood was collected at different time points (5, 15, 30, 45, 60, 90, 120 min), weighted, and counted. Results expressed as percent injected dose per gram (%ID/g). b Selected tumor-to-non-target-tissues ratio of [18F]PARPi (n=12) calculated from biodistribution data. c Biodistribution study in selected tissues. After injection of [18F]PARPi into mice with tumor xenografts, mice were euthanized at 2 h post-injection and radioactivity in organs was measured (n=6/group). Error bars are mean±SD. P values were calculated with Student’s t-tests, unpaired; *P<0.05; **P<0.01; ***P<0.001; ****P<0.0001.
Biodistribution
Biodistribution studies were performed in mice bearing subcutaneously injected U251 MG xenografts (n=12, Fig. 3b, c and Table S1). Tumor uptake at 2 h post-injection was 1.82±0.21 %ID/g for mice receiving [18F]PARPi (“unblocked”) and 0.23±0.09 %ID/g for mice that were injected first with olaparib and 30 min later with [18F]PARPi (“blocked”). Muscle uptake was 0.37 ±0.09 %ID/g and 0.19±0.08 %ID/g, while brain uptake was 0.04±0.01 %ID/g and 0.04±0.03 %ID/g for each group, respectively. The tumor-to-muscle ratio was 5.1±0.9, and the tumor-to-brain ratio was 54.9±14.1 (Fig. 3b). A high uptake was also observed in the hepatobiliary system with liver uptake values of 3.98±0.56 and 3.61±2.04 %ID/g, small intestine uptake of 2.94±0.91 and 2.35±0.70 %ID/g, and large intestine uptake of 2.24±0.59 and 1.73±0.80 %ID/g for unblocked and blocked cohorts, respectively. We also found that lymph node and spleen uptake were high, with 2.80±0.51 and 4.04 ±1.23 %ID/g, respectively, and that their uptake was reduced after pre-injection of olaparib by 95 and 94 %, respectively (Fig. 3c). Highly selective uptake in these organs is based on their rather high PARP1 expression, shown in immunohistochemical stainings, which were obtained in non-tumor-bearing mice (Figs. S4–S5). Our biodistribution data was corroborated by PET/X-ray computed tomography (CT) imaging, with whole axial and coronal slices of subcutaneous tumor-bearing mice receiving only [18F]PARPi and both olaparib/[18F]PARPi available in Supplemental Fig. S6.
Ex vivo Autoradiography
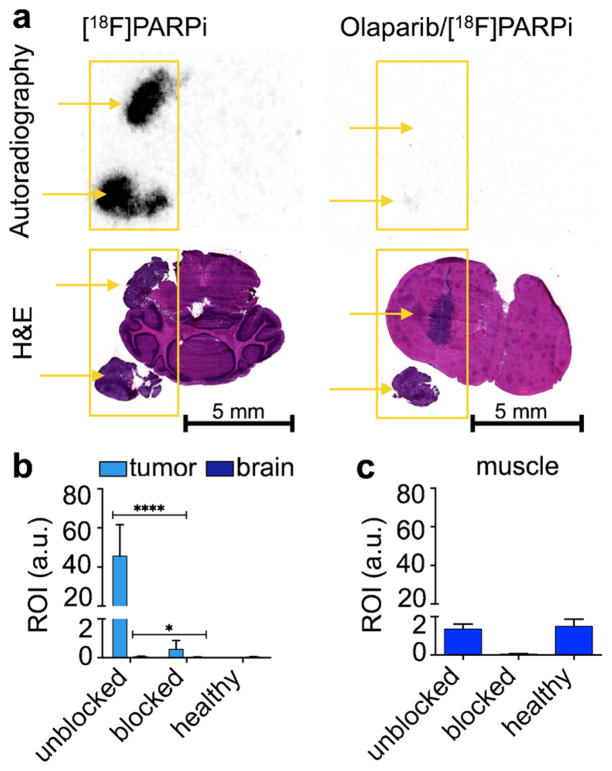
We used an orthotopic mouse model of U251 MG to determine the potential clinical impact of [18F]PARPi as a non-invasive PARP1 imaging tracer. U251 MG cells expressed PARP1 at much higher levels than healthy brain, and orthotopic brain tumors had a high gradient in PARP1 expression (Fig. S7). In order to assess the alignment of [18F]PARPi retention and PARP1 expression on a microscopic level in vivo, tumor-bearing mice were injected with [18F]PARPi and autoradiography was performed (Fig. 4a). Using histology to localize the tumor regions of the brain, the autoradiographic analysis revealed significantly higher retention of [18F]PARPi inside orthotopic tumor tissue than in healthy surrounding brain (Fig. 4b, 46.66±14.94 AU and 0.06±0.02 AU for orthotopic tumor and surrounding brain, respectively). Similarly—and consistent with in vitro imaging—we found that pre-injection of olaparib and hence saturation of PARP1 binding sites lead to almost quantitative reduction of [18F]PARPi (99 %, 0.44±0.41 AU and 0.03 ±0.01 AU for orthotopic tumor and surrounding brain, respectively). The uptake of [18F]PARPi in orthotopic tumor tissue was distinctly higher than in muscle (Fig. 4b, c, 1.36 ±0.21 AU and 1.50±0.31 AU for muscle tissue in tumor-bearing and healthy mice, respectively).
Fig. 4.
[18F]PARPi localization in orthotopic U251 MG tumor-bearing mouse brain. a Autoradiography and H&E staining of U251 MG tumor-bearing brain sections of animals injected with [18F]PARPi or olaparib/[18F]PARPi. Yellow arrows indicate location of tumor tissue. Quantification of activity on autoradiographic sections in b orthotopic U251 MG tumors and mouse brain and c muscle of tumor-bearing mice that were unblocked and blocked, as well as unblocked healthy mice (n=6). Error bars are mean±SD. P values were calculated with Student’s t-tests, unpaired; *P<0.05; **P<0.01; ***P<0.001; ****P<0.0001.
PET/CT and PET/MRI Imaging in Orthotopic Mouse Models
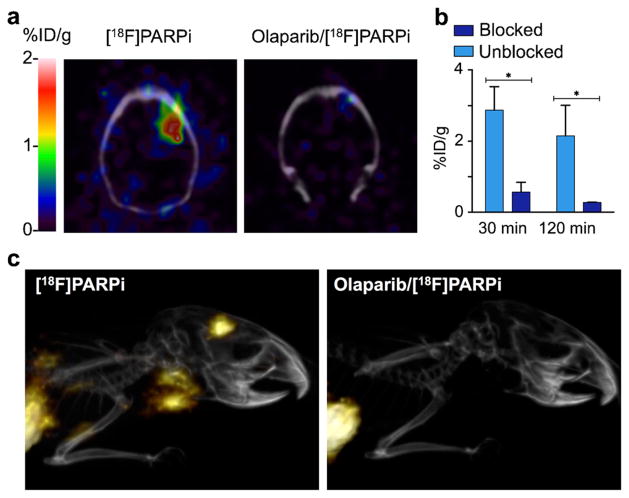
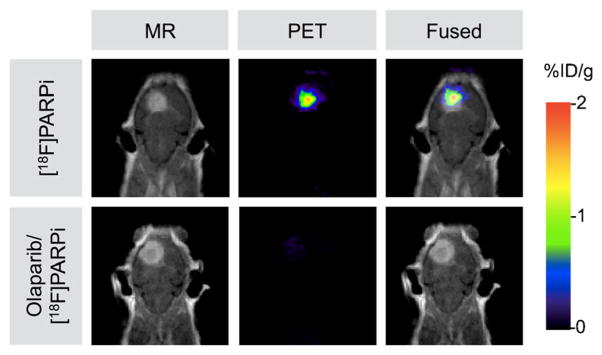
We used both small-animal PET/CT and PET/magnetic resonance imaging (MRI) scanners to determine the accuracy and selectivity of non-invasive glioblastoma delineation with [18F]PARPi. Figure 5a shows axial brain slices, obtained 120 min after radiotracer injection, of tumor-bearing animals that received either only [18F]PARPi or olaparib/[18F]PARPi. For animals receiving only [18F]PARPi, the retained activity (2.15±0.79 %ID/g) was eightfold higher than for animals that received both olaparib and [18F]PARPi (0.28±0.01 %ID/g, Fig. 5b). Figure 5c shows representative 3D PET/CT reconstructions of orthotopic tumor-bearing mice that received [18F]PARPi or olaparib/[18F]PARPi. PET/MRI also confirmed uptake of [18F]PARPi in the tumor tissue, which was identified on T1-weighted post-contrast images (Fig. 6).
Fig. 5.
In vivo whole body PET/CT imaging of [18F]PARPi in orthotopic brain tumor-bearing mice. a Fused PET/CT coronal images of a brain orthotopic U251 MG tumor-bearing mouse acquired at 2 h post-injection of [18F]PARPi (left) or the blocking agent olaparib (500-fold excess) followed by [18F]PARPi (right). b PET quantification of U251 MG tumors from images acquired at 30 min and 2 h post-injection (n=10). c Representative 3D PET/CT images of orthotopic U251 MG tumor-bearing mice after injection of [18F]PARPi (left) and after pre-injection (30 min before) of blocking agent and [18F]PARPi (500-fold excess olaparib) (right). Images were acquired at 2 h post-injection. Error bars are mean±SD. P values were calculated with Student’s t-tests, unpaired; *P<0.05.
Fig. 6.
In vivo whole body PET/MRI imaging of [18F]PARPi in orthotopic brain tumor-bearing mice. Coronal view of [18F]PARPi PET images, contrast-enhanced MRI, and fused PET/MRI of orthotopic U251 MG tumor-bearing mice. PET scans were acquired 2 h after injection of [18F]PARPi or olaparib/[18F]PARPi, and MRI scans were acquired 1 min after Magnevist injection. Top row: MRI, PET, and co-registered PET/MRI for a mouse receiving only [18F]PARPi. Bottom row: MRI, PET, and co-registered PET/MRI for a mouse receiving [18F]PARPi after a 500-fold excess of olaparib.
Discussion
The goal of this study was to establish an imaging tracer that can non-invasively detect PARP1 expression of malignant tumors. We showed that [18F]PARPi, a PARP1-targeted small molecule, specifically binds to the DNA-repair enzyme PARP1 both in vitro and in vivo. Moreover, we tested the targeted accumulation of [18F]PARPi in orthotopic mouse models of glioblastoma and have shown with autoradiography PET/CT and PET/MRI that the tracer was retained inside of glioblastoma tissue, but not the surrounding healthy brain. This reflects the overexpression of PARP1 in orthotopic glioblastoma models (Fig. S7), which is consistent with our earlier findings [14, 15] and analogous to the human situation [9].
For the synthesis of [18F]PARPi, we replaced the cyclopropane group from the PARP1-targeted (2H)- phthalazin-1-one scaffold and with a 4-[18F]fluorobenzene to yield the target molecule, a strong binder of PARP1 (2.8 ±1.1 nM). The radiochemical synthesis was straightforward, highly reproducible (Fig. S2), and produced the tracer in excellent yield (10 %, overall uncorrected radiochemical yield), radiochemical/chemical purity (>99 %), and specific activity (48 mCi/μmol). Similar to what was already described by other groups [24, 25], the first two steps produced 4-[18F]fluorobenzoic acid in high yield. These steps were followed by efficient conjugation to the phthalazinone precursor in the presence of HBTU.
[18F]PARPi was rapidly washed out from most organs, resulting in a remarkable tumor-to-normal tissue contrast (Fig. 5) at 2 h post-injection for subcutaneous and orthotopic tumors. The tumor uptake of [18F]PARPi at 2 h was 2.2 ±0.8 %ID/g and 1.82±0.21 %ID/g for orthotopic and subcutaneous U251 MG xenografts, respectively, and higher than that of other PARP1 targeting molecules of this type [14, 19]. Moreover, 2 h post-injection, low activity concentrations were observed in most organs except for the gastrointestinal tract due to the rapid clearance from the blood and subsequent hepatobiliary excretion of the tracer (liver, 3.98±0.56 %ID/g; small intestines, 2.94±0.91 %ID/g; large intestines, 2.24±0.59 %ID/g). This is analogous to olaparib [26] and other PARP1-targeted molecules [14, 15, 27].
For PET/CT imaging in orthotopic U251 MG glioblastoma-bearing mice, imaging at 2 h rather than at 30 min post-injection yielded significantly higher tumor contrast by allowing the tracer to clear from the bloodstream and unspecific binding sites (Fig. 5 and Fig. S6, Table S1). PET quantification showed an uptake in the tumor of 2.88 ±0.65 %ID/g at 0.5 h post-injection and 2.15±0.28 %ID/g at 2 h post-injection.
Expanding on our in vivo imaging data, we confirmed the co-localization of [18F]PARPi and tumor in PET/MRI studies and ex vivo autoradiography. In PET/MRI fusion images, accumulation in the tumor was co-aligned with the orthotopic tumor on MRI (Fig. 6, ~2 %ID/g). In mice receiving an injection of olaparib ahead of the radiotracer, the [18F]PARPi tumor uptake was negligible (Figs. 5 and 6). This was also confirmed by ex vivo autoradiography (Fig. 4), in which a stark difference between tumor and non-targeted tissues (brain and muscle) was seen, which is likely the result of fast penetration and rapid washout kinetics of this class of imaging agents [18].
[18F]PARPi combines good pharmacokinetic properties with remarkable in vitro and in vivo stability, evidenced by minimal defluorination. As result of the high lipophilicity of [18F]PARPi, clearance mainly occurred via the hepatobiliary pathway, similar to olaparib and other PARP1-targeting molecules [14, 15, 27]. While imaging of glioblastoma with [18F]PARPi in orthotopic mouse models was successful, it is a limitation of this model that the breakdown of the blood brain barrier can contribute to higher unspecific binding. Some of the tracer might have leaked out non-specifically into the tumor tissue due to this effect, contributing to the overall imaging signal. However, [18F]PARPi uptake can be reduced significantly after injection of olaparib (P<0.0001), which suggests that at least in areas where the blood brain barrier is disrupted, specific binding is observed. Retention of [18F]PARPi in the lymph nodes and spleen was also blocked by injection of olaparib, and the uptake therefore likely reflects PARP1 expression in immune cells, which has been described in the literature [5] and is consistent with our histological findings (Figs. S4, S5).
Conclusion
The novel PET imaging agent [18F]PARPi demonstrates an outstanding ability to non-invasively image PARP1 expression of gliomas and could have various applications in brain tumor research. Besides serving as a companion imaging agent for PARP1-targeting therapeutics, the agent could serve as a diagnostic for monitoring PARP1 expression before, during, and after treatment with cytotoxic agents. This could lead to new insights into the function of PARP1 during cellular DNA damage response. Furthermore, the biodistribution data indicates that the imaging of PARP1 expression is not only feasible for brain tumors but potentially also for lung and soft tissue tumors. This is of high clinical relevance, because PARP1 inhibitors are under clinical investigation in lung cancer, breast cancer, and sarcomas. These properties make [18F]PARPi an excellent candidate for clinical translation.
Supplementary Material
Acknowledgments
The authors thank Dr. Jason S. Lewis and Dr. Edmund J. Keliher for helpful discussions, Dr. Christian Brand and Christopher P. Irwin for help with experiments and Leah Bassity for editing the manuscript. Technical services provided by the MSKCC Small-Animal Imaging Core Facility, supported in part by NIH Cancer Center Support Grant No 2 P30 CA008748-48, are gratefully acknowledged. NIH Shared Instrumentation Grant No 1S10 OD016207-01, which provided funding support for the purchase of the Inveon PET/CT, is gratefully acknowledged. The authors further thank the Molecular Cytology Core at Memorial Sloan Kettering Cancer Center (P30 CA008748). The authors thank the NIH (K25EB016673 for T.R.), the Brain Tumor Center of Memorial Sloan Kettering Cancer Center (for T.R.), the Center for Molecular Imaging and Nanotechnology (for T.R.), the Clinical and Translational Science Center (CTSC) at Weill Cornell Medical College (NIH/NCATS Grant TL1TR000459 for B.C.), the American-Italian Cancer Foundation (AICF) Post-Doctoral Research Fellowship (for G.C.), the German Research Foundation (for S.K.), as well as the National Science Foundation Integrative Graduate Education and Research Traineeship (IGERT 0965983 at Hunter College) for their generous support.
Footnotes
Electronic supplementary material The online version of this article (doi:10.1007/s11307-015-0904-y) contains supplementary material, which is available to authorized users.
Author Contributions. The manuscript was written through contributions of all authors. All authors have given approval to the final version of the manuscript.
Compliance with Ethical Standards
Conflict of Interest The authors report no conflicts of interest.
References
- 1.Rouleau M, Patel A, Hendzel MJ, et al. PARP inhibition: PARP1 and beyond. Nat Rev Cancer. 2010;10:293–301. doi: 10.1038/nrc2812. [DOI] [PMC free article] [PubMed] [Google Scholar]
- 2.Gradwohl G, Menissier de Murcia JM, et al. The second zinc-finger domain of poly(ADP-ribose) polymerase determines specificity for single-stranded breaks in DNA. Proc Natl Acad Sci U S A. 1990;87:2990–2994. doi: 10.1073/pnas.87.8.2990. [DOI] [PMC free article] [PubMed] [Google Scholar]
- 3.Hassa PO, Hottiger MO. The diverse biological roles of mammalian PARPS, a small but powerful family of poly-ADP-ribose polymerases. Front Biosci. 2008;13:3046–3082. doi: 10.2741/2909. [DOI] [PubMed] [Google Scholar]
- 4.Yang KS, Kohler RH, Landon M, et al. Single cell resolution in vivo imaging of DNA damage following PARP inhibition. Sci Rep. 2015;5:10129. doi: 10.1038/srep10129. [DOI] [PMC free article] [PubMed] [Google Scholar]
- 5.Ossovskaya V, Koo IC, Kaldjian EP, et al. Upregulation of poly(ADP-ribose) polymerase-1 (PARP1) in triple-negative breast cancer and other primary human tumor types. Genes Cancer. 2010;1:812–821. doi: 10.1177/1947601910383418. [DOI] [PMC free article] [PubMed] [Google Scholar]
- 6.Bièche I, De Murcia G, Lidereau R. Poly(ADP-ribose) polymerase gene expression status and genomic instability in human breast cancer. Clin Cancer Res. 1996;2:1163–1167. [PubMed] [Google Scholar]
- 7.Rojo F, Garcia-Parra J, Zazo S, et al. Nuclear PARP-1 protein overexpression is associated with poor overall survival in early breast cancer. Ann Oncol. 2012;23:1156–1164. doi: 10.1093/annonc/mdr361. [DOI] [PubMed] [Google Scholar]
- 8.Alanazi M, Pathan AA, Arifeen Z, et al. Association between PARP-1 V762A polymorphism and breast cancer susceptibility in Saudi population. PLoS One. 2013;8:e85541. doi: 10.1371/journal.pone.0085541. [DOI] [PMC free article] [PubMed] [Google Scholar]
- 9.Galia A, Calogero AE, Condorelli RA, et al. PARP-1 protein expression in glioblastoma multiforme. Eur J Histochem EJH. 2012;56 doi: 10.4081/ejh.2012.e9. [DOI] [PMC free article] [PubMed] [Google Scholar]
- 10.Barton VN, Donson AM, Kleinschmidt-DeMasters BK, et al. PARP1 expression in pediatric central nervous system tumors. Pediatr Blood Cancer. 2009;53:1227–1230. doi: 10.1002/pbc.22141. [DOI] [PubMed] [Google Scholar]
- 11.Staibano S, Pepe S, Lo Muzio L, et al. Poly(adenosine diphosphate-ribose) polymerase 1 expression in malignant melanomas from photoexposed areas of the head and neck region. Hum Pathol. 2005;36:724–731. doi: 10.1016/j.humpath.2005.04.017. [DOI] [PubMed] [Google Scholar]
- 12.Thurber GM, Reiner T, Yang KS, et al. Effect of small-molecule modification on single-cell pharmacokinetics of PARP inhibitors. Mol Cancer Ther. 2014;13:986–995. doi: 10.1158/1535-7163.MCT-13-0801. [DOI] [PMC free article] [PubMed] [Google Scholar]
- 13.Reiner T, Lacy J, Keliher EJ, et al. Imaging therapeutic PARP inhibition in vivo through bioorthogonally developed companion imaging agents. Neoplasia. 2012;14:169–177. doi: 10.1593/neo.12414. [DOI] [PMC free article] [PubMed] [Google Scholar]
- 14.Carlucci G, Carney B, Brand C, et al. Dual-modality optical/PET imaging of PARP1 in glioblastoma. Mol Imaging Biol. 2015 doi: 10.1007/s11307-015-0858-0. [DOI] [PMC free article] [PubMed] [Google Scholar]
- 15.Irwin CP, Portorreal Y, Brand C, et al. PARPi-FL–a fluorescent PARP1 inhibitor for glioblastoma imaging. Neoplasia. 2014;16:432–440. doi: 10.1016/j.neo.2014.05.005. [DOI] [PMC free article] [PubMed] [Google Scholar]
- 16.Keliher EJ, Klubnick JA, Reiner T, et al. Efficient acid-catalyzed (18) F/(19) F fluoride exchange of BODIPY dyes. ChemMedChem. 2014;9:1368–1373. doi: 10.1002/cmdc.201300506. [DOI] [PMC free article] [PubMed] [Google Scholar]
- 17.Keliher EJ, Reiner T, Turetsky A, et al. High-yielding, two-step 18F labeling strategy for 18F-PARP1 inhibitors. ChemMedChem. 2011;6:424–427. doi: 10.1002/cmdc.201000426. [DOI] [PMC free article] [PubMed] [Google Scholar]
- 18.Thurber GM, Yang KS, Reiner T, et al. Single-cell and subcellular pharmacokinetic imaging allows insight into drug action in vivo. Nat Commun. 2013;4:1504. doi: 10.1038/ncomms2506. [DOI] [PMC free article] [PubMed] [Google Scholar]
- 19.Reiner T, Keliher EJ, Earley S, et al. Synthesis and in vivo imaging of a 18F-labeled PARP1 inhibitor using a chemically orthogonal scavenger-assisted high-performance method. Angew Chem Int Ed Engl. 2011;50:1922–1925. doi: 10.1002/anie.201006579. [DOI] [PMC free article] [PubMed] [Google Scholar]
- 20.Zhou D, Chu W, Xu J, et al. Synthesis, [(1)(8)F] radiolabeling, and evaluation of poly(ADP-ribose) polymerase-1 (PARP-1) inhibitors for in vivo imaging of PARP-1 using positron emission tomography. Bioorg Med Chem. 2014;22:1700–1707. doi: 10.1016/j.bmc.2014.01.019. [DOI] [PMC free article] [PubMed] [Google Scholar]
- 21.Menear KA, Adcock C, Boulter R, et al. 4-[3-(4-Cyclopropane-carbonylpiperazine-1-carbonyl)-4-fluorobenzyl]-2H-phthalazin-1-one: a novel bioavailable inhibitor of poly(ADP-ribose) polymerase-1. J Med Chem. 2008;51:6581–6591. doi: 10.1021/jm8001263. [DOI] [PubMed] [Google Scholar]
- 22.Reiner T, Earley S, Turetsky A, Weissleder R. Bioorthogonal small-molecule ligands for PARP1 imaging in living cells. Chembiochem. 2010;11:2374–2377. doi: 10.1002/cbic.201000477. [DOI] [PMC free article] [PubMed] [Google Scholar]
- 23.Valko K, Bevan C, Reynolds D. Chromatographic hydrophobicity index by fast-gradient RP-HPLC: a high-throughput alternative to log P/log D. Anal Chem. 1997;69:2022–2029. doi: 10.1021/ac961242d. [DOI] [PubMed] [Google Scholar]
- 24.Marik J, Sutcliffe JL. Fully automated preparation of n.c.a. 4-[18F]fluorobenzoic acid and N-succinimidyl 4-[18F]fluorobenzoate using a Siemens/CTI chemistry process control unit (CPCU) Appl Radiat Isot. 2007;65:199–203. doi: 10.1016/j.apradiso.2006.06.007. [DOI] [PubMed] [Google Scholar]
- 25.Li X, Link JM, Stekhova S, et al. Site-specific labeling of annexin V with F-18 for apoptosis imaging. Bioconjug Chem. 2008;19:1684–1688. doi: 10.1021/bc800164d. [DOI] [PMC free article] [PubMed] [Google Scholar]
- 26.Chen Y, Zhang L, Hao Q. Olaparib: a promising PARP inhibitor in ovarian cancer therapy. Arch Gynecol Obstet. 2013;288:367–374. doi: 10.1007/s00404-013-2856-2. [DOI] [PubMed] [Google Scholar]
- 27.Murai J, Huang SY, Renaud A, et al. Stereospecific PARP trapping by BMN 673 and comparison with olaparib and rucaparib. Mol Cancer Ther. 2014;13:433–443. doi: 10.1158/1535-7163.MCT-13-0803. [DOI] [PMC free article] [PubMed] [Google Scholar]
Associated Data
This section collects any data citations, data availability statements, or supplementary materials included in this article.


