Abstract
All cytochrome P450 enzyme reactions involve a catalytic cycle with several discreet physical or chemical steps. This cycle ends with the formation of the reactive heme iron-oxygen complex, which oxygenates substrate. While the steps might be very similar for each P450 enzyme, the rates of each step varies tremendously for each enzyme and sometimes even for different reactions catalyzed by the same enzyme. For example, the rate-limiting step for most bacterial P450 enzymes, with turnover numbers over 1,000 sec−1, is the second electron transfer. In contrast, steroidogenic P450s from eukaryotes catalyze much slower reactions, with turnover numbers of ~5–250 min−1; therefore, assumptions about kinetic properties for the mammalian P450 enzymes based on the bacterial enzymes are tenuous. In order to dissect the rates for individual steps, special techniques that isolate individual steps and/or single turnovers are required. This article will review the theoretical principles and practical considerations for several of these techniques, with illustrative published examples. The reader should gain an appreciation for the appropriate methods used to interrogate particular steps in the P450 reaction cycle.
Graphical abstract
1. Cytochrome P450 enzymes
Omura and Sato first discovered the P450 enzymes from rabbit liver microsomes in 1962 [1]. Human beings have 57 P450 enzymes, which catalyze a variety of reactions using a broad range of substrates. The products of these reactions include steroid hormones, active vitamins and other bioactive lipids, and xenobiotic metabolites. Despite the diversity of P450 chemistries, most reactions are variations of the basic oxygen insertion reaction in a C-H bond, equivalent to the hydroxylation of alkane substrates. The catalytic cycle for this process was first elucidated through the study of bacterial enzymes such as P450cam (P450 101), which led to many of the fundamental concepts in the field. Over time, individual steps were thoroughly studied, by trapping intermediates for spectroscopic characterization.
Following the cloning of cDNAs encoding eukaryotic P450s and the advent of methods to express these enzymes in bacteria, these eukaryotic enzymes have been studied in reconstituted systems with purified proteins. The hepatic P450s have attracted considerable attention, due to their central importance in drug metabolism. The steroidogenic P450s have also been the focus of intense study, due to their prominence in health and disease. The human steroidogenic enzymes include the 3 mitochondrial enzymes CYP11A1 (P450 11A1, P450scc, cholesterol side chain cleavage enzyme), CYP11B1 (P450 11B1, P450c11β, steroid 11β-hydroxylase), and CYP11B2 (P450 11B2, P450c11AS, aldosterone synthase), as well as the 3 microsomal enzymes CYP17A1 (P450 17A1, P450c17, steroid 17α-hydroxylase/17,20-lyase), CYP21A2 (P450 21A2, P450c21, steroid 21-hydroxylase), and CYP19A1 (P450 19A1, P450aro, aromatase). Mutations in the genes encoding the steroidogenic P450 enzymes are all associated with human diseases, and 4 of these enzymes are targets of drugs [2]. Consequently, a detailed understanding of their structures and catalytic mechanisms are important to conceptualize disease-causing mutations and to develop drugs selective for a specific enzyme.
2. Steady-State Enzyme Kinetics Versus Rapid Kinetics
Conventional enzyme kinetic studies determine values for the familiar Michaelis constant (Km) and maximal rate (Vmax) or turnover number (kcat). These experiments involve steady-state measurements of many turnovers for each enzyme molecule over many seconds to minutes. For a P450-catalyzed reaction, each enzyme molecule completes multiple cycles in these steady-state assays, and the rate of product formation reflects the rate of the entire cycle, with no information gleaned about the rate of individual steps. As a general principle of enzymology, however, the overall rate of the reaction is governed by the rate of slowest step in the process, or the rate-limiting step in the sequence. A step is partially rate-limiting if its rate is within a factor of ~5 of other steps, according to the equation: , where kss is the overall reaction rate at steady-state and ki represents the rates of n=i individual steps. With advances in enzymology techniques such as stopped flow, rapid quench, and isotope labeling studies, each individual step of the P450 catalytic cycle can be studied in detail for wild type and mutant variants. These techniques may be employed to determine rates generally on the millisecond timescale, which is typical for most P450 reactions [3].
2.1. Individual Steps in the P450 Catalytic Cycle (9 Different Steps)
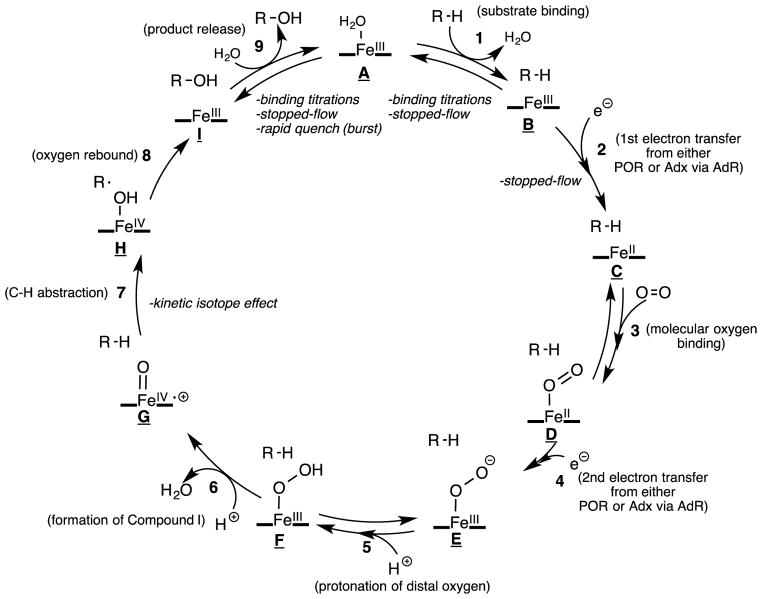
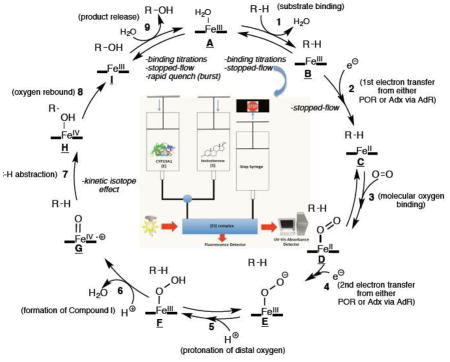
Individual steps in the P450 catalytic cycle for microsomal enzymes include (Scheme 1): 1. substrate binding, 2. first one-electron reduction by P450-oxidoreductase (POR), 3. oxygen binding, 4. second one-electron reduction by POR, 5. protonation of the distal oxygen coordinating to iron, 6. formation of the reactive heme iron-oxygen species (compound I), 7. hydrogen atom abstraction, 8. oxygen rebound with the radical intermediate, 9. product release. For mitochondrial P450 enzymes, the cycle is the same, except the electron donor is the iron-sulfur protein ferredoxin (FDX1, or adrenodoxin), which acts as an electron carrier between the P450 enzyme and ferredoxin reductase (or adrenodoxin reductase) [4]. The experimentally measurable steps discussed in this review are steps 1, 2, 7, and 9. Steps 1, 2, and 9 (i.e. substrate binding, electron transfer, and product release) will be discussed in Section 3.1, where we will describe stopped-flow and binding titration techniques. Section 3.2.1 will also discuss step 9, which will define the experimental setup for rapid chemical quench techniques. Section 4 will discuss the use of kinetic isotope effects to measure step 7 (i.e. C-H abstraction). Although not discussed in detail in this manuscript, there have been reports of measuring the rate of oxygen rebound (step 8) using radical clock substrates [5–7]. These cyclopropane-containing substrates yielded oxygen rebound rates (step 8) in the nanosecond time scale (2–20 ns−1) [5].
Scheme 1.
Catalytic cycle of P450 catalyzed C-H hydroxylation reaction.sc1
2.2. Spectroscopic Measurement of Substrate, Product, or Inhibitor Binding
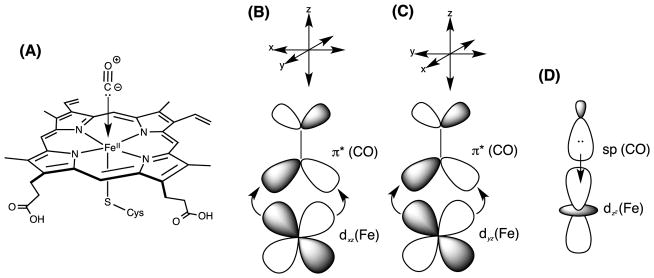
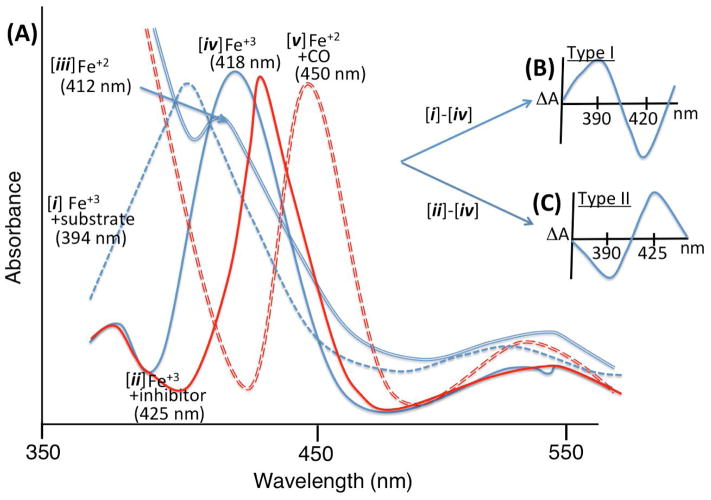
The heme prosthetic group of P450 enzymes exhibits an absorption spectrum in the 400–500 nm (UV-Vis) range, featuring a red-shifted Soret band (π→π* transition) with a peak at 385–425 nm. This spectrum is very sensitive to changes in ligands and redox state and hence changes with each step in the P450 reaction cycle. Consequently, progress along the P450 cycle can be monitored by UV-Vis, at least for intermediates with a lifetime long enough to detect spectroscopically. In addition, other ligands that shift the Soret band might be employed to trap intermediates. For example, carbon monoxide (CO) is a high-affinity ligand for binding to the iron in the ferrous (Fe+2) oxidation state, which is explained by π-backbonding of the unoccupied π* orbital of CO interacting with the occupied d-orbital of iron (Dewar-Chatt-Duncanson model) [8]. The rapid binding of CO to reduced enzyme shifts the Soret band to 450 nm, which is the origin of the “P450” name for these enzymes (Fig. 1). The 450 nm absorption is used to determine the concentration of purified P450 enzymes and to infer the rate of the first electron transfer step. To increase the sensitivity and to simplify the spectra, difference spectra are often obtained, subtracting the spectrum of enzyme in state A in the reference cuvette from an equal concentration of enzyme in state B in the sample cuvette. In addition to ligands, inorganic reductants such as sodium dithionite can be used to supply the first (but not the second) electron and to artificially move the enzyme along in the cycle without POR or FDX1.
Figure 1.
(A) A cartoon showing the cytochrome P450 heme active site (reduced or ferrous, Fe+2) bound to CO ligand. (B), (C), (D): Frontier molecular orbital interaction between the d orbitals of Fe and the p* antibonding molecular orbitals of CO (B and C), or sp-molecular orbital of CO and the dz2 orbital of Fe (D). gr1
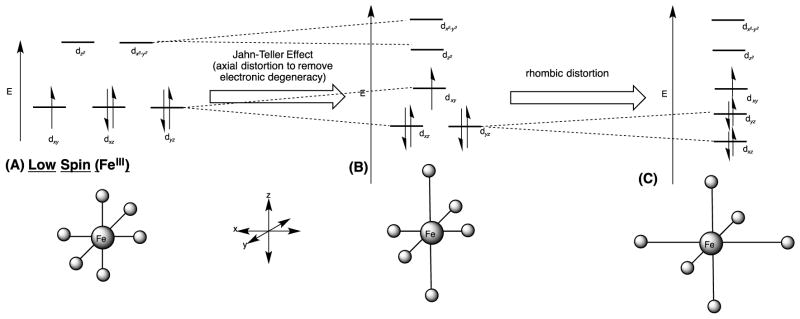
In addition to redox state and CO ligand, substrate and inhibitor binding also induce characteristic spectral changes of the Soret band. The binding of a substrate that also displaces the axial water ligand (Scheme 1, state A to B) induces a change in the iron atom from a low-spin to a high-spin state [9]. In the presence of the substrate, the absorption maximum of the Soret band shifts to a shorter wavelength from spectrum [iv] at 418 nm (Fig. 2A) to spectrum [i] at 394 nm – a blue shift. A corresponding type I difference spectrum (Fig. 2B), subtracting spectrum [iv] from spectrum [i], shows a maximum or “peak” at 390 nm and a minimum or “trough” at 420 nm [10, 11]. When nitrogen-containing inhibitors—typically azoles and related heterocyclic moieties—bind the enzyme and form a complex containing a strong Fe-N bond, the maximum of the Soret band shifts to longer wavelength, from 418 nm to 425 nm – a red shift (Fig. 2A, spectrum [ii]) [12]. A corresponding difference spectrum has a minimum at 390 nm and maximum at 425 nm, which is called a type II difference spectrum, subtracting spectrum [iv] from spectrum [ii] (Fig. 2C). Some ligands induce a reverse-type I binding spectrum, which is explained by a population of high-spin enzyme in the resting state and induction of low-spin state with water or substrate hydroxyl group liganding the heme iron [13]. Based on observations with electron paramagnetic resonance (EPR) spectroscopy [14] and UV-Vis absorption spectra, the high-spin state corresponded to type I ligands [15] and the low-spin state was related to type II ligands [16]. The energy diagram of the d-orbitals for a low-spin ferric (Fe+3) complex is considered in Figure 3 – the paramagnetic character allows for sensitive measurement of iron complexes by EPR spectroscopy [17].
Figure 2.
(A) Cartoon of spectral changes (UV-Vis spectrum) of the heme center with different conditions. Absorption maxima of the Soret band are indicated in parentheses. (B) “Type I” binding difference spectrum. (C) “Type II” binding difference spectrum. For experimental data see reference [18]. The reduction from Fe+3 (ferric) to Fe+2 (ferrous) forms as shown in spectra [ iv ] and [ iii ], respectively, is achieved via addition of solid sodium dithionite.gr2
Figure 3.
Energy diagrams of the low-spin Fe d orbitals of (A) an octahedral ferric (Fe+3) complex (five d -orbital electrons), (B) after axial distortion, and (C) after rhombic distortion. P450 enzymes have been shown to be in the rhombic state based on EPR spectroscopy [20,21].gr3
The spectral changes that occur upon enzyme binding to substrates or inhibitors allow one to measure Kd (or the spectral binding constant, KS) of the substrate or inhibitor. The Kd is determined by plotting the peak-to-trough value from the difference spectra with and without inhibitor as a function of ligand concentrations to determine the concentration where the change is half-maximal by curve fitting. Although nitrogen-containing compounds tend to give type II binding changes, not all aza-aromatic compounds yield a type II binding mode, and more importantly, they do not always lead to inhibition of the enzyme. For instance, there have been cases where P450 enzymes metabolize compounds that induce a type II binding spectrum. An insightful study showed that type II substrates had a higher in vitro metabolic clearance by the enzyme (i.e. catalytic efficiency V/K) compared to the type I counterparts [19]. The authors explain that their type II ligands had higher affinity, which increased the metabolic clearance.
3. Stopped-Flow Technique (Steps 1, 2, 9 – Substrate Binding, First Electron Reduction, Product Release)
The enzymologist can take advantage of these spectral changes upon ligand binding to design experiments that will measure the rates of certain individual steps (see section 3.1).
3.1. Stopped-Flow with Spectroscopy
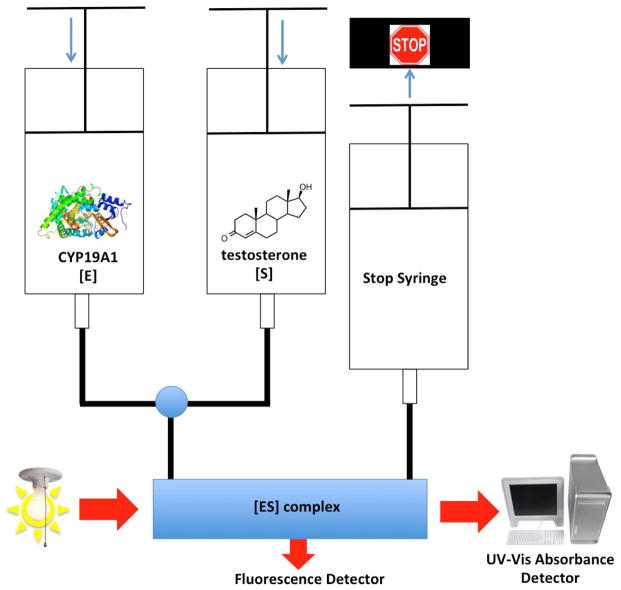
A stopped-flow apparatus may be used to measure the binding rate of the substrate to the enzyme. Figure 4 illustrates the approach used to determine the kinetics of testosterone binding to aromatase (CYP19A1) [22]. By analogy, the rate of change in the UV-Vis spectrum yields individual kon and koff rates for the ligand. These spectral changes are typically too rapid to measure in a conventional spectrophotometer and require the use of a stopped-flow instrument for precise sampling on the millisecond time scale. Stopped-flow instruments enable rapid mixing of enzyme and reagents with prompt and continuous measurement of some parameter such as UV-Vis absorbance. In this experiment, the stopped-flow instrument would have two syringes—one syringe containing the enzyme and the other syringe containing the ligand—and the mixing chamber would immediately deliver the solution to a chamber equipped with a spectrophotometer to monitor the shift in the Soret peak as a function of time. If the different ligand concentrations yield different rates of binding, then a plot of kobs vs. [S] yields a linear equation, which is fit to a 2-state model: kobs = kon[S] + koff, where kon is the slope and koff is the y-intercept, while kobs is the measured rate of spectral change. The koff rate of a substrate is more difficult to measure but can be determined if a rapid- and tight-binding inhibitor such as ketoconazole is available. In this case, the first syringe would contain ligand bound to enzyme, and the second syringe would contain a large excess of inhibitor. The spectrophotometer would monitor the change from type I to type II spectrum.
Figure 4.
Setup for stopped-flow studies to determine binding rates of substrate with enzyme to form the [ES] complex. Enzyme structure is of the human placental aromatase (CYP19A1, PDB: 3EQM), and the experimental design was used to measure the rates of step 1 (Scheme 1).gr4
Variations in the stopped flow-method can be used to interrogate other steps in the cycle. For example, one could measure the rate of the first electron transfer by mixing a CO-saturated solution of enzyme in one syringe with POR and NADPH in the other syringe and monitoring the change in absorbance at 450 nm. As soon as electron transfer occurs, CO will bind the ferrous iron (Fe+2) and shift the Soret band [23]. An example of this experimental setup was nicely illustrated with CYP11B1 and its electron-transfer partners, FDXR and FDX1. One syringe contained the enzyme, CYP11B1, and the other syringe contained NADPH, FDXR and FDX1, while both syringes were saturated with CO [24]. Upon rapid mixing, the iron in CYP11B1 was reduced from Fe+3 to Fe+2 and immediately formed the CO complex with spectral shift to 450 nm. The rate of the spectral change reported the rate of CYP11B1 reduction and yielded three phases, with rate constants of 60 s−1, 3.9 s−1, and 0.65 s−1, suggesting the presence of different conformational species between redox partners and enzyme.
3.2. Rapid Quench Technique
3.2.1. Rapid Chemical Quench (Step 9, Product Release)
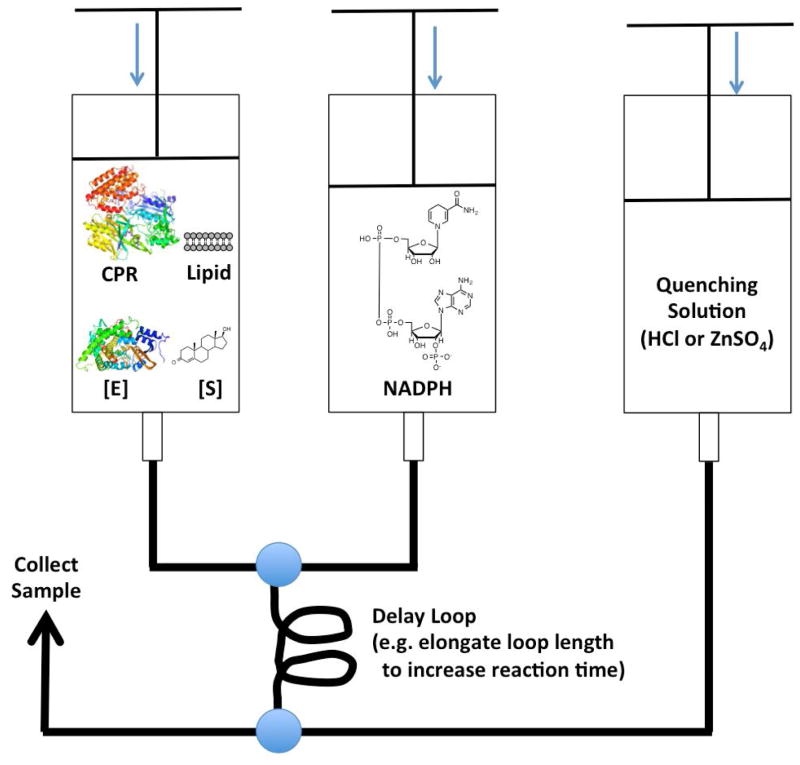
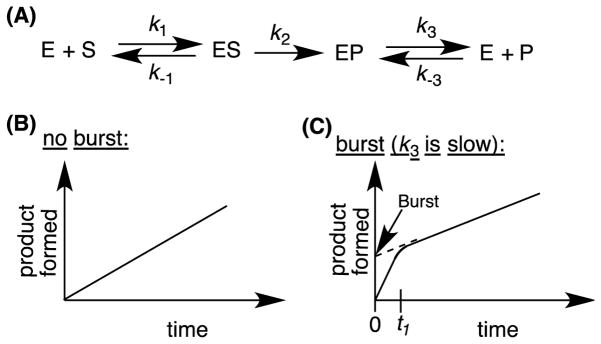
Rapid chemical quench is another technique to study the product release step (Figure 5). In the special case where product release is rate-limiting, a distinguishing feature of the reaction is that the formation of the first product molecule for each enzyme molecule is faster than subsequent turnovers, which do not occur until product is released. For these systems, a burst phase occurs, because the initial velocity of the reaction during the first turnover is faster than subsequent turnovers, and once all of the enzyme molecules have formed product, the rate reflects the steady-state rate. A rapid chemical quench apparatus can be used to measure burst phase kinetics in an enzyme that catalyzes a single chemical step with a rate k2 (Figure 6) by taking multiple samples during the time required for all enzyme molecules to form one molecule of product. An exhaustive list of spectroscopic techniques will not be discussed in this section, but another technique worth mentioning is resonance Raman spectroscopy, which selectively measures the vibrational modes of the heme group in P450 enzymes. This technique was used to observe the different P450 species depending on the substrate used [25, 26].
Figure 5.
Setup for the rapid chemical quench apparatus. Structure of human placental aromatase (PDB: 3EQM). Structure of CPR: Rat NADPH-Cytochrome P450 Reductase (PDB: 3WKT).gr5
Figure 6.
(A) An enzyme-catalyzed single-step reaction including substrate binding ( k 1), product formation ( k 2), and product release ( k 3). (B) The plot of product formed with respect to time in the absence (B), and presence (C) of a burst. The point t 1 is the time required to form one molecule of product per molecule of enzyme.gr6
In Figure 6A, the ES complex could be a series of intermediates (ES1, ES2, ES3, etc) such as the intermediates B, C, D, E, F, and G in the P450 catalytic cycle (Scheme 1), while the EP is the nascent enzyme-bound product complex (intermediate I in Scheme 1).
This experimental set up has been employed in the study of CYP21A2 [27, 28]. The design is to use an excess of substrate (1 μM enzyme in one syringe and 20 μM substrate in the other) in the rapid-quench apparatus. A series of experiments are performed pushing substrate and enzyme at a constant flow rate between the point of mixing and the quench chamber, containing acid or other reagent to stop the reaction. By varying the length of the tubing (loop) connecting the mixing point and the quench chamber, the time of the reaction is varied. Samples are obtained on the millisecond time scale at several times prior to the formation of one molar equivalent of product to determine the initial rate of the reaction. In the case of 17-hydroxyprogesterone, no burst was observed; however, when progesterone was used as the substrate, a burst was observed [28]. Thus, the rate-limiting step can be substrate-specific for a given P450.
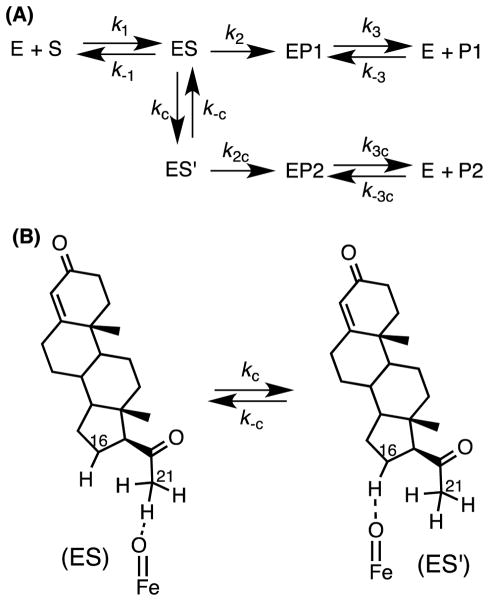
Although a rate-limiting product release step can explain the observation of a burst (Fig. 6A, k3), it may not necessarily be the only explanation for the burst. For example, the reversible equilibrium of an enzyme-substrate complex between an active form and an alternate form can explain a partial burst. For example, the observation that the substrate progesterone (1) yields both 11-deoxycorticosterone (2) and 16α-hydroxyprogesterone (3) with CYP21A2 suggests that a conformer of the ES complex (Fig. 7, ES′) exists so that the 16-position of progesterone (Fig. 7B) is exposed to the active iron center of CYP21A2. If k-c and k2c rates are slow (Fig. 7A) relative to kc, then the ES′ complex would build up over time, resulting in the burst phase kinetics. In the burst phase (initial rate of product formed vs. time in Fig. 6C, i.e. from time = 0 to time = t1), there is more free enzyme available to form P, however, after a certain time t, the ES′ complex builds up and occupies free enzyme, slowing down the rate (after time = t1).
Figure 7.
(A) Illustration of a conformational change in the ES complex of CYP21A2. (B) The ES′ complex is proposed to be the complex giving rise to the 16α-hydroxyprogesterone product. P1: 11-deoxycorticosterone (21-hydroxyprogesterone), P2: 16α-hydroxyprogesterone.gr7
3.2.2. Rapid-Freeze Quench (Isolation of Compound I and Compound II)
Although the rapid-freeze quench technique has not been employed with human steroidogenic cytochrome P450 enzymes, it is worthwhile to discuss the recent advances in this method to illustrate its potential application to study physiologically relevant enzymes.
The rapid-freeze quench variation of this technique has been used to measure the rate of formation of Compound I for CYP119 (Scheme 1, intermediate G) using spectroscopic methods (e.g. EPR, Mössbauer) [29]. In order to measure the iron active species by Mossbauer spectroscopy, the protein must be expressed using 57Fe isotope [30]. In the quenching step after mixing the enzyme with meta-chloroperbenzoic acid to oxidize the heme iron, the complex was sprayed with liquid ethane (−183 C). In addition to Mössbauer spectroscopy measurements, EPR measurements may also be made to analyze the freeze-quenched samples to characterize the active iron species such as Compound I.
Additionally, Compound II (Scheme 1, intermediate H) has been spectroscopically measured using the CYP158 enzyme [31]. Compound II was formed as a result of hydrogen atom abstraction of nearby tyrosine groups by Compound I. When the tyrosine groups were mutated to phenylalanine, Compound II formation was decreased to 3% and Compound I was stable (90% yield). Furthermore, the pKa of Compound II (Fe+4-OH) was measured to be ~12, which is higher than the pKa values of axial histidine-ligated heme enzymes by 8.5 units. This difference in pKa suggests a possible explanation for different chemistry catalyzed by the two classes of enzymes (e.g. cysteine-ligated P450s catalyze RH → ROH, and histidine-ligated peroxidases catalyze ROOR → 2ROH). Additionally, the axial cysteine residue in P450 enzymes is the reason for the 450 nm Soret band upon CO binding [32]. If the axial cysteine residue is mutated to a histidine, then the Soret band appears at 420 nm [33].
3.2.3. Generation and Observation of Compound I from Hydroperoxide Substrates
Compound I was trapped with EPR spectroscopy using bovine CYP11A1 purified from adrenal glands and a cholesterol hydroperoxide substrate (20R)-20-hydroperoxycholesterol in the absence of electron-transfer partners [34]. After addition of (20R)-20-hydroperoxycholesterol to the enzyme at room temperature, the mixture was frozen at 25 and 300 seconds with cold acetone at −60 C and characterized with EPR spectroscopy, which resulted in the observation of the Fe+4 π-cation radical (Compound I). Over time, the hydroperoxide substrate had converted to (20S)-20,21-dihydroxycholesterol, which can be explained by 21-hydrogen atom abstraction by the Compound I generated in situ. The conversion of hydroperoxycholesterol derivatives to dihydroxycholesterol products was confirmed using the purified recombinant bovine CYP11A1 enzyme in a later report [35].
4. Kinetic Isotope Effects (Step 7, C-H Abstraction Step)
Physical organic chemists have employed kinetic isotope effects (KIEs) for decades to probe the mechanisms of reactions. Most commonly, deuterium is substituted for hydrogen at the site of interest, and the change in rate of the reaction is the KIE. The KIE derives from the difference in zero-point energy of a C-H bond versus a C-2H bond, due to the greater reduced mass and hence lower zero-point vibrational energy of the C-2H bond. Since the vibrational energy is essentially removed in a symmetrical transition state, the activation energy is greater for breaking the C-2H bond, and the rate of the reaction is reduced. The theoretical maximum of the deuterium KIE at 25C is about 7, although much larger KIE values can be observed if the mechanism involves proton-coupled electron transfer (hydrogen atom tunneling).
4.1. Intermolecular Kinetic Isotope Effect (DV, DV/K)
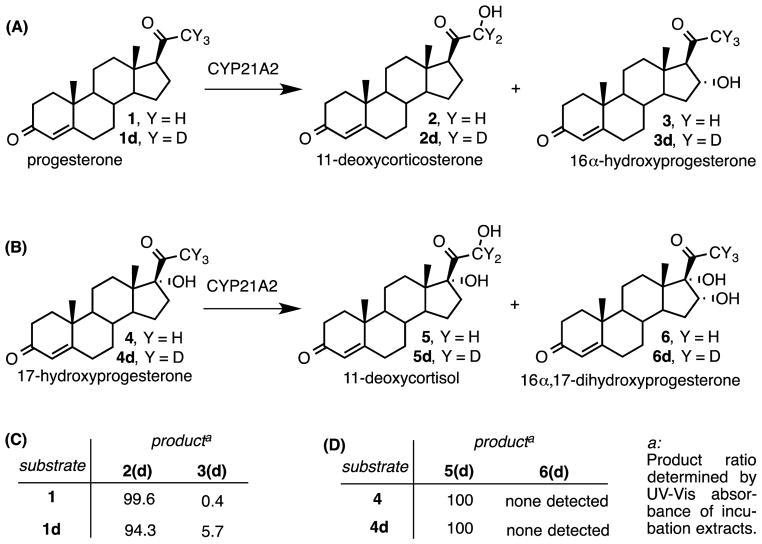
Consequently, deuterated P450 substrates allow for measurement of how rate-limiting the C-H abstraction step is in the overall catalytic cycle. Typically, a deuterated substrate is synthesized, and the rate of oxidation is tested over steady-state conditions. The Vmax and Vmax/Km values are compared for the non-deuterated and deuterated substrates, and this measurement is termed intermolecular non-competitive KIE. For some steroid metabolizing enzymes with turnover numbers ~10/min, C-H bond breaking is significantly rate-limiting, leading to KIE values >2. For human CYP21A2, the intermolecular KIE values for 21-hydroxylation of progesterone (Fig. 8, 1 or 1d) or 17-hydroxyprogesterone (Fig. 8, 4 or 4d) vary from 2–8 depending on substrate and enzyme system [28, 36]. For human CYP17A1, the intermolecular KIEs are near 2 for the 17-hydroxylation of progesterone or pregnenolone [36].
Figure 8.
The reactions catalyzed by wild-type CYP21A2 with (A) progesterone substrate (1or1d) and (B) 17-hydroxyprogesterone substrate (4or4d).gr8
4.2. Intramolecular Kinetic Isotope Effect (Metabolic Switching)
In some P450 enzymes, 2 or more different C-H site are hydroxylated, and deuterium incorporation at one of these sites often shifts reactivity to the non-deuterated positions, a process called metabolic switching. This phenomenon is quantitated as the intramolecular, non-competitive KIE and measured by comparing the product ratios derived from the deuterated and natural-abundance substrates.
For example, CYP21A2 has two different substrates: progesterone and 17-hydroxyprogesterone (Fig. 8, 1 and 4), and the 21-hydroxylated products are 11-deoxycorticosterone (2) and 11-deoxycortisol (5), respectively. Wild-type CYP21A2 also 16α-hydroxylates <1% of progesterone, and CYP21A2 mutation V359A was engineered to 16α-hydroxylate 40% of progesterone [37]. Thus, deuterium substitution at C21 or C16 can be used to probe for metabolic switching between C21 and C16 for CYP21A2 and its mutations. When [21,21,21-2H3]-progesterone (1d) was used as a substrate for CYP21A2, metabolic switching occurred where hydroxylation increased at the C16-position [36]. However, switching to C16 did not occur when 17-hydroxyprogesterone (Fig. 8, 4 or 4d) was used as the substrate. In contrast, for CYP21A2 mutation V359A, 16α-hydroxyprogesterone was the major product for substrate 1d, and the enzyme also 16α-hydroxylated [21,21,21-2H3]-17-hydroxyprogesterone (4d) to [21,21,21-2H3]-16α,17-dihydroxyprogesterone (6d).
This difference in CYP21A2 hydroxylation at C21 and C16 for progesterone and 17-hydroxyprogesterone substrates can be quantitatively expressed as the intramolecular KIE (kH/kD). For wild-type CYP21A2, the intramolecular KIE at C21 with [21,21,21-2H3]-progesterone (1d) is 2.5, and for CYP21A2 mutation V359A, the intramolecular KIEs at C21 and C16 are 6.2 and 3.8, respectively—larger than the corresponding intermolecular KIEs [36]. Analogously, human CYP17A1 normally hydroxylates the 17- and 16α-positions of progesterone in a 3:1 ratio, and CYP17A1 mutation A105L was engineered to reduce the progesterone 17:16α-hydroxylation ratio to ~9:1 [38]. When the 17-position of progesterone is regioselectively deuterated, the product ratios shift to 1:1 for wild-type CYP17A1 and to ~2:1 for mutation A105L, which yields intramolecular KIEs of 4.1 and 3.8, respectively [36, 39]. These experiments demonstrate how site-directed mutagenesis and isotopically labeled substrates are employed together in biophysical studies to understand the mechanisms of P450 catalysis.
5. Catalysis steps: Steady state rates (E + S → E + P, ES → E + P)
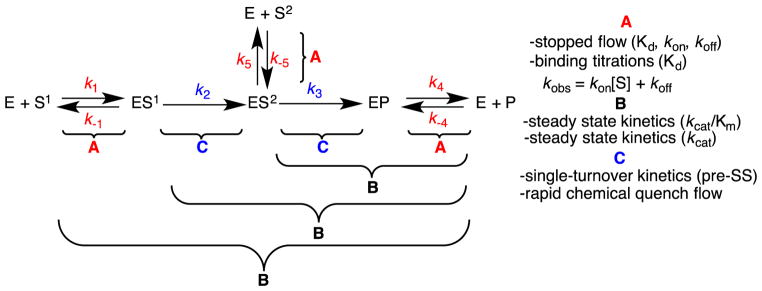
Conceptually, a pre-steady state experiment is designed similar to an initial burst study in order to measure the rate of the first turnover. This type of experiment can be expanded to study enzymes that perform sequential reactions, such as CYP17A1, where the product of the 17-hydroxylase reaction is the substrate for the 17,20-lyase reaction. The difference in this case is that an excess of enzyme is used to assure that only one turnover per enzyme molecule is measured [40]. Thus, pre-steady state, single-turnover experiments can be run with the enzyme and either the initial substrate, S1, or the intermediate, S2, where [E]>[S1] or [E]>[S2]. Therefore, in the case where [E]>Kd, the kobs = k2 for S1 and kobs = k3 for S2 (Fig. 9). The experiment will be set up using a rapid chemical quench apparatus having preformed ES1 or ES2 complex in one syringe mixed with POR and NADPH in the second syringe. After some mixing time, the reaction is quenched to measure the intermediate or product formation [41].
Figure 9.
Individual rate constants that can be measured of a two-step reaction through experiments discussed in the text. pre-SS: pre-steady state.gr9
From steady-state kinetic experiments (Michaelis-Menten), where the d[ES]/dt is approximated to zero, we can calculate kcat (ES → E + P) and kcat/Km (E + S → E + P). The enzymatic activities (kcat values) of the six steroidogenic cytochromes P450 (CYP11A1, CYP11B1, CYP11B2, CYP17A1, CYP19A1, and CYP21A2) and other sterol metabolizing enzymes have been reported (Table 1). Because of the hydrophobic nature of steroids, the solubility of these substrates in experimental conditions is uncertain, and thus apparent Km values must be interpreted with caution. For example, 2-hydroxypropyl-β-cyclodextrin has been used to solubilize lipophilic cholesterol in aqueous media in order to measure cholesterol-binding properties to P450 enzymes [42].
Table 1.
Reported kcat and apparent Km values for human cytochrome P450 reactions in steroid and sterol metabolism.
| Enzyme | Substrate →Product | kcat | Km | ref |
|---|---|---|---|---|
| CYP3A4 | testosterone →6β-testosterone | 1.3 s−1 | 23 μM | [43] |
| CYP7A1 | cholesterol →7α-hydroxycholesterol | 3.1 s−1 | 1.3 μM | [44] |
| CYP11A1a | cholesterol →pregnenolone | 0.021 s−1 | 14 μM | [45] |
| CYP11A1 | 20R,22R-dihydroxycholesterol →pregnenolone | 4.1 s−1 | 10 μM | [46] |
| CYP11B1 | 11-deoxycorticosterone →corticosterone | 1.35 s−1 | -- | [47] |
| CYP11B1 | 11-deoxycortisol →cortisol | 1.61 s−1 | -- | [47] |
| CYP11B1 | corticosterone →18-hydroxycorticosterone | 0.008 s−1 | -- | [47] |
| CYP11B2 | 11-deoxycorticosterone →corticosterone | 0.63 s−1 | -- | [47] |
| CYP11B2 | corticosterone →aldosterone | 0.011 s−1 | -- | [47] |
| CYP17A1b | pregnenolone →17-hydroxypregnenolone | 0.037 s−1 | 0.65 μM | [48] |
| CYP17A1c (+b5) | pregnenolone →17-hydroxypregnenolone | 0.065 s−1 | 0.65 μM | [48] |
| CYP17A1b | progesterone →17-hydroxyprogesterone | 0.056 s−1 | 1.0 μM | [48] |
| CYP17A1c (+b5) | progesterone →17-hydroxyprogesterone | 0.078 s−1 | 1.0 μM | [48] |
| CYP17A1c,d (+b5) | 17-hydroxypregnenolone →DHEA | 0.041 s−1 | 1.2 μM | [48] |
| CYP17A1c,d (+b5) | 17-hydroxyprogesterone →androstenedione | 0.030 s−1 | 5.0 μM | [48] |
| CYP19A1 | androstenedione →estrone | 0.060 s−1 | 44 nM | [22] |
| CYP19A1 | 19-oxoandrostenedione →estrone | 0.42 s−1 | 18 μM | [22] |
| CYP21A2 | progesterone →11-deoxycorticosterone | 2.8 s−1 | 0.21 μM | [28] |
| CYP21A2 | 17-hydroxyprogesterone →11-deoxycortisol | 4.0 s−1 | 1.5 μM | [28] |
| CYP24A1 | 1,25-dihydroxyvitamin D3 →1,24,25-trihydroxyvitamin D3 | 0.44 s−1 | -- | [49] |
d17,20-lyase activity only measured in the presence of cytochrome b5
6. Multiple Step Reactions – Processivity
Several cytochrome P450 enzymes catalyze multiple step reactions. There are four steroidogenic P450 enzymes that catalyze reactions through more than one step:
CYP11A1 (cholesterol to pregnenolone) – 22R-hydroxylation, then 20R-hydroxylation, followed by C20-C22 bond cleavage;
CYP11B2 (11-deoxycorticosterone to aldosterone) – 11β-hydroxylation, followed by two successive hydroxylations at the 18-methyl position, yielding the 11β,18-hemiacetal;
CYP17A1 (pregnenolone to DHEA) – 17-hydroxylation followed by C17–C20 bond cleavage; and
CYP19A1 (androstenedione to estrone) – two hydroxylations on the 19-methyl position, followed by C10–C19 bond cleavage.
6.1. Processivity: Pulse-Chase Assays
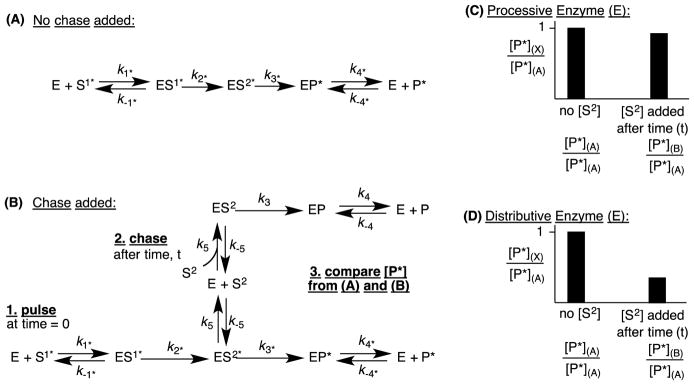
Processivity refers to the sequential transformation of a substrate through 2 (or more) catalytic cycles without the release of the product from the first cycle (Fig. 10A). For a 2-step reaction, this terminology is equivalent to asking if the intermediate is released from the active site prior to the initiation of the second catalytic cycle. In addition to calculating the individual rate constants to measure the processivity, pulse-chase assays may be performed to directly test for processivity. The experiment is set up so that a labeled (i.e. radiolabeled or deuterated) substrate (S1*) is incubated with the enzyme, and after some time increment, a large amount of unlabeled intermediate (S2) is added to the incubation (Fig. 10B). The amount of labeled product formed (P*) is compared in the case where there was a chase added (addition of S2, Fig. 10B) to the case where there was no chase added (no S2, Fig. 10A). If the amount of labeled product (P*) is substantially less when chase is added (Fig. 10D), then the reaction is said to be distributive (less processive), meaning that intermediate S2* is primarily released before the second turnover and hence competes with unlabeled S2. If the amount of labeled product (P*) is about the same with and without the chase (S2) (Fig. 10C), then the reaction is processive, and the intermediate S2* primarily remains bound in the active site and cannot be competed with unlabeled S2. Furthermore, the amount of unlabeled intermediate [S2] can be varied to measure the concentration effects on the processivity of the enzyme. This experiment has been performed with CYP19A1 (aromatase) in the three step conversion of androstenedione to estrone [22]. CYP19A1 was found to be distributive with little or no processivity.
Figure 10.
An illustration of a pulse-chase experiment of an enzyme that catalyzes a successive 2-step reaction. (A) The reaction starting with labeled substrate (S1*) that occurs without adding an unlabeled intermediate. (B) An experiment with labeled substrate (S1*) where a chase of unlabeled intermediate (S2) is added at time t. Theoretical results obtained from a (C) processive enzyme and a (D) distributive enzyme. [P*](A) is the amount of product detected without a chase (S2) added as shown in (A) and [P*](B) is the amount of labeled product detected in (B).gr10
Interestingly, processivity has been measured in terms of observing intermediates by varying the interaction between the P450 and its redox partner. The cholesterol side-chain cleavage enzyme (CYP11A1) catalyzes the conversion of cholesterol to pregnenolone in three steps, via the sequential intermediates 22R-hydroxycholesterol and 20R,22R-dihydroxycholesterol. Contrary to expectations, the ratio of the intermediates to final product (pregnenolone) increases when the amount of the electron transfer partner FDX1 is reduced to subsaturating relative to P450 enzyme [52]. Similarly, in the case of CYP19A1, when the P450 enzyme was increased relative to the redox partner, POR, the production of 19-oxygenated androgen intermediates was increased [53]. These results suggest that processivity might be a function of redox partner abundance for some enzymes.
In addition, a combination of rapid kinetics and structural studies can provide models of substrate-specific processivity. Using pulse-chase experiments, zebrafish CYP17A1 has been shown to be more processive with the Δ5-sequence pregnenolone to 17-hydroxypregnenolone to DHEA compared to the Δ4-sequence progesterone to 17-hydroxyprogesterone to androstenedione [54]. A possible explanation for this increased processivity for pregnenolone versus progesterone is the presence of the hydrogen bond between serine-215 in the crystal structure of zebrafish CYP17A1 and the 3β-hydroxy group of Δ5-steroids but not the 3-ketone of Δ4-steroids. As a result, the estimated ratio of turnover/dissociation rates for the 17-hydroxylated intermediates is ~0.1 for 17-hydroxyprogesterone but ~2 for 17-hydroxypregnenolone [54]. In the crystal structure of human CYP17A1, asparagine-202 hydrogen bonds to both the 3β-hydroxy group of Δ5-steroids and the 3-ketone of Δ4-steroids [55]; however, the dynamic properties of these interactions are not known.
6.2. Measuring Processivity from Single-Turnover Experiments
Processivity was also measured in terms of intermediate release rates using rapid chemical quench [22, 56]. Using single turnover conditions in which the amount of enzyme is about equal to the amount of substrate, the substrate, intermediate(s), and final product can be measured with a rapid chemical quench apparatus. The information gathered from this experiment can be useful in determining if there is a “lag” phase in the formation of the final product. If there is a lag phase in forming the final product, then the intermediates are freely dissociating from the enzyme active site, suggesting that the enzyme is distributive. In the aromatase study, the reaction monitored was the 3-step transformation: androstenedione → 19-hydroxyandrostenedione → 19-oxoandrostenedione → estrone. A lag phase was observed in the formation of the final product, estrone; this result from the single turnover assay was consistent with the results from the pulse-chase experiments (i.e. Fig. 10D).
7. Summary and limitations
Rapid kinetics techniques can dissect the rates of individual steps for P450-catalyzed reactions, including substrate binding, electron transfer, product release, and chemical steps. Combined with KIE experiments, these powerful methods can illuminate differences in enzymes and the reactions they catalyze, including the rate-limiting steps and processivity for sequential pathways. In some cases, observation of different “phases” in these rapid kinetics studies can reveal different conformations of the enzyme structure upon ligand [22] or redox partner [24] binding. Similarly, corresponding examples of structural changes in the P450 enzyme upon ligand binding have been shown through X-ray crystallography: substrate-free enzyme is in the “open” conformation whereas the substrate-bound enzyme is in the “closed” conformation [57].
The main limitation of studying individual steps of P450 enzymes is that a large amount of enzyme must be expressed and purified. One measurement on the stopped-flow apparatus requires up to 100 nmol of enzyme, so a good enzyme expression and purification system has to be established. This system may take at least a few months to establish the right strain of bacteria, plasmid, induction technique, and purification protocol. A second limitation is the availability of labeled substrates and intermediates, which might not be commercially available and require chemical synthesis and structural confirmation. A third limitation is access to a suitable rapid kinetics apparatus, which are expensive and difficult to maintain. Some institutions operate core facilities to increase access of investigators to the instrumentation. A fourth limitation is the capacity to perform the complex mathematical analysis of the data. Global fitting software such as DYNAFIT [58] are now available to determine rate constants from rapid kinetics data. The modeling program approximates the data to an equation to explain the behavior of the enzyme-catalyzed reaction and covers most enzyme systems commonly encountered. The final limitation is the creativity of the investigator. We hope that this discussion and will inspire enzymologists to consider innovative experiments to answer the vexing questions about how the P450 enzymes of steroid biosynthesis catalyze these essential and fascinating reactions.
Highlights.
The cytochrome P450 reaction cycle has several microscopic steps
Rapid-kinetics experiments permit the study of transient intermediates
Single-turnover experiments determine if product release is rate-limiting
A kinetic isotope effect is observed if C-H bond breaking is rate-limiting
Acknowledgments
This work was supported by grant R01GM086596 (to R.J.A.); F.K.Y. is supported by grant T32ES007028.
Abbreviations
- CYP
Cytochrome P450
- POR
P450 oxidoreductase (cytochrome P450 reductase)
- cDNA
complementary DNA
- FDX1
ferredoxin, ferredoxin reductase, FDXR
- EPR
electron paramagnetic resonance
- KIE
kinetic isotope effect
- UV-Vis
ultraviolet-visible
Footnotes
Publisher's Disclaimer: This is a PDF file of an unedited manuscript that has been accepted for publication. As a service to our customers we are providing this early version of the manuscript. The manuscript will undergo copyediting, typesetting, and review of the resulting proof before it is published in its final citable form. Please note that during the production process errors may be discovered which could affect the content, and all legal disclaimers that apply to the journal pertain.
References
- 1.Omura T, Sato R. A New Cytochrome in Liver Microsomes. J Biol Chem. 1962;237:PC1375–PC1376. [PubMed] [Google Scholar]
- 2.Miller WL, Auchus RJ. The Molecular Biology, Biochemistry, and Physiology of Human Steroidogenesis and Its Disorders. Endocr Rev. 2011;32:81–151. doi: 10.1210/er.2010-0013. [DOI] [PMC free article] [PubMed] [Google Scholar]
- 3.Guengerich FP. Reduction of Cytochrome b5 by NADPH-Cytochrome P450 Reductase. Archives of Biochemistry and Biophysics. 2005;440:204–211. doi: 10.1016/j.abb.2005.06.019. [DOI] [PubMed] [Google Scholar]
- 4.Ziegler GA, Vonrhein C, Hanukoglu I, Schulz GE. The Structure of Adrenodoxin Reductase of Mitochondrial P450 Systems: Electron Transfer for Steroid Biosynthesis. J Mol Biol. 1999;289:981–990. doi: 10.1006/jmbi.1999.2807. [DOI] [PubMed] [Google Scholar]
- 5.He X, de Montellano PR. Radical Rebound Mechanism in Cytochrome P-450-Catalyzed Hydroxylation of the Multifaceted Radical Clocks - and -Thujone. J Biol Chem. 2004;279:39479–39484. doi: 10.1074/jbc.M406838200. [DOI] [PubMed] [Google Scholar]
- 6.Cooper HLR, Groves JT. Molecular Probes of the Mechanism of Cytochrome P450. Oxygen Traps a Substrate Radical Intermediate. Archives of Biochemistry and Biophysics. 2011;507:111–118. doi: 10.1016/j.abb.2010.11.001. [DOI] [PMC free article] [PubMed] [Google Scholar]
- 7.Atkinson JK, Hollenberg PF, Ingold KU, Johnson CC, Tadic ML, Newcomb M, Putt DA. Cytochrome P450-Catalyzed Hydoryxlation of Hydrocarbons: Kinetic Deuterium Isotope Effects for the Hydroxylation of an Ultrafast Radical Clock. Biochemistry. 1994;33:10630–10637. doi: 10.1021/bi00201a009. [DOI] [PubMed] [Google Scholar]
- 8.Ohta T, Pal B, Kitagawa T. Excited State Property of Hardly Photodissociable Heme-CO Adduct Studied by Time-Dependent Density Functional Theory. J Phys Chem B. 2005;109:21110–21117. doi: 10.1021/jp052158h. [DOI] [PubMed] [Google Scholar]
- 9.Johnston WA, Hunter DJB, Noble CJ, Hanson GR, Stok JE, Hayes MA, De Voss JJ, Gillam EMJ. Cytochrome P450 Is Present in Both Ferrous and Ferric Forms in the Resting State within Intact Escherichia coli and Hepatocytes. J Biol Chem. 2011;286:40750–40759. doi: 10.1074/jbc.M111.300871. [DOI] [PMC free article] [PubMed] [Google Scholar]
- 10.Schenkman JB, Remmer H, Estabrook RW. Spectral studies of drug interaction with hepatic microsomal cytochrome. Mol Pharmacol. 1967;3(2):113–123. [PubMed] [Google Scholar]
- 11.Moldeus P, Grundin R, von Bahr C, Orrenius S. Spectral studies on drug-cytochrome P-450 interaction in isolated rat liver cells. Biochem Biophys Res Commun. 1973;55(3):937–944. doi: 10.1016/0006-291x(73)91233-3. [DOI] [PubMed] [Google Scholar]
- 12.Locuson CW, Hutzler JM, Tracy TS. Visible Spectra of Type II Cytochrome P450-Drug Complexes: Evidence that “Incomplete” Heme Coordination is Common. Drug Metabolism and Disposition. 2007;35:614–622. doi: 10.1124/dmd.106.012609. [DOI] [PubMed] [Google Scholar]
- 13.Correia MA, Hollenberg PF. Inhibition of Cytochrome P450 Enzymes. Springer International; New York: 2015. [Google Scholar]
- 14.Murakami K, Mason HS. An Electrton Spin Resonance Study of Microsomal Fex. J Biol Chem. 1967;242:1102–1110. [PubMed] [Google Scholar]
- 15.LeLean JE, Moon N, Dunham WR, Coon MJ. EPR Spectrometry of Cytochrome P450 2B4: Effects of Mutations and Substrate Binding. Biochem Biophys Res Commun. 2000;278:762–766. doi: 10.1006/bbrc.2000.3539. [DOI] [PubMed] [Google Scholar]
- 16.Cramer W, Schenkman JB, Estabrook Rw. EPR Measurements of Substrate Interaction with Cytochrome P-450. Biochem Biophys Res Commun. 1966;23 doi: 10.1016/0006-291x(66)90539-0. [DOI] [PubMed] [Google Scholar]
- 17.Walker FA. Magnetic Spectroscopic (EPR, ESEEM, Mossbauer, MCD and NMR) Studies of Low-Spin Ferriheme Centers and Their Corresponding Heme Proteins. Coordination Chemistry Reviews. 1999;185–186:471–534. [Google Scholar]
- 18.Migita CT, Zhang X, Yoshida T. Expression and Characterization of Cyanobacterium Heme Oxygenase, a Key Enzyme in the Phycobilin Synthesis. Eur J Biochem. 2003;270:687–698. doi: 10.1046/j.1432-1033.2003.03421.x. [DOI] [PubMed] [Google Scholar]
- 19.Dahal UP, Joswig-Jones C, Jones JP. Comparative Study of the Affinity and Metabolism of Type I and Type II Binding Quinoline Carboxamide Analogues by Cytochrome P450 3A4. J Med Chem. 2012;55:280–290. doi: 10.1021/jm201207h. [DOI] [PMC free article] [PubMed] [Google Scholar]
- 20.Tsai R, Yu CA, Gunsalus IC, Peisach J, Blumberg W, Orme-Johnson WH, Beinert H. Spin-State Changes in Cytochrome P-450cam on Binding of SPecific Substrates. Proceedings of the National Academy of Sciences. 1970;66:1157–1163. doi: 10.1073/pnas.66.4.1157. [DOI] [PMC free article] [PubMed] [Google Scholar]
- 21.Lipscomb JD. Electron Paramagnetic Resonance Detectable States of Cytochrome P-450cam. Biochemistry. 1980;19:3590–3599. doi: 10.1021/bi00556a027. [DOI] [PubMed] [Google Scholar]
- 22.Sohl CD, Guengerich FP. Kinetic Analysis of the Three-step Steroid Aromatase Reaction of Human Cytochrome P450 19A1. J Biol Chem. 2010;285:17734–17743. doi: 10.1074/jbc.M110.123711. [DOI] [PMC free article] [PubMed] [Google Scholar]
- 23.Farooq Y, Roberts GC. Kinetics of Electron Transfer between NADPH-Cytochrome P450 Reductase and Cytochrome P450 3A4. Biochem J. 2010;432:485–493. doi: 10.1042/BJ20100744. [DOI] [PubMed] [Google Scholar]
- 24.Zollner A, Kagawa N, Waterman MR, Nonaka Y, Takio K, Shiro Y, Hannemann F, Bernhardt R. Purification and Functional Characterization of Human 11β Hydroxylase Expressed in Escherichia coli. FEBS Journal. 2008;275:799–810. doi: 10.1111/j.1742-4658.2008.06253.x. [DOI] [PubMed] [Google Scholar]
- 25.Mak PJ, Luthra A, Sligar SG, Kincaid JR. Resonance Raman Spectrtoscopy of the Oxygenated Intermediates of Human CYP19A1 Implicates a Compound I Intermediate in the Final Lyase Step. J Am Chem Soc. 2014;136:4825–4828. doi: 10.1021/ja500054c. [DOI] [PMC free article] [PubMed] [Google Scholar]
- 26.Mak PJ, Gregory MC, Sligar SG, Kincaid JR. Resonance Raman Spectroscopy Reveals that Substrate Structure Selectively Impacts the Heme-Bound Diatomic Ligands of CYP17. Biochemistry. 2014;53:90–100. doi: 10.1021/bi4014424. [DOI] [PMC free article] [PubMed] [Google Scholar]
- 27.Kominami S, Owaki A, Iwanaga T, Tagashira-Ikushiro H, Yamazaki T. The Rate-Determining Step in P450 C21-Catalyzing Reactions in a Membrane-Reconstituted System. J Biol Chem. 2001;276:10753–10758. doi: 10.1074/jbc.M006043200. [DOI] [PubMed] [Google Scholar]
- 28.Pallan PS, Wang C, Lei L, Yoshimoto FK, Auchus RJ, Waterman MR, Guengerich FP, Egli M. Human Cytochrome P450 21A2, the Major Steroid 21-Hydroxylase: Structure of the Enzyme-Progesterone Substrate Complex and Rate-Limiting C-H Bond Cleavage. J Biol Chem. 2015 doi: 10.1074/jbc.M115.646307. [DOI] [PMC free article] [PubMed] [Google Scholar]
- 29.Rittle J, Green MT. Cytochrome P450 Compound I: Capture, Characterization, and C-H Bond Activation Kinetics. Science. 2010;330:933–937. doi: 10.1126/science.1193478. [DOI] [PubMed] [Google Scholar]
- 30.Krebs C, Price JC, Baldwin J, Saleh L, Green MT, Bollinger JM. Rapid Freeze-Quench 57Fe Mössbauer Spectroscopy: Monitoring Changes of an Iron-Containing Active Site during a Biochemical Reaction. Inorg Chem. 2005;44:742–757. doi: 10.1021/ic048523l. [DOI] [PubMed] [Google Scholar]
- 31.Yosca TH, Rittle J, Krest CM, Onderko EL, Silakov A, Calixto JC, Behan RK, Green MT. Iron(IV)hydroxide pKa and the Role of Thiolate Ligation in C-H Bond Activation by Cytochrome P450. Science. 2013;342:825–829. doi: 10.1126/science.1244373. [DOI] [PMC free article] [PubMed] [Google Scholar]
- 32.Sun Y, Zeng W, Benabbas A, Ye X, Denisov I, Sligar SG, Du J, Dawson JH, Champion PM. Investigation of Heme Ligation and Ligand Switching in Cytochromes P450 and P420. Biochemistry. 2013;52:5941–5951. doi: 10.1021/bi400541v. [DOI] [PMC free article] [PubMed] [Google Scholar]
- 33.Yoshioka S, Takahashi S, Hori H, Ishimori K, Morishima I. Proximal Cysteine Residue is Essential for the Enzymatic Activities of Cytochrome P450cam. Eur J Biochem. 2001;268:252–259. doi: 10.1046/j.1432-1033.2001.01872.x. [DOI] [PubMed] [Google Scholar]
- 34.Larroque C, Lange R, Maurin L, Bienvenue A, van Lier JE. On the Nature of the Cytochrome P450scc “Ultimate Oxidant”: Characterization of a Productive Radical Intermediate. Archives of Biochemistry and Biophysics. 1990;282:198–201. doi: 10.1016/0003-9861(90)90104-7. [DOI] [PubMed] [Google Scholar]
- 35.van Lier JE, Mast N, Pikuleva IA. Cholesterol Hydroperoxides as Substrates for Cholesterol-Metabolizing Cytochrome P450 Enzymes and Alternative Sources of 25-Hydroxycholesterol and other Oxysterols. Angew Chem Int Ed. 2015;54:1–6. doi: 10.1002/anie.201505002. [DOI] [PMC free article] [PubMed] [Google Scholar]
- 36.Yoshimoto FK, Zhou Y, Peng HM, Stidd D, Yoshimoto JA, Sharma KK, Matthew S, Auchus RJ. Minor Activities and Transition State Properties of the Human Steroid Hydroxylases Cytochromes P450c17 and P450c21, from Reactions Observed with Deuterium-Labeled Substrates. Biochemistry. 2012;36:7064–7077. doi: 10.1021/bi300895w. [DOI] [PMC free article] [PubMed] [Google Scholar]
- 37.Mizrachi D, Wang Z, Sharma KK, Gupta MK, Xu K, Dwyer CR, Auchus RJ. Why Human Cytochrome P450c21 is a Progesterone 21-Hydroxylase. Biochemistry. 2011;50:3968–3974. doi: 10.1021/bi102078e. [DOI] [PMC free article] [PubMed] [Google Scholar]
- 38.Swart AC, Storbeck KH, Swart P. A single amino acid residue, Ala 105, confers 16α-hydroxylase activity to human cytochrome P450 17α-hydroxylase/17,20-lyase. J Steroid Biochem Mol Biol. 2010;119:112–120. doi: 10.1016/j.jsbmb.2009.12.014. [DOI] [PubMed] [Google Scholar]
- 39.Yoshimoto FK, Auchus RJ. The Diverse Chemistry of Cytochrome P450 17A1 (P450c17, CYP17A1) J Steroid Biochem Mol Biol. 2014;151:52–65. doi: 10.1016/j.jsbmb.2014.11.026. [DOI] [PMC free article] [PubMed] [Google Scholar]
- 40.Porello SL, Leyes AE, David SS. Single-turnover and pre-steady-state kinetics of the reaction of the adenine glycosylase MutY with mismatch-containing DNA substrates. Biochemistry. 1998;37(42):14756–14764. doi: 10.1021/bi981594+. [DOI] [PubMed] [Google Scholar]
- 41.Fiala KA, Suo Z. Pre-steady-state kinetic studies of the fidelity of Sulfolobus solfataricus P2 DNA polymerase IV. Biochemistry. 2004;43(7):2106–2115. doi: 10.1021/bi0357457. [DOI] [PubMed] [Google Scholar]
- 42.Mast N, Pikuleva IA. A Simple and Rapid Method to Measure Cholesterol Binding to P450s and Other Proteins. J Lipid Res. 2005;46:1561–1568. doi: 10.1194/jlr.D500008-JLR200. [DOI] [PubMed] [Google Scholar]
- 43.Krauser JA, Guengerich FP. Cytochrome P450 3A4-catalyzed Testosterone 6β-Hydroxylation Stereochemistry, Kinetic Deuterium Isotope Effects, and Rate-limiting Steps. J Biol Chem. 2005;280:19496–19506. doi: 10.1074/jbc.M501854200. [DOI] [PubMed] [Google Scholar]
- 44.Shinkyo R, Guengerich FP. Cytochrome P450 7A1 Cholesterol 7α-Hydroxylation: Individual Reaction Steps in the Catalytic Cycle and Rate-Limiting Ferric Iron Reduction. J Biol Chem. 2011;286:4632–4643. doi: 10.1074/jbc.M110.193409. [DOI] [PMC free article] [PubMed] [Google Scholar]
- 45.Neunzig J, Bernhardt R. Dehydroepiandrosterone Sulfate (DHEAS) Stimulates the First Step in the Biosynthesis of Steroid Hormones. PLoS One. 2014;9:e89727. doi: 10.1371/journal.pone.0089727. [DOI] [PMC free article] [PubMed] [Google Scholar]
- 46.Tuckey RC, Cameron KJ. Catalytic Properties of Cytochrome P-450SCC Purified from the Human Placenta: Comparison to Bovine Cytochrome P-450SCC. Biochimica et Biophysica Acta. 1993;1163:185–194. doi: 10.1016/0167-4838(93)90180-y. [DOI] [PubMed] [Google Scholar]
- 47.Strushkevich N, Gilep AA, Shen L, Arrowsmith CH, Edwards AM, Usanov SA, Park HW. Structural Insights into Aldosterone Synthase Substrate Specificity and Targeted Inhibition. Mol Endocrinol. 2013;27:315–324. doi: 10.1210/me.2012-1287. [DOI] [PMC free article] [PubMed] [Google Scholar]
- 48.Lee-Robichaud P, Wright JN, Akhtar ME, Akhtar M. Modulation of the activity of human 17α-hydroxylase-17,20-lyase (CYP17) by cytochrome b5: endocrinological and mechanistic implications. Biochem J. 1995;308:901–908. doi: 10.1042/bj3080901. [DOI] [PMC free article] [PubMed] [Google Scholar]
- 49.Tieu EW, Tang EKY, Tuckey RC. Kinetic Analysis of Human CYP24A1 Metabolism of Vitamin D via the C24-Oxidation Pathway. FEBS Journal. 2014;281:3280–3296. doi: 10.1111/febs.12862. [DOI] [PubMed] [Google Scholar]
- 50.Koshland DE. The Application and Usefulness of the Ratio kcat/KM. Bioorganic Chemistry. 2002;30:211–213. doi: 10.1006/bioo.2002.1246. [DOI] [PubMed] [Google Scholar]
- 51.Eisenthal R, Danson MJ, Hough DW. Catalytic Efficiency and kcat/KM: a Useful Comparator? Trends in Biotechnology. 2007;25:247–249. doi: 10.1016/j.tibtech.2007.03.010. [DOI] [PubMed] [Google Scholar]
- 52.Sugano S, Miura R, Morishima N. Identification of Intermediates in the Conversion of Cholesterol to Pregnenolone with a Reconstituted Cytochrome P-450SCC System: Accumulation of the Intermediate Modulated by the Adrenodoxin Level. J Biochem. 1996;120:780–787. doi: 10.1093/oxfordjournals.jbchem.a021479. [DOI] [PubMed] [Google Scholar]
- 53.Sethumadhavan K, Bellino FL. Human Placental Estrogen Synthetase (Aromatase). Effect of Environment on the Kinetics of Protein-Protein and Substrate-Protein Interactions and the Production of 19-Oxygenated Androgen Intermediates in the Purified Reconstituted Cytochrome P450 Enzyme System. J Steroid Biochem Mol Biol. 1991;39:381–394. doi: 10.1016/0960-0760(91)90050-f. [DOI] [PubMed] [Google Scholar]
- 54.Pallan PS, Nagy LD, Lei L, Gonzalez E, Kramlinger VM, Azumaya CM, Wawrzak Z, Waterman MR, Guengerich FP, Egli M. Structural and kinetic basis of steroid 17α,20-lyase activity in teleost fish cytochrome P450 17A1 and its absence in cytochrome P450 17A2. J Biol Chem. 2015;290:3248–3268. doi: 10.1074/jbc.M114.627265. [DOI] [PMC free article] [PubMed] [Google Scholar]
- 55.Petrunak EM, DeVore NM, Porubsky PR, Scott EE. Structures of Human Steroidogenic Cytochrome P450 17A1 with Substrates. J Biol Chem. 2014;289:32952–32964. doi: 10.1074/jbc.M114.610998. [DOI] [PMC free article] [PubMed] [Google Scholar]
- 56.Yamazaki T, Ohno T, Sakaki T, Akiyoshi-Shibata M, Yabusaki Y, Imai T, Kominami S. Kinetic Analysis of Successive Reactions Catalyed by Bovine Cytochrome P45017α,lyase. Biochemistry. 1998;37:2800–2806. doi: 10.1021/bi9715066. [DOI] [PubMed] [Google Scholar]
- 57.Scott EE, He YA, Wester MR, White MA, Chin CC, Halpert JR, Johnson EF, Stout CD. An Open Conformation of Mammalian Cytochrome P450 2B4 at 1.6-A Resolution. Proceedings of the National Academy of Sciences. 2004;100:13196–13201. doi: 10.1073/pnas.2133986100. [DOI] [PMC free article] [PubMed] [Google Scholar]
- 58.Kuzmic P. Program DYNAFIT for the Analysis of Enzyme Kinetic Data: Application to HIV Proteinase. Analytical Biochemistry. 1996;237:260–273. doi: 10.1006/abio.1996.0238. [DOI] [PubMed] [Google Scholar]


