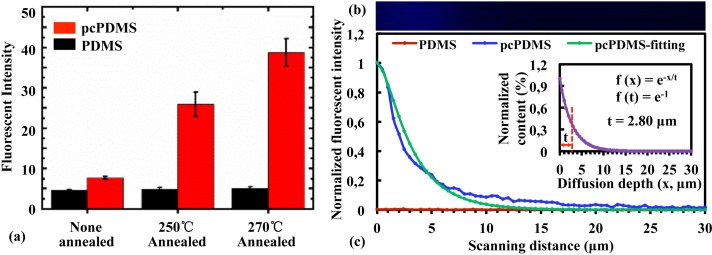
FIG. 4.
Characterization of the caulking status of Parylene C inside PDMS. (a) Fluorescent intensities of PDMS and pcPDMS after annealing at different temperatures for 2 h in nitrogen. (b) Typical fluorescent image of pcPDMS (cross-sectional view) generated by the 3D scanning and reconstruction under confocal microscopy. (c) The distribution of fluorescent intensity of pcPDMS along the z direction (blue line) in comparison with that of PDMS (red line). The green line showed the fitted fluorescent intensity of Parylene C inside the pcPDMS. The inset shows the normalized content of Parylene C inside PDMS matrix.

