Abstract
The poor aqueous solubility of many active pharmaceutical ingredients presents challenges for effective drug delivery. In this study, the combination of attenuated total reflection (ATR)-FTIR spectroscopic imaging with specifically designed polydimethylsiloxane microfluidic devices to study drug release from pharmaceutical formulations has been developed. First, the high-throughput analysis of the dissolution of micro-formulations studied under flowing conditions has been introduced using a model formulation of ibuprofen and polyethylene glycol. The behaviour and release of the drug was monitored in situ under different pH conditions. In contrast to the neutral solution, where both the drug and excipient dissolved at a similar rate, structural change from the molecularly dispersed to a crystalline form of ibuprofen was characterised in the obtained spectroscopic images and the corresponding ATR-FTIR spectra for the experiments carried out in the acidic medium. Further investigations into the behaviour of the drug after its release from formulations (i.e., dissolved drug) were also undertaken. Different solutions of sodium ibuprofen dissolved in a neutral medium were studied upon contact with acidic conditions. The phase transition from a dissolved species of sodium ibuprofen to the formation of solid crystalline ibuprofen was revealed in the microfluidic channels. This innovative approach could offer a promising platform for high-throughput analysis of a range of micro-formulations, which are of current interest due to the advent of 3D printed pharmaceutical and microparticulate delivery systems. Furthermore, the ability to study dissolved drug in solution under flowing conditions can be useful for the studies of the diffusion of drugs into tissues or live cells.
I. INTRODUCTION
Many active pharmaceutical ingredients are poorly soluble in aqueous conditions that present issues with the bioavailability and drug release.1–3 Thus, there is a drive to develop reliable and robust approaches to screen novel formulations in a high-throughput manner.4–6 The use of high-throughput approaches capable of monitoring systems in real time can have great value and would facilitate identification of the physical changes within the formulations. As a result, this can have significant implications for the research and development stages of formulation design.7,8 Recently, there has been much interest in high-throughput studies of pharmaceutical materials in miniaturised vessels or microfluidic devices using a range of analytical approaches.4,9–12 The significant advantage of using microfluidic devices for these types of applications can be of great importance in early drug development.10 For example, it could be particularly useful for high value added materials since only a small amount of sample is needed, hence, the investigation of microparticles that are commonly administered in capsules can be studied.13 Another example considers the potential to test unique 3D printed formulations designed for individual patients; such delivery methods are becoming possible in this industrial sector.14
Drug release studies are of great importance when it comes to the identification of new candidates.1 Common issues associated with active pharmaceutical ingredients can include the stability of polymorphs,8 intermolecular interactions with polymers and co-crystals.2 Analytical approaches for parallel dissolution studies are currently at different stages of development, and one of the most widely employed methods uses UV analysis. UV fibre optic probes are well established for dissolution testing, and this approach can be used to determine the dissolution rate of low solubility drugs.15,16 Also, this method only requires a few milligrams of the sample, and multiple experiments in differing dissolution conditions have been carried out in parallel.17
It is recognised that imaging approaches provide the opportunity to enhance successful drug discovery and many analytical approaches are being developed and utilised to study miniature delivery systems. Windbergs and Weitz have reported the design of a microfluidic chip which was used to study small microparticulate formulations.18 This chip allows visible monitoring of the sample and concentration of the dissolved drug to be determined at the same time. For these studies, the release from the delivery system was analysed using fluorescence microscopy. The assembly of sustained release composites of hydrophobic drugs in nanoparticles using microfluidic devices was recently reported.19 Fluorescence was used to detect the encapsulation of the hydrophobic drugs in the particles that exhibited improved release. UV imaging approaches have also been applied to study the release of drugs from a range of delivery systems. These include investigations into the stability of pure drug forms,20,21 release from transdermal patches,22 and co-crystal stability.23 However, as far as the authors are aware UV imaging has yet to be employed for the study of multiple formulations simultaneously.
In this work, a spectroscopic imaging approach that utilises FTIR spectroscopy, in attenuated total reflection (ATR) mode, with a focal plane array (FPA) detector was used. ATR mode was selected in this work, because the infrared beam measures a relatively thin layer (0.2–5 μm) of the sample that is in contact with the measuring surface of the ATR crystal. Thus, the sample beyond this layer will not be measured and will not affect the resulting spectrum. The use of this measuring mode means that samples can be measured directly without the need for microtoming or polishing. This vibrational spectroscopic approach, commonly referred to as ATR-FTIR spectroscopic imaging, has proven to be a powerful approach to study pharmaceutical systems.24–27 Moreover, this technology has shown to be a very versatile approach to detect the transformation of materials in situ and real time due to its highly chemically specific nature that lends itself to be particularly useful in aiding the design of novel formulations. The potential of ATR-FTIR spectroscopic imaging for the high-throughput study of many different formulations under identical conditions has previously been demonstrated.28–30 ATR-FTIR spectroscopic imaging was used to detect dimerization of a drug when formulated in different ratios with the excipient.31 In that study, 40 formulations were investigated simultaneously at a controlled humidity and temperature. Chan and Kazarian have also established the use of an expanded field of view accessory for macro ATR-FTIR spectroscopic imaging to investigate the simultaneous dissolution of different formulations in stagnant aqueous conditions.32
Here, for the first time, the simultaneous dissolution of multiple model micro-formulations of ibuprofen/polyethylene glycol (PEG) has been investigated. Furthermore, comparisons of the behaviour of the drug in different solutions under flow with a specific pH were studied by the development and design of microfluidic devices. The combination of ATR-FTIR spectroscopic imaging with microfluidic devices has also been reported, where spectroscopic images of flowing systems were recorded.33–35 The ability to measure these dynamic systems has provided the opportunity to study new physical changes related to drug release.
The behaviour of the drug after it has been released from a tablet is still relatively unexplored. Ionising drug molecules is a common method to increase the rate of dissolution from tablet dosage forms,36 however, this can result in areas where there are high concentrations of dissolved drug in the solution. Local areas of saturated and supersaturated concentrations of dissolved drug can result in precipitation and recrystallization from the solution and hence inhibit drug delivery.37–40 In this work, the behaviour of different concentration solutions of an ionised drug, sodium ibuprofen has been investigated upon contact with a solution with different pH values.
Previous work conducted using ATR-FTIR spectroscopic imaging for high-throughput and microfluidic studies of pharmaceutical formulations has provided much scope for the combined use of these approaches. This work presents novel applications for the use of microfluidic devices with macro ATR-FTIR spectroscopic imaging, specifically designed for the monitoring of pharmaceutical systems and formulations under flow. In this work, a combination of three exciting modern technologies—microfluidics, 3D printing (using a microdrop system for micro-samples preparation), and advanced chemical imaging—is introduced for the first time. This methodology may impact novel formulation design and analysis for pharmaceutics and biopharmaceutics. The key findings from this work are summarised in the following points:
-
(1)
Designed unique microfluidic devices fabricated from polydimethylsiloxane (PDMS) that are suitable for use with ATR-FTIR spectroscopic imaging and able to achieve flow of solutions through multiple channels.
-
(2)
Investigated the dissolution of several micro-formulations in different channels under continuous flow conditions and studied the behaviour of the micro-formulations in aqueous environments with different pH values under flow simultaneously.
-
(3)
Detected the crystallisation and precipitation of a drug that was dissolved in a neutral solution, upon contact and mixing with an acidic medium.
II. MATERIALS AND EXPERIMENTAL
A. Materials
Ibuprofen, sodium ibuprofen, and polyethylene glycol (PEG) (mw: 1000 g mol−1) were purchased from Sigma-Aldrich (UK) and used as received. Two different dissolution media were used in this investigation, a phosphate buffer (pH 7) and a 0.1 M Hydrochloric acid (HCl) solution (pH 1). For the preparation of the phosphate buffer, 0.1 M sodium hydroxide solution was added to 0.1 M potassium dihydrogen phosphate solution in a 0.8:1.0 ratio. The 0.1 M HCl solution was prepared by diluting 8.30 ml of 12 M HCl in 1 l of deionized water. All chemicals were products of Sigma-Aldrich (UK).
1. Preparation of the pharmaceutical micro-formulations
The micro-formulations investigated in this work were prepared using a microdroplet device (AutoDrop MicroDrop, Germany) which consists of a computer controlled dispensing unit. Ibuprofen and PEG were combined in the dispensing vessel and heated to 120 °C until both species had melted and mixed. Next, droplets of the formulation (∼0.06 mm diameter with a volume of 113 pl) were dispensed directly onto the zinc selenide (ZnSe) ATR-crystal in specified locations that allowed the channels of the microfluidic devices to be placed and attached to the ATR-crystal around the micro-formulations. Micro-formulations were prepared by dispensing the droplets in an arrangement so that a total diameter of ∼0.5 mm and a height of 0.06 mm, hence, this resulted in formulations with a total volume of approximately 12 nl.
2. Preparation of sodium ibuprofen solutions
Three different concentrations of sodium ibuprofen dissolved in a neutral solution were studied in this investigation, 200 mg/ml, 100 mg/ml, and 50 mg/ml. 2 g, 1 g, and 0.5 g of sodium ibuprofen were dissolved in 10 ml of phosphate buffer, respectively, and stirred at room temperature until the solid had dissolved. The solutions were stored in sealed vessels until use.
B. Fabrication of microfluidic devices
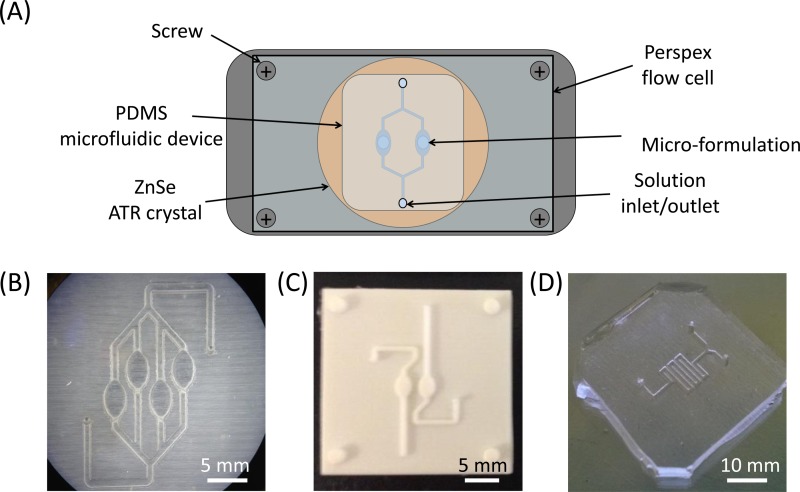
The microfluidic devices that were specifically designed to be used with ATR-FTIR spectroscopic imaging system were made from Slygard 184 polydimethylsiloxane (PDMS) (Dow Corning, USA). PDMS, which was made by mixing elastomer with crosslinking agent in a 10:1 weight ratio, was cast over a 3D printed acrylic mould (Shapeways, USA) and allowed to solidify in an oven at ∼40 °C. For the experiments, the PDMS microfluidic device was peeled from the mould and placed onto the measuring surface of the ATR-crystal. The microfluidic device was attached in place by alignment with a Perspex top-plate that was screwed into the accessory containing the ATR-crystal, as shown in Fig. 1. When using the microfluidic device designed for multiple dissolutions in four different channels, it proved challenging to obtain flow through all of these channels during the experiment due to the inherent hydrophobicity of PDMS. To prepare microfluidic devices where flow through all of the channels could be achieved poly(dimethylsiloxane-b-ethylene oxide polymeric) (Polysciences Inc, USA) was added to the PDMS elastomer (1% by weight) prior to mixing with crosslinking agent.41 Following this, the modified PDMS was cast over the mould and allowed to set under the same conditions as pure PDMS producing devices that were more hydrophilic in nature.
FIG. 1.
(a) Schematic of the experimental setup for the microfluidic devices for ATR-FTIR spectroscopic imaging measurements using a ZnSe ATR-crystal. The PDMS devices were attached to the measuring surface of the ATR-crystal and held in place using a Perspex flow cell top-plate. (b) PDMS microfluidic device with four channels. (c) The acrylic mould that was used to create the PDMS device capable of measuring two different flowing solutions simultaneously. (d) PDMS microfluidic channel with a T-Junction followed by serpentine channel.
The design and fabrication of microfluidic chips using 3D printed acrylic moulds were particularly useful for this study as it allowed rapid modification and high flexibility of the devices that could be studied using ATR-FTIR spectroscopic imaging. Thus, it meant that unique microfluidic devices for the specific applications could be produced quickly and inexpensively. All of the microfluidic devices presented in work were designed to be used with commercially available ATR-FTIR spectroscopic imaging accessories where the whole device could be analysed during the experiment by placing onto the measuring surface of a ZnSe ATR-crystal. Fig. 1(b) shows a visible image of a microfluidic device with four channels and dissolution chambers. The dissolution chambers in the device were offset to allow all of the chambers to be imaged in a single experiment. The width of the channels in these devices is 0.5 mm, and the oval shaped dissolution chamber is 2 mm × 3 mm in size. This allowed the micro-formulations described above to fit the device. The T-junction device shown in Fig. 1(d) was used for investigation of a dissolved drug mixing with a different pH medium where the width and height of the channels are 0.5 mm. The design of the serpentine channel after the T-junction was selected for use in the device since it fully utilised the measuring area surface of the ATR crystal and allowed the maximum length of the channel to measured in a single experiment. Both devices were compatible with the same Perspex top-plate that was custom built. The tubing was connected to the top plate and a syringe pump (Harvard Apparatus, USA) allowing the flow rates of the media to be controlled.
C. ATR-FTIR spectroscopy and spectroscopic imaging
An Alpha FTIR spectrometer (Bruker, Germany) with a single element detector was used to measure the infrared spectra of the individual components for preliminary assessment in this investigation. ATR sampling mode utilising a diamond ATR-crystal was used to record the mid-infrared range across 4000–600 cm−1 with a spectral resolution of 8 cm−1 and 64 co-added scans.
The ATR-FTIR spectroscopic imaging approach used a ZnSe ATR-crystal with a variable angle accessory (Pike, USA). This ATR-FTIR accessory was placed in the macrochamber (IMAC) which is specifically designed for spectroscopic imaging applications. The macrochamber was fitted to an Equinox 55 FTIR spectrometer (Bruker, Germany) and a focal plane array (FPA) detector to record spectroscopic images in the mid-infrared region between 4000 and 900 cm−1. OPUS software was used to record the spectral data at a resolution of 8 cm−1 and 16 co-added scans. The size of the FPA detector aligned for use with the ZnSe ATR-crystal in pixels was both 128 × 128 and 96 × 96 pixels dependent upon the microfluidic device used, and resulted in an image size of ∼11.5 × 8 mm2 and ∼7.75 × 6 mm2, respectively.
The spatial distribution of the different chemical species can be determined in the recorded data by plotting the absorbance of specific spectral bands as a function of all pixels of the measured area. The red regions in the spectroscopic images relate to high absorbance of the species, whereas the blue areas relate to the low absorbance of the material within the measured area. Unique absorption bands for each of the species of interest were selected by careful analysis of the pure component spectra, ensuring that the spectral bands did not overlap. The spectral regions that were used for the bands to generate the spectroscopic images in this paper are the following: ibuprofen (1790–1695 cm−1), PEG (1160–1045 cm−1), and aqueous media (3600–3000 cm−1) for the micro-formulations. These regions correspond to the strongest spectral bands for each of these three substances. Moreover, sodium ibuprofen (1580−1525 cm−1), crystalline ibuprofen (1735–1680 cm−1), and the aqueous medium (3600–3000 cm−1) were selected for the results describing the behaviour of the drug after release. It should be realised that the ATR-FTIR spectroscopic images representing the different species in the figures presented in this manuscript can be compared directly, even from different experiments, since the same integration range and upper and lower limits for the colour scale were used to generate the images recorded.
III. RESULTS AND DISCUSSION
A. Dissolution of micro-formulations
Designing microfluidic devices where multiple dissolution experiments can be investigated simultaneously provides the opportunity to explore high-throughput screening in situ. This work presents specifically designed microfluidic devices that can be studied using macro-ATR-FTIR spectroscopic imaging to reveal important information about the behaviour of drug release. The reliability and robustness of ATR-FTIR spectroscopic imaging for the study of pharmaceutical tablets and formulations have been well established in recent years,24,42,43 but this is the first time that micro-formulations have been studied in flowing channels.
1. High-throughput screening of micro-formulations under the same flowing conditions
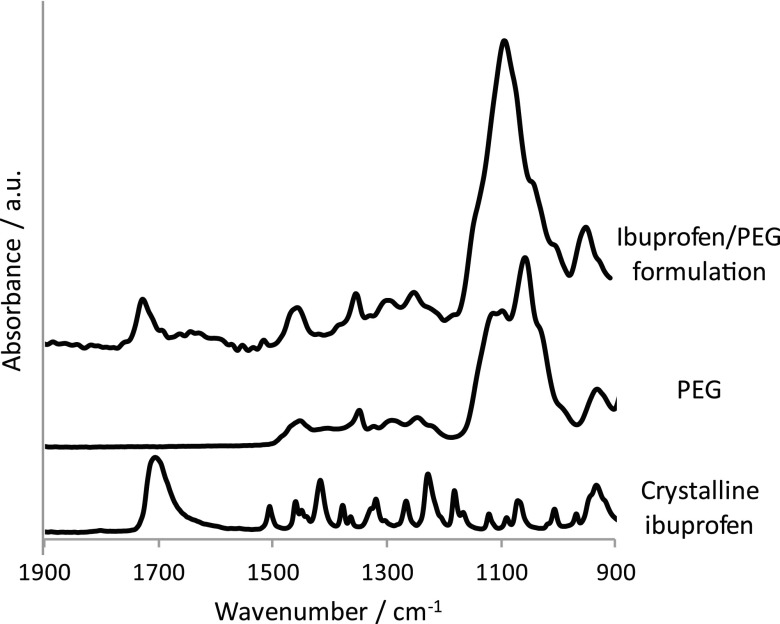
Micro-formulations containing a model drug, ibuprofen, and excipient, PEG (mw: 1000 g mol−1), were prepared and dispensed using a microdrop system (Autodrop, Germany). The microdrop system operates by melting the materials together in a vessel and dispensing droplets with a diameter of ∼60 μm at specific locations directly onto the surface of the ZnSe ATR-crystal. Preparation of the formulations using this hot melt approach meant that molecularly dispersed ibuprofen was obtained in the formulated mixture and thus the stability of this form could be investigated during the experiments. The proof of the molecularly dispersed form of ibuprofen is evident in the ATR-FTIR spectra shown in Fig. 2. Fig. 2 presents the ATR-FTIR spectrum of crystalline ibuprofen, PEG, and the ibuprofen/PEG formulation (1:3 weight ratio). The appearance of ibuprofen in the molecularly dispersed form is confirmed in the ATR-FTIR spectrum of the formulation by the shift of the ν(C=O) absorption band from 1704 cm−1 (powdered form of ibuprofen) to 1730 cm−1 (when in the formulation). It has been reported in previous studies with ATR-FTIR spectroscopic imaging that structural changes from molecularly dispersed to crystalline form of ibuprofen can be characterised during release experiments and thus this is a suitable and reliable model system to demonstrate potential of determining the behaviour of drugs using novel microfluidic approaches.40
FIG. 2.
ATR-FTIR spectra of the ibuprofen/PEG (1:3 weight ratio) formulation, PEG (mw: 1000 g mol−1), and crystalline ibuprofen.
The microfluidic devices were designed such that the full area of the FPA detector was utilised for their analysis using ATR-FTIR spectroscopic imaging. Hence, 128 × 128 pixels were measured by placing the devices directly onto the measuring surface of ZnSe ATR-crystal in a commercial ATR-FTIR accessory (PIKE Technology). The size of the obtained spectroscopic images using this setup was approximately 11.5 × 8 mm2 with a spatial resolution of ∼150 μm. The spectroscopic images in Fig. 3 demonstrate that it is possible to study four different channels simultaneously using the current design. However, it is feasible that further iterations can provide the opportunity to study more channels within this imaging field of view. It should be realised that the slight increase in noise in the spectroscopic images arises due to the fact that it was only possible to record one background spectrum at the start of the experiment.
FIG. 3.
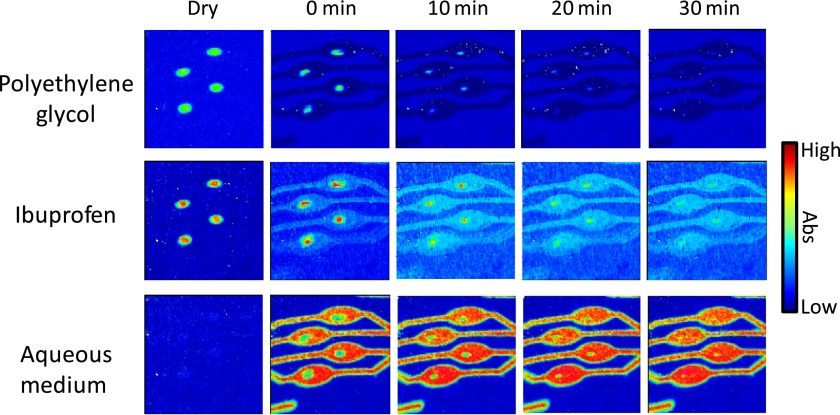
ATR-FTIR spectroscopic images showing the simultaneous dissolution of four ibuprofen/PEG (1:3 weight ratio) formulations in neutral solution. The spatial distribution of PEG (top row), ibuprofen (middle row), and the aqueous solution (bottom row) have been presented. The dimensions of the images are ∼11.5 × 8 mm2.
In these experiments, the dissolution of ibuprofen/PEG micro-formulations (1:3 weight ratio) in a solution of pH 7 was studied. The spectroscopic images presented in Fig. 3 show the spatial distribution of ibuprofen, PEG, and the aqueous medium during the experiment. One of the significant advantages of using the microfluidic devices is realised in these experiments as all four micro-formulations in the channels dissolve at the same rate. Thus, in a single experiment using this setup, it is possible to screen multiple formulations effectively in high-throughput at the same time. Furthermore, complete release of ibuprofen in the pH 7 aqueous medium is observed after 20 min, and at a similar rate to the PEG excipient. The spectroscopic images show that this is coincident with the ingress of the aqueous medium towards the core of the formulations. As a result, and as one may expect, the rate of ibuprofen drug release can be increased when it is in the molecularly dispersed form. Such results can have implications for the development of new delivery systems, for example, the design of micro-formulations or particles within capsules as an alternative method to solid tablet compacts.
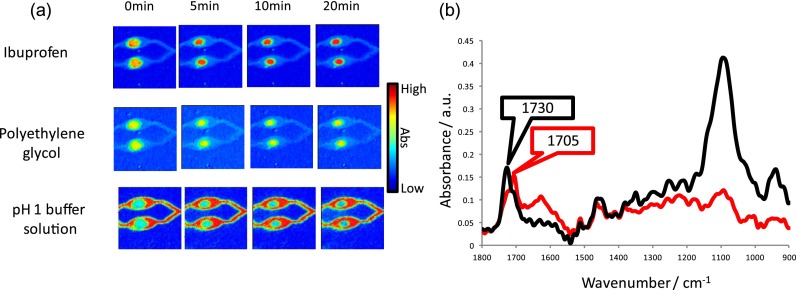
Fig. 4 shows the result of the same ibuprofen/PEG formulation as described above, but instead in the presence of an acidic pH 1 HCl solution. In this experiment, interesting observations relating to the behaviour of the formulation in the acidic solution under flow were identified. The ATR-FTIR spectroscopic images confirm that there is little dissolution of both the ibuprofen and the PEG from these micro-formulations during the experiment. The images recorded at 20 min show that there is still the presence of both the drug and excipient, and more interestingly, the solution has not penetrated into the tablet matrix after this time. In contrast, complete release and dissolution of the materials were observed after this period for such micro-formulations in a neutral solution.
FIG. 4.
(a) ATR-FTIR spectroscopic images showing the simultaneous dissolution of two ibuprofen/PEG formulations in acidic medium. The spatial distribution of, ibuprofen (top row) PEG (middle row), and the aqueous solution (bottom row) have been presented. The dimensions of the images are ∼11.5 × 8 mm2. (b) Extracted ATR-FTIR spectra taken from the centre of the formulation at 0 min (black) and 20 min (red), where the appearance of the peak characteristic of the crystalline form is highlighted by the red label.
The reasons for the differences in the drug release behaviour can be revealed in the ATR-FTIR spectra that have been extracted from the formulations and are shown in Fig. 4(b). The ibuprofen in the formulations prior in introducing the acidic solution is characterised to be in the molecularly dispersed form. As the experiment progressed, there is a shift in the ν(C=O) absorption band at 1730 cm−1 to a lower wavenumber at 1705 cm−1. This is evidence of conversion back to the crystalline form induced upon contact with the acidic medium that dissolves more slowly than the molecularly dispersed form. In addition to slower drug release, it also appears that formation of the crystalline form also inhibits ingress of the solution into the micro-formulation that could be a reason for the reduced rate of dissolution of both the ibuprofen and PEG. Therefore, it is possible to determine structural changes during the in situ experiment under flow in addition to spatial information about the different species. Due to the high-throughput nature of these investigations, the reliability of these results can be compared in a single experiment meaning that rapid screening of multiple samples is possible.
2. Simultaneous screening of multiple formulations under flowing conditions in different pH environments
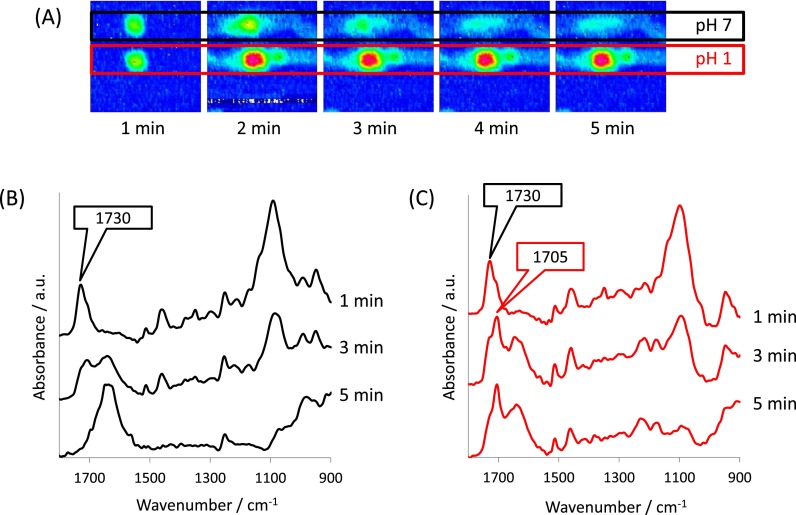
In addition to the microfluidic devices designed to study high-throughput dissolution behaviour of multiple micro-formulations, it has also been demonstrated that devices, which can study the same formulations but under different flowing conditions, can be produced. These microfluidic chips have multiple inlets and outlets and as shown in Fig. 5, a device with two channels was studied capable of flowing two different media at the same time. Here, dissolution of the ibuprofen/PEG formulation in both the neutral and acidic solutions, described above, has been screened simultaneously. The spectroscopic images and extracted spectra show that there are obvious differences between the behaviour of the micro-formulation in the different aqueous media. Similarly, to the structural changes characterised in Fig. 4, the appearance of the crystalline form of ibuprofen is observed in the acidic medium that inhibits the release of the drug and dissolution of the formulation. On the other hand, in the neutral medium no changes in structural form were observed, and subsequently, the drug was readily released into the surrounding solution.
FIG. 5.
(a) ATR-FTIR spectroscopic images showing the behaviour of ibuprofen during the simultaneous dissolution of two ibuprofen/PEG formulations (1:3 weight ratio) in different pH media. The size of the spectroscopic images is ∼7.75 × 6 mm2. Any structural changes of ibuprofen in the different media during the experiment were shown in the ATR-FTIR spectra by the red label that were extracted from the centre of the tablet in the pH 7 (b) and pH 1 (c) solution.
One advantage of studying micro-formulations in microfluidic devices with two channels is that the sampling area of interest is smaller, hence, a smaller pixel array of the FPA detector can be used. While this does mean that reduced dimensions of the spectroscopic images are obtained, it does allow faster measurements to be recorded using the same number of co-added scans (32 scans) and spectral resolution (8 cm−1). Fig. 5 shows the results from the two channels devices where a 96 × 96-pixel array was measured which allowed a slightly reduced imaged area (7.75 × 6 mm2) to be recorded. As a result of the faster measurement time, it was possible to record images in ca. 1 min and hence the data obtained from the first 5 min after introducing the different solutions have been presented. The spectroscopic images in Fig. 5 and corresponding spectra in Fig. 5(c) determine that changes in the structural form of ibuprofen are apparent in the images immediately upon contact with the acidic medium. In contrast, dissolution of the micro-formulation in the neutral medium is fast, and the ibuprofen appears to be near complete release after 5 min during these experiments as shown by spectra in Fig. 5(b). These results demonstrate the possibility of applying ATR-FTIR spectroscopic imaging to determine the behaviour of multiple formulations effectively in different conditions at the same time.
Miniaturisation of formulations, for example, those studied in this work, could prove to be very useful for the screening newly developed delivery systems. Furthermore, the use of ATR-FTIR spectroscopic imaging is a powerful approach to reveal the inherent chemical specificity and allows one to detect changes in the structural from (e.g., from molecularly dispersed to crystalline) in real-time. In these experiments, four micro-formulations have been investigated simultaneously under the same aqueous conditions under flow. However, it is conceivable that further modifications can be made to the devices whereby more channels can be studied by reducing the width of the channels and formulation size. As a result, the combination of ATR-FTIR spectroscopic imaging with microfluidic devices, as presented here, is a highly flexible approach to study a range of formulations depending upon the problem of interest. The devices that have been shown in this work were used in high-throughput applications, where the behaviour of several of the same ibuprofen/PEG formulations was monitored at the same time, thus avoiding the need for many repeat experiments. This approach may be particularly advantageous for rapid screening of large numbers of samples or where the amount of sample is limited.
B. Crystallisation of drug under flow
The investigation into the recrystallization of a model active pharmaceutical ingredient, sodium ibuprofen, which was dissolved in a neutral solution and mixed with an acidic medium, has been studied. The motivation of such a study stems from the drive to improve the dissolution rates of drugs from tablet compacts in the field of pharmaceutical research, for example, the ionisation of drug candidates.36,42 However, the behaviour of these drugs after they have been released from the tablet matrix and dissolved into the surrounding solution is actually of great importance. Subsequent effects such as localised areas of saturation and supersaturation can initiate recrystallization of the drug even after it has dissolved from the tablet.
In this study, a microfluidic device was designed to include two inlets that meet at a T-Junction followed by a serpentine channel to monitor the behaviour of a dissolved drug (Fig. 6). This microfluidic device was attached to the measuring surface of the ZnSe ATR-crystal, and the width and height of the channels were 0.5 mm and 1.5 mm, respectively. For these experiments, two different aqueous samples were injected into the different inlets at a controlled 10 μl/min flow rate at the same time where they mixed at the T-junction. Fig. 6 presents the results of a 200 mg/ml solution of sodium ibuprofen dissolved in a neutral solution mixing with an acidic solution (pH 1, 0.1 M HCl acid). Previously, the effects of local areas of saturation outside of the tablet have been detected using ATR-FTIR spectroscopic imaging and shown to result in recrystallization of the drug just outside of the tablet matrix.38
FIG. 6.
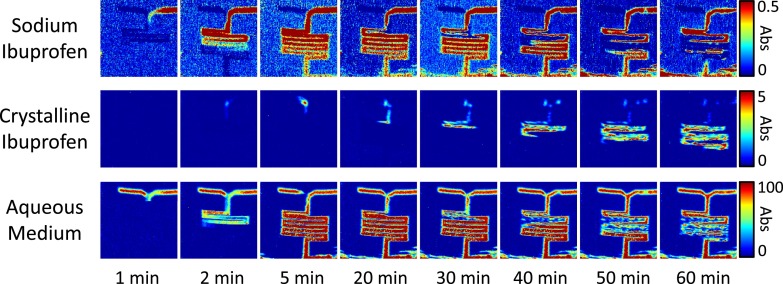
ATR-FTIR spectroscopic images showing the precipitation of crystalline ibuprofen crystals upon contact and mixing of a sodium ibuprofen solution (2 mg/ml) with a pH 1 solution. The spatial distribution of sodium ibuprofen (top row), crystalline ibuprofen (middle row), and aqueous solution (bottom row) are presented. The size of each image is ∼11.5 × 8 mm2.
The spectroscopic images in Fig. 6 are generated by plotting the absorbance of characteristic absorption bands for the different components as a function of the measured area (11.5 mm × 8 mm) and reveal the spatial distribution of sodium ibuprofen, crystalline ibuprofen, and aqueous media, respectively. In the spectroscopic images, it is possible to characterise and determine the spatial distribution of the conversion of ibuprofen from the ionised structure to the solid crystalline form. This began to initiate after 2 min and as the experiment progressed the extent of this conversion continued. This is highlighted in the spectroscopic images by the increasing relative absorbance of the crystalline ibuprofen in the channel during the experiment. Conversely, at the same time, the concentration of the sodium ibuprofen decreases as a result of the changing structural form.
Furthermore, the ATR-FTIR spectroscopic images of all components present allow conclusions about the behaviour of the materials within the channels to be determined. The ATR-FTIR images representing the distribution of the aqueous solution show that as crystalline ibuprofen was formed it was displaced from the surface of the ATR-crystal. This is an example where ATR-FTIR imaging can be a particularly valuable tool for pharmaceutical research as it measures the first few micrometres in contact with the ATR-crystal. Significantly, it is widely reported that anti-inflammatory drugs, such as ibuprofen, can have problematic effect in the digestive system when there is a build-up of crystalline material on the lining of the gastrointestinal tract. Here, we present evidence that the formation of crystalline ibuprofen can result in the drug settling upon the lower surface in the channel even under flowing conditions.
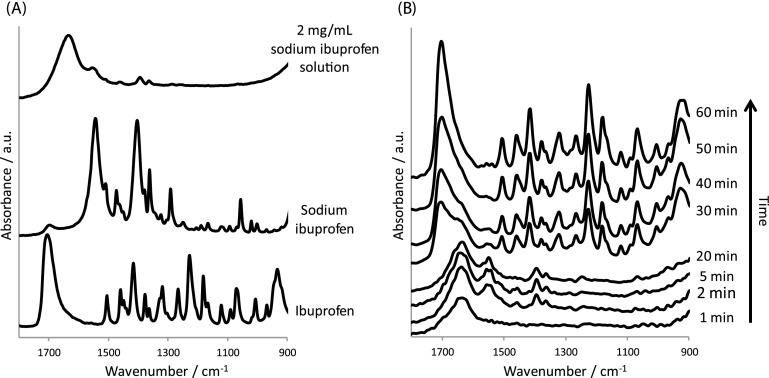
The fast dynamic measurements in these experiments demonstrate that there is the appearance of a higher concentration of crystalline ibuprofen as the experiment progressed as a function of time. The appearance of the crystalline ibuprofen appears initially at the mixing interface of the two solutions, however, during the experiment, the agglomeration of the crystalline ibuprofen is observed further downstream. This observation is proposed to be a result of the flow of the solution throughout the channels which causes movement of the precipitates before they are observed on the measured surface of the ATR crystal. Also, the ability to monitor the behaviour and characterise different phases present in the channels in real-time has been demonstrated in these experiments by extraction of ATR-FTIR spectra shown in Fig. 7. The formation of crystalline ibuprofen in a solid state from an aqueous solution is detected and spatially resolved in the ATR-FTIR spectroscopic images. The high sensitivity and chemical specificity of ATR-FTIR imaging mean that it was possible to detect the presence of the sodium ibuprofen dissolved in solution. The extracted spectrum is shown in Fig. 7. Additionally, it is possible to monitor specific pixels from the FPA detector in the different time-resolved images. Fig. 7 shows the changes in the extracted spectra taken from a bend in the channel as the experiment progressed.
FIG. 7.
(a) ATR-FTIR spectra recorded for the pure 2 mg/ml sodium ibuprofen solution, sodium ibuprofen, and crystalline ibuprofen. (b) Extracted spectra from the 2 mg/ml sodium ibuprofen solution experiment. The spectra were extracted from a bend in the serpentine channel as the experiment proceeded.
The ATR-FTIR spectra from these specific pixels display obvious changes such as the increase in the absorbance of the spectral bands associated with crystalline ibuprofen. Unique absorbance bands, for example, those with the peak at 1705, 1320 and 1230 cm−1 increase during the experiment. In contrast, the images that are associated with the sodium ibuprofen solution, specifically the bands with the peaks at 1542, 1397, and 1365 cm−1, consequently decrease in absorbance. Complementary information about the aqueous medium can also be revealed in the spectroscopic images. This is highlighted by the decrease and then the absence of the band associated with the bending band of water at 1635 cm−1. The disappearance of this spectral band is the evidence of the solution being displaced from the surface of the ATR-crystal, which is also seen in the spectroscopic images in Fig. 6. The extracted spectra presented in Fig. 7 reveal chemically specific information about the systems while the spectroscopic images reveal the spatial distribution of these species. Hence, a wealth of information can be gained from such experiments where not only can structural changes be characterised but also the extent of conversion and the behaviour of the materials under flow can be assessed.
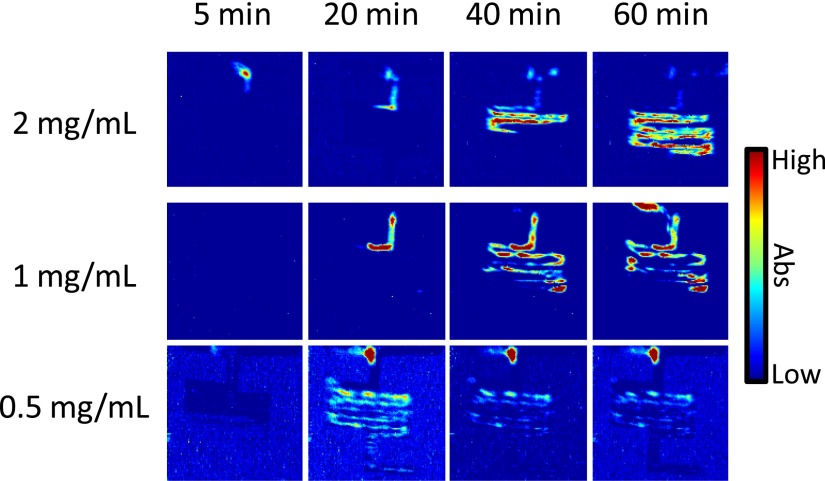
Fig. 8 presents the distribution of crystalline ibuprofen as a function of time for experiments where different concentrations of sodium ibuprofen were dissolved in solution and studied under the same conditions as presented above in this section. Here, it can be seen that the relative amount of crystalline ibuprofen that was formed during the experiment is dependent upon the initial concentration. Nevertheless, there is the presence of crystalline ibuprofen in all of the experiments. In general, the trend relating to the formation of the solid crystalline ibuprofen is that the higher the concentration of the sodium ibuprofen solution, the higher the extent of crystallisation. The ATR-FTIR spectroscopic images recorded for the 200 mg/ml sodium ibuprofen solution show that crystalline ibuprofen is present within the entire serpentine channel at around 60 min. Whereas, the 100 mg/ml sodium ibuprofen solutions show that crystalline ibuprofen was formed but to a lesser degree. In this set of images (middle row Fig. 8), there tends to be an aggregation of the crystalline ibuprofen at predominantly the bends in the channel. Finally, the results from the 50 mg/ml sodium ibuprofen solution demonstrate the lowest amount of crystalline ibuprofen formation, which is as one may expect. Importantly, however, there is characterisation and detection of this phase separation at the T-junction in the device. In the earlier images recorded for this set of experiments (bottom row Fig. 8), such as the spectroscopic image representing 20 min, crystalline ibuprofen is present in very low concentrations throughout the device. Interestingly, agglomeration of the particles is not seen to occur. One possible explanation is that the flowing solution could carry the particles through the channels but since the relative concentration of crystalline ibuprofen is low, there is no accumulation of these within the channel.
FIG. 8.
ATR-FTIR spectroscopic images showing the precipitation of crystalline ibuprofen crystals from sodium ibuprofen solutions with different concentrations upon mixing with a pH 1 solution. The spatial distribution of crystalline ibuprofen is shown in the 2 mg/ml (top row), 1 mg/ml (middle row), and 0.5 mg/ml (bottom row) experiments. The size of each image is ∼11.5 × 8 mm2.
These results have shown that the behaviour of a dissolved drug in solutions with a different concentration can be effectively studied. Not only the recrystallisation of drug from the solutions can be characterised and spatially resolved using ATR-FTIR spectroscopic imaging but also the extent of crystallisation from different solutions can be assessed. Comparisons from different experiments can prove very powerful for when information about the behaviour of drug solutions are of interest. Similarly to the dissolution of micro-formulations, it is feasible that novel devices can be created to study these systems using high-throughput analysis. This provides an opportunity to utilise this approach as a platform to determine specific concentrations where crystallisation can occur and a wide range of experiments can be designed to investigate such systems thoroughly.
IV. CONCLUSIONS
Microfluidic devices specifically designed for use with ATR-FTIR spectroscopic imaging have been developed, and their ability to study the behaviour of model drugs has been reported. First, multiple micro-formulations under flow were investigated, and the effect of different aqueous solutions on the dissolution of the formulations was explored in a high-throughput manner using spectroscopic imaging combined with microfluidics for the first time. It was seen that the acidic medium inhibited release of ibuprofen as a result of conversion from the molecularly dispersed from to crystalline ibuprofen. These structural changes were characterised in the extracted ATR-FTIR spectra. Furthermore, microfluidic devices that allowed micro-formulations to be exposed to different aqueous conditions simultaneously were investigated and had been shown as an effective approach to screen multiple micro-formulations in a single experiment.
This work also highlights the importance of studying the behaviour of the drug after it had been released, i.e., recrystallization of the drug from solution. It was detected that ibuprofen recrystallize from a sodium ibuprofen solution upon contact and mixing with an acidic medium. A unique microfluidic device with a T-junction and serpentine channel arrangement allowed the field of view of the imaging system to be utilised. These results have shown a clear phase transition from sodium ibuprofen that was dissolved in a neutral solution converting to solid crystalline ibuprofen. Proof of this was determined by analysis of the ATR-FTIR spectroscopic imaging data. This provided further scope to explore the extent of crystallisation from different solutions of dissolved drug under flow. The behaviour of the solid particles was determined where accumulation, as the subsequent build-up of the precipitation, was spatially resolved.
The combined approach of using ATR-FTIR spectroscopic imaging with microfluidic devices could prove to be a very useful high-throughput analytical method to analyse drug release and the behaviour of the material in situ under flowing conditions. Further development of this approach can potentially establish this experimental setup as a reliable and robust method for studying a wide range of formulations and solutions in the future.
ACKNOWLEDGMENTS
The authors would like to acknowledge Dr. James Kimber for help with the design of the 3D printed microfluidic moulds and Yasuhiro Iwasawa for assistance with some of the experimental work conducted in this investigation.
References
- 1. Shah S. M., Jain A. S., Kaushik R., Nagarsenker M. S., and Nerurkar M. J., AAPS Pharmscitech 15, 1307 (2014). 10.1208/s12249-014-0156-1 [DOI] [PMC free article] [PubMed] [Google Scholar]
- 2. Williams H. D., Trevaskis N. L., Charman S. A., Shanker R. M., Charman W. N., Pouton C. W., and Porter C. J. H., Pharmacol. Rev. 65, 315 (2013). 10.1124/pr.112.005660 [DOI] [PubMed] [Google Scholar]
- 3. van Hoogevest P., Liu X., and Fahr A., Expert Opin. Drug Delivery 8, 1481 (2011). 10.1517/17425247.2011.614228 [DOI] [PubMed] [Google Scholar]
- 4. Dai W.-G., Pollock-Dove C., Dong L. C., and Li S., Adv. Drug Delivery Rev. 60, 657 (2008). 10.1016/j.addr.2007.10.017 [DOI] [PubMed] [Google Scholar]
- 5. Dai W. G., Int. J. Pharm. 393, 1 (2010). 10.1016/j.ijpharm.2010.03.040 [DOI] [PubMed] [Google Scholar]
- 6. Stadler B., Biomicrofluidics 9, 52501 (2015). 10.1063/1.4931070 [DOI] [PMC free article] [PubMed] [Google Scholar]
- 7. Kang L., Chung B. G., Langer R., and Khademhosseini A., Drug Discovery Today 13, 1 (2008). 10.1016/j.drudis.2007.10.003 [DOI] [PMC free article] [PubMed] [Google Scholar]
- 8. Gardner C. R., Almarsson O., Chen H., Morissette S., Peterson M., Zhang Z., Wang S., Lemmo A., Gonzalez-Zugasti J., and Monagle J., Comput. Chem. Eng. 28, 943 (2004). 10.1016/j.compchemeng.2003.09.028 [DOI] [Google Scholar]
- 9. Kuentz M., J. Pharm. Pharmacol. 67, 143 (2015). 10.1111/jphp.12271 [DOI] [PubMed] [Google Scholar]
- 10. Ding Y. Z., Li J. N., Xiao W. W., Xiao K., Lee J., Bhardwaj U., Zhu Z. J., Digiglio P., Yang G. M., Lam K. S., and Pan T. R., Anal. Chem. 87, 10166 (2015). 10.1021/acs.analchem.5b00826 [DOI] [PubMed] [Google Scholar]
- 11. Piletska E. V., Abd B. H., Krakowiak A. S., Parmar A., Pink D. L., Wall K. S., Wharton L., Moczko E., Whitcombe M. J., Karim K., and Piletsky S. A., Analyst 140, 3113 (2015). 10.1039/C4AN02292K [DOI] [PubMed] [Google Scholar]
- 12. Heikkila T., Peltonen L., Taskinen S., Laaksonen T., and Hiryonen J., Lett. Drug Des. Discovery 5, 471 (2008). 10.2174/157018008785909840 [DOI] [Google Scholar]
- 13. Cheng W. C., He Y., Chang A. Y., and Que L., Biomicrofluidics 7, 064102 (2013). 10.1063/1.4829776 [DOI] [PMC free article] [PubMed] [Google Scholar]
- 14. Genina N., Holländer J., Jukarainen H., Mäkilä E., Salonen J., and Sandler N., “ Ethylene vinyl acetate (EVA) as a new drug carrier for 3D printed medical drug delivery devices,” Eur. J. Pharm. Sci. (in press). [DOI] [PubMed]
- 15. Tsinman K., Avdeef A., Tsinman O., and Voloboy D., Pharm. Res. 26, 2093 (2009). 10.1007/s11095-009-9921-3 [DOI] [PubMed] [Google Scholar]
- 16. Fagerberg J. H., Tsinman O., Sun N., Tsinman K., Avdeef A., and Bergström C. A., Mol. Pharm. 7, 1419 (2010). 10.1021/mp100049m [DOI] [PubMed] [Google Scholar]
- 17. Avdeef A., Tsinman K., Tsinman O., Sun N., and Voloboy D., Chem. Biodiversity 6, 1796 (2009). 10.1002/cbdv.200900082 [DOI] [PubMed] [Google Scholar]
- 18. Windbergs M. and Weitz D. A., Small 7, 3011 (2011). 10.1002/smll.201100520 [DOI] [PubMed] [Google Scholar]
- 19. Hsu M. N., Luo R., Kwek K. Z., Por Y. C., Zhang Y., and Chen C.-H., Biomicrofluidics 9, 052601 (2015). 10.1063/1.4916230 [DOI] [PMC free article] [PubMed] [Google Scholar]
- 20. Østergaard J., Ye F., Rantanen J., Yaghmur A., Larsen S. W., Larsen C., and Jensen H., J. Pharm. Sci. 100, 3405 (2011). 10.1002/jps.22532 [DOI] [PubMed] [Google Scholar]
- 21. Hulse W. L., Gray J., and Forbes R. T., Int. J. Pharm. 434, 133 (2012). 10.1016/j.ijpharm.2012.05.023 [DOI] [PubMed] [Google Scholar]
- 22. Østergaard J., Meng-Lund E., Larsen S. W., Larsen C., Petersson K., Lenke J., and Jensen H., Pharm. Res. 27, 2614 (2010). 10.1007/s11095-010-0257-9 [DOI] [PubMed] [Google Scholar]
- 23. Qiao N., Wang K., Schlindwein W., Davies A., and Li M., Eur. J. Pharm. Biopharm. 83, 415 (2013). 10.1016/j.ejpb.2012.10.005 [DOI] [PubMed] [Google Scholar]
- 24. Kazarian S. G. and Ewing A. V., Expert Opin. Drug Delivery 10, 1207 (2013). 10.1517/17425247.2013.801452 [DOI] [PubMed] [Google Scholar]
- 25. Kazarian S. G. and van der Weerd J., Pharm. Res. 25, 853 (2008). 10.1007/s11095-007-9375-4 [DOI] [PubMed] [Google Scholar]
- 26. van der Weerd J. and Kazarian S. G., J. Pharm. Sci. 94, 2096 (2005). 10.1002/jps.20428 [DOI] [PubMed] [Google Scholar]
- 27. Chan K. L. A. and Kazarian S. G., Mol. Pharm. 1, 331 (2004). 10.1021/mp049973m [DOI] [PubMed] [Google Scholar]
- 28. Kazarian S. G., Anal. Bioanal. Chem. 388, 529 (2007). 10.1007/s00216-007-1193-3 [DOI] [PubMed] [Google Scholar]
- 29. Chan K. L. A. and Kazarian S. G., J. Comb. Chem. 7, 185 (2005). 10.1021/cc049840q [DOI] [PubMed] [Google Scholar]
- 30. Chan K. L. A., Kazarian S. G., Vassou D., Gionis V., and Chryssikos G. D., Vib. Spectrosc. 43, 221 (2007). 10.1016/j.vibspec.2006.07.015 [DOI] [Google Scholar]
- 31. Chan K. L. A. and Kazarian S. G., J. Comb. Chem. 8, 26 (2006). 10.1021/cc050041x [DOI] [PubMed] [Google Scholar]
- 32. Chan K. L. A. and Kazarian S. G., Lab Chip 6, 864 (2006). 10.1039/b516271h [DOI] [PubMed] [Google Scholar]
- 33. Chan K. L. A. and Kazarian S. G., Spectroscopy 27(10), 22 (2012). [Google Scholar]
- 34. Chan K. L. A., Niu X., deMello A. J., and Kazarian S. G., Anal. Chem. 83, 3606 (2011). 10.1021/ac200497a [DOI] [PubMed] [Google Scholar]
- 35. Chan K. L. A., Gulati S., Edel J. B., de Mello A. J., and Kazarian S. G., Lab Chip 9, 2909 (2009). 10.1039/b909573j [DOI] [PubMed] [Google Scholar]
- 36. Serajuddin A. T. M., Adv. Drug Delivery Rev. 59, 603 (2007). 10.1016/j.addr.2007.05.010 [DOI] [PubMed] [Google Scholar]
- 37. Leuner C. and Dressman J., Eur. J. Pharm. Biopharm. 50, 47 (2000). 10.1016/S0939-6411(00)00076-X [DOI] [PubMed] [Google Scholar]
- 38. Punčochová K., Ewing A. V., Gajdošová M., Sarvašová N., Kazarian S. G., Beránek J., and Štěpánek F., Int. J. Pharm. 483, 256 (2015). 10.1016/j.ijpharm.2015.02.035 [DOI] [PubMed] [Google Scholar]
- 39. Chandran S., Gesenberg C., Levons J., Hubert M., and Raghavan K., J. Pharm. Biomed. Anal. 56, 698 (2011). 10.1016/j.jpba.2011.07.009 [DOI] [PubMed] [Google Scholar]
- 40. Kazarian S. G. and Chan K. L. A., Macromolecules 36, 9866 (2003). 10.1021/ma035210l [DOI] [Google Scholar]
- 41. Yao M. and Fang J., J. Micromech. Microeng. 22, 25012 (2012). 10.1088/0960-1317/22/2/025012 [DOI] [Google Scholar]
- 42. Ewing A. V., Wray P. S., Clarke G. S., and Kazarian S. G., J. Pharm. Biomed. Anal. 111, 248 (2015). 10.1016/j.jpba.2015.03.040 [DOI] [PubMed] [Google Scholar]
- 43. Ewing A. V., Biggart G. D., Hale C. R., Clarke G. S., and Kazarian S. G., Int. J. Pharm. 495, 112 (2015). 10.1016/j.ijpharm.2015.08.068 [DOI] [PubMed] [Google Scholar]


