

Abstract
Background: Intake of polyphenols and polyphenol-rich fruit extracts has been shown to reduce markers of inflammation, diabetes, and hepatic complications that result from the consumption of a high-fat (HF) diet.
Objective: The objective of this study was to determine whether mice fed polyphenol-rich apple peel extract (AE), cherry extract (CE), and quercetin, a phytochemical abundant in fruits including apples and cherries, would modulate the harmful effects of adiposity on blood glucose regulation, endocrine concentrations, and hepatic metabolism in HF-fed C57BL/6J male mice.
Methods: Groups of 8-wk-old mice (n = 8 each) were fed 5 diets for 10 wk, including low-fat (LF; 10% of total energy) and HF (60% of total energy) control diets and 3 HF diets containing polyphenol-rich AE, CE, and quercetin (0.2% wt:wt). Also, an in vitro study used HepG2 cells exposed to quercetin (0–100 μmol/L) to determine whether intracellular lipid accumulation could be modulated by this phytochemical.
Results: Mice fed the HF control diet consumed 36% more energy, gained 14 g more body weight, and had ∼50% elevated blood glucose concentrations (all P < 0.05) than did LF-fed mice. Mice fed HF diets containing AE, CE, or quercetin became as obese as HF-fed mice, but had significantly lower blood glucose concentrations after food deprivation (−36%, −22%, −22%, respectively; P < 0.05). Concentrations of serum C-reactive protein were reduced 29% in quercetin-fed mice compared with HF-fed controls (P < 0.05). A qualitative evaluation of liver tissue sections suggested that fruit phytochemicals may reduce hepatic lipid accumulation. A quantitative analysis of lipid accumulation in HepG2 cells demonstrated a dose-dependent decrease in lipid content in cells treated with 0–100 μmol quercetin/L (P < 0.05).
Conclusions: In mice, consumption of AE, CE, or quercetin appears to modulate some of the harmful effects associated with the consumption of an obesogenic HF diet. Furthermore, in a cell culture model, quercetin was shown to reduce intracellular lipid accumulation in a dose-dependent fashion.
Keywords: apples, cherries, C57BL/6J mice, high-fat diet, phytochemicals, polyphenols, PPAR-α, quercetin
Introduction
As of 2010, more than one-third of adults in America were considered to be obese (1), and the prevalence of metabolic syndrome, a collection of clinical risk factors for cardiovascular disease, stroke, kidney disease, and type 2 diabetes mellitus, had risen to 23% of US adults (2). Clinical risk factors for metabolic syndrome include hyperglycemia, hypertriglyceridemia, hyperlipidemia, greater waist circumference, high blood pressure, and high cholesterol concentrations. Beltrán-Sánchez et al. (2) reported that the prevalence of metabolic syndrome decreased by 2.6% in the last decade (2000–2010), along with hypertriglyceridemia (−9.2%) and elevated blood pressure (−8.3%). Despite this decrease in overall metabolic syndrome, the study found that the prevalence of hyperglycemia and elevated waist circumference, or abdominal obesity, rose 7% and 10.7%, respectively, during the same time period. It can be postulated that the decrease in hypertriglyceridemia and elevation in blood pressure and LDL cholesterol concentrations is a result of an increased use of antihypertensive and lipid-modifying drugs to lower cardiovascular disease risk. However, few improvements have been observed for the prevalence of hyperglycemia or abdominal obesity.
Previous studies have shown that fruits including apples and cherries and their phytochemical extracts are effective for decreasing the risk factors associated with metabolic diseases such as abdominal fat accumulation, type 2 diabetes, heart disease, and inflammation (3–11). Apple consumption correlated with a decreased risk of developing type 2 diabetes and cardiovascular disease in the Women’s Health Study (12, 13). Two other studies (6, 7) demonstrated the ability of apples to inhibit lipid oxidation, reduce cholesterol, and improve glucose tolerance. Cherries also are able to help decrease the risk of developing metabolic diseases by reducing fat accumulation, body weight, cholesterol, and TG concentrations, improving glucose and insulin regulation, and promoting an anti-inflammatory state (8, 10, 11, 14). One phytochemical in these 2 commonly consumed fruits is quercetin, a compound shown previously to produce an anti-inflammatory effect (15). The C57BL/6J mouse strain was used to model the consumption of a high-calorie, high-fat (HF)8 diet by humans. When fed a normal low-fat (LF) diet, these mice remain normal weighted and healthy; however, when fed an HF diet, hyperphagia and obesity results. Hypothesizing that intake of apple peel extract (AE), cherry extract (CE), and quercetin brings metabolic benefits, we first observed their effect on hepatic metabolic markers and glucose control. Second, we compared observed physiologic effects to the molecular level by observing nuclear hormone receptor (NHR)–regulated hepatic gene expression. NHRs are transcription factors that potently activate or repress sets of genes related to specific metabolic pathways. Because some NHRs exhibit promiscuity in that they may bind many different molecules as ligands, we hypothesized that one metabolic action of phytochemicals is mediated by these promiscuous NHRs. Three receptors of particular interest to us were PPARα, which is involved in lipid oxidation; PPARγ, which regulates adipogenesis and glucose control; and Pregnane X Receptor, which is involved in xenobiotic and cholesterol metabolism and excretion (16). The PPARα receptor, for example, regulates a set of genes related to FA oxidation, including carnitine palmitoyltransferase 1α (Cpt1a) and acyl-CoA oxidase 1 (Acox1). This study was performed to identify metabolic and gene expression changes when commonly consumed polyphenol-rich foods, such as apples and cherries, and their components, such as quercetin, were provided to HF-fed, obese mice.
We hypothesized that mice fed polyphenol-rich extracts derived from apples and cherries and quercetin would modulate the harmful effects of adiposity produced by an obesogenic HF diet.
Methods
Preparation of AE and CE.
The extraction protocol was modified based on published methods (5, 17, 18), and the detailed method is described in Supplemental Text. Briefly, fruit purees were subjected to solid-phase extraction with the use of a hydrophobic polymer (Amberlite FPX-66; Rohm and Haas). The ethanol eluent was evaporated and freeze-dried to a powder.
Quantification of phytochemicals by HPLC.
Anthocyanins were analyzed by HPLC. Total anthocyanins were measured by AOAC method 2005.02 (pH differential method). Polymeric color and browning were measured by bisulfite bleaching. Total phenolic compounds were measured by the Folin-Ciocalteu spectrophotometric method. Phenolic compounds were analyzed by HPLC with the use of the method that has been proposed as an AOAC method for phenolic compound analysis. Antioxidants were measured by fluorescence recovery after photobleaching and oxygen radical absorbance capacity assays (19) and provided in Supplemental Table 1. The content of individual compounds in extracts was determined qualitatively by comparison of HPLC chromatograms of extracts and mixtures of phytochemical standards.
Mouse diet study.
Forty 6-wk-old male C57BL/6J mice (Jackson Laboratories) were randomly divided into 5 groups (n = 8): an LF group (10% energy from fat), an HF group (60% energy from fat), an HF plus 0.2% quercetin (HF+QUE) group, an HF plus 0.2% cherry extract (HF+CE) group, and an HF plus 0.2% apple peel extract (HF+AE) group. Equal amounts of extracts were used rather than using different amounts of extracts standardized to a single constituent or total polyphenols. The same amount of free quercetin was used in a fifth diet. Mice were housed 4/cage under standard conditions and acclimated for 2 wk with access to standard rodent diet and ad libitum water and a 12-h light/dark cycle. Experimental diets (Research Diets) and water were consumed ad libitum for 10 wk (Supplemental Table 2). Body weights, energy intake, and spillage were measured weekly (Figure 1). At the end of the study, food was withheld from mice for 6 h before anesthetization with isofluorane inhalation. Mice were killed by cardiac puncture and cervical dislocation, blood was collected, and glucose concentrations were measured with the use of a ReliOn Ultima Blood Glucose Monitoring System (Abbott). Serum was obtained by centrifugation at 2000 × g for 15 min at 4°C. Organ weights were measured and liver tissue was stored in RNAlater (AM7021; Ambion). Liver RNA was isolated by using Trizol (no. 15596–026; Ambion) and following the suggested product protocol. The mouse protocol was approved by the Institutional Animal Care and Use Committee at Oregon State University.
FIGURE 1.

Final body weight (A) and weekly energy intake (B) of male C57BL/6J mice fed an LF diet or HF diet alone or an HF diet containing apple peel extract, cherry extract, or quercetin for 10 wk. Energy intake was measured as a total for each group over the course of the study. Values are means ± SEMs, n = 8. Means without a common letter differ, P < 0.05. HF, high-fat; HF+AE, HF plus 0.2% apple peel extract; HF+CE, HF plus 0.2% cherry extract; HF+QUE, HF plus 0.2% quercetin; LF, low-fat.
Intraperitoneal glucose tolerance test.
A glucose tolerance test was performed at week 6. Food was withheld for 6 h before initial baseline glucose measurement. At time zero, a small tail cut was made and the initial baseline glucose measurement was taken. At this time, 10 μL 20% glucose in 0.9% saline/g body weight was injected intraperitoneally. Mice then were returned to their cage and tail blood glucose was measured every 30 min for 2 h (20–23).
Real time-PCR (RT-PCR).
RT-PCR protocol was conducted essentially as recommended by the reagent supplier (Real-time PCR Handbook; Life Technologies) and as modified by Nam and Knutson (24). Reagents used included Applied Biosystems High Capacity cDNA Reverse Transcription Kits (Life Technologies) and Multiscribe Reverse Transcriptase. Reaction conditions were 10 min at 25°C, 120 min at 37°C, and 5 min at 85°C.
Real-time PCR was completed with the use of an Applied Biosystems 7900HT Fast thermal cycler and SensiMix SYBR Master Mix (Origene) and following the manufacturer-suggested protocol. Standard curve samples were measured in triplicate for all primers tested. The ΔΔct method for PCR and Rpl30 typically was used as the housekeeping mRNA. The PCR reaction cycle was 10 min at 95°C followed by 40 cycles of 5 s at 95°C and 20 s at 60°C. Relative mRNA levels for samples were calculated with the use of standard curve data, and 1-factor ANOVA was used to determine significance.
Tissue fixation and staining.
Tissue fixation and staining was done according to standard histologic protocols. Trichrome staining was used and images were captured digitally.
Serum lipid analyses.
Serum was analyzed for TGs; total, HDL, LDL, and VLDL cholesterol; and liver cytosolic enzymes (alanine aminotransferase and aspartate aminotransferase) with the use of an automated Vitros 250 (Ortho Clinical Diagnostics). Directly measured values included total and HDL cholesterol, TGs, and alanine and aspartate aminotransferase. VLDL cholesterol was calculated with the formula TGs/2.2 and LDL cholesterol was calculated as a difference as follows: calculated LDL cholesterol = (total cholesterol – HDL cholesterol – VLDL cholesterol).
Serum cytokines and adipokines.
Cytokine concentrations were measured with the use of MILLIPLEX MAP kits (MAP2MAG-76K, MCYTMAG-70K-PX32, and MADKMAG-71K; Millipore) by following the manufacturer’s instructions. Plates were read on a Luminex 200 instrument with the use of xPONENT software. Data were analyzed by ANOVA with the use of Graph Pad software.
Cell culture.
HepG2 is a hepatocellular carcinoma cell line (no. HB-8065; ATCC); cells were maintained in 10% FBS in DMEM supplemented with 0.2% gentamicin and 0.2% fungizone. Reagents were from Gibco; cells were maintained in a humidified incubator at 37°C with 5% CO2.
To evaluate the effect of one purified compound, HepG2 cells were seeded with 1.4 × 10⁶ cells/mL (5 × 10⁶ cells/well) in 6-well plates for 24 h. Cell medium was then replaced with 1% FBS DMEM and incubated for another 24 h. Cells were incubated with 500 μmol oleic acid/L to induce intracellular hyperlipidemia, and cotreated with control (vehicle alone) or quercetin (10–100 μg/mL), concentrations that were determined by MTT assay (Life Technologies). Quercetin was dissolved in DMSO at 100 mmol/L. After 24 h of incubation, the medium was removed and Oil Red O (AMRESCO) staining was performed on cells with the use of standard protocols. Oil Red O was collected from stained cells and absorbance was measured at 500 nm.
Statistical analysis.
All data are means ± SEMs. One-factor and repeated-measures ANOVA was performed with the use of GraphPad Prism 6. Post hoc testing was performed with the use of Tukey’s multiple comparison testing after ANOVA indicated significance. P values of ≤0.05 were considered to be significant, and P values between 0.05 and 0.10 were referred to as trending toward significance. For glucose tolerance testing, a second ANOVA was completed only for all HF-fed groups to identify whether differences existed within the HF-fed groups (Figure 2B). This approach also was used in measurements of gene expression, in which only HF-fed groups were compared.
FIGURE 2.

Glucose concentration (A) and glucose tolerance (B) after food deprivation of male C57BL/6J mice fed an LF diet or HF diet alone or an HF diet containing apple peel extract, cherry extract, or quercetin for 6 wk. Mice were food-deprived 6 h before baseline blood glucose measurement. Values are means ± SEMs, n = 8. Means without a common letter differ, P < 0.05. *Tended to differ from HF when only HF-fed groups were compared, 0.05 < P < 0.01. HF, high-fat; HF+AE, HF plus 0.2% apple peel extract; HF+CE, HF plus 0.2% cherry extract; HF+QUE, HF plus 0.2% quercetin; LF, low-fat.
Results
Extract composition.
Phytochemical extracts are highly purified ethanol- and sugar-free powders rich in anthocyanins and polyphenols. The compositions are shown in Supplemental Table 1. Cherry extract polyphenols were predominantly chlorogenic acid, epicatechin, and rutin (quercetin-3-O-rutinoside). AEs were high in unconjugated quercetin and the quercetin conjugates quercetin 3-rhamnoside and rutin, along with lower amounts of chlorogenic acid and epicatechin. The AUCs indicated that the quercetin content of the CE was <5% of total polyphenols; for AE, all forms of quercetin combined were ∼30% of the total polyphenol content.
Energy intake and weight gain.
The body weight of the mice and their energy intake was not different between the HF-fed treatment groups; however, all HF-fed groups were different from the LF-fed control group (P ≤ 0.0001). In terms of grams of diet consumed per day, the LF-fed and HF-fed groups were not different; however, this comparison does not consider the difference in energy density of the LF and HF diets. At week 10, HF-fed mice weighed ∼14 g more than the LF-fed mice (P < 0.01). No difference was observed in energy consumed between the groups of HF-fed mice.
Glucose concentrations and glucose tolerance.
Baseline glucose measurements were taken at week 6 and at the end of the study on every mouse with the use of glucose test strips and a handheld glucometer. At week 6, all groups fed HF plus AE, CE, or quercetin had significantly lower baseline glucose concentrations than did the mice fed the HF diet alone (P < 0.05) and all 3 were also not different from LF-fed mice (Figure 2). At week 10, the HF+CE, HF+QUE, and HF+EA groups had intermediate baseline glucose concentrations compared with the HF-fed and LF-fed control groups, and the HF+AE treatment group had baseline glucose concentrations that were similar to those of the HF-fed control mice (data not shown). All HF-fed mice had reduced glucose response compared with LF-fed mice as measured by AUC in an intraperitoneal glucose tolerance test. In comparison with the HF-fed mice, both the HF+AE– and HF+QUE–fed mice showed improved glucose sensitivity (Figure 2B, P < 0.05).
Serum markers.
Serum collected by heart puncture at necropsy was analyzed for lipids and other blood markers (Supplemental Table 3). LDL, VLDL, and HDL cholesterol and TG concentrations showed no difference between all HF treatment groups, but HDL cholesterol concentrations were higher in HF-fed mice than in LF-fed mice (P = <0.001). Total cholesterol was lower in LF-fed mice than in HF-fed mice (P < 0.01), and elevation in total cholesterol in HF-fed compared with LF-fed mice was ameliorated by including AE in the HF diet at a concentration that did not differ significantly from either the LF-fed or HF-fed group. The remaining HF treatment groups showed no differences from the HF-fed control group for serum cholesterol. Creatinine concentrations were decreased in the HF+QUE–fed mice compared with all other groups (P ≤ 0.0001). Concentrations of alanine aminotransferase and aspartate aminotransferase showed no difference between any diet groups (Supplemental Table 3).
Serum hormone, cytokine, and adipokine concentrations were also measured (Supplemental Table 4). Several markers indicated profound metabolic differences between LF- and HF-fed mice, including C-reactive protein (CRP), insulin, leptin, plasminogen activator inhibitor 1 (PAI-1), and resistin; other markers were not different. CRP was reduced in quercetin-fed mice compared with HF-fed control and HF+AE–fed mice (P < 0.05) and was not distinguishable from that in the LF-fed group. Serum PAI-1 concentrations in HF+AE– and HF+CE–fed mice were lower than those in HF-fed control mice (P < 0.05). Leptin concentrations tended to be lower (P ≤ 0.10) in HF+CE–fed mice than in HF-fed control and HF+QUE–fed mice.
Hepatic gene expression.
Various hepatic mRNAs were shown to be upregulated by diet when measured via Real time-PCR (Figure 3). Compared with in HF-fed control mice, Cpt1a was higher in HF+AE–fed mice, and Acox1 was higher in HF+AE– and HF+QUE–fed mice (P < 0.05). Stearoyl-CoA desaturase 1 (Scd1) mRNA levels were measured and found not to be significantly different between groups. Other mRNAs were tested; however, no statistically significant differences in gene expression were observed (Supplemental Table 5).
FIGURE 3.

Cpt1a (A), Acox1 (B), and Scd1 (C) mRNA levels in male C57BL/6J mice fed an LF diet or HF diet alone or an HF diet containing apple peel extract, cherry extract, or quercetin for 10 wk. Values are normalized to Rpl30 gene expression and are expressed as a fold difference compared with the HF control diet. Values are means ± SEMs, n = 4–8. Means without a common letter differ, P < 0.05. Acox1, acyl-CoA oxidase 1; Cpt1a, Carnitine palmitoyltransferase 1α HF, high-fat; HF+AE, HF plus 0.2% apple peel extract; HF+CE, HF plus 0.2% cherry extract; HF+QUE, HF plus 0.2% quercetin; Rpl30, ribosomal protein L30; Scd1, stearoyl-CoA desaturase 1.
Histology.
Liver tissue sections were stained to identify areas of fat accumulation and fibrosis; representative images for each group are in Figure 4. Slides of the livers from the HF-fed mice exhibited moderate to severe zone 3 (centrilobular) steatosis to random and bridging areas of microvacuolar steatosis with lesser areas of macrovacuolar steatosis. Inflammation was rare and frank fibrosis was not evident. Slides of the livers of the LF-fed mice exhibited mild periportal or random microvacuolization. In the livers of the HF-fed control mice, many cell nuclei were shifted from a location in the center of the hepatocyte to the periphery, apparently due to interference from normal cell structure because of the presence of numerous large fat globules. In contrast, hepatocytes from the AE-, CE-, and quercetin-fed mice appeared to have an intermediate appearance. A qualitative visual inspection of the liver at necropsy confirmed these histologic observations. The livers of the LF-fed mice were dark red; the livers of the HF-fed control mice were a pale tan color, suggestive of a high fat content; and the various phytochemical-fed groups had livers with intermediate coloration.
FIGURE 4.
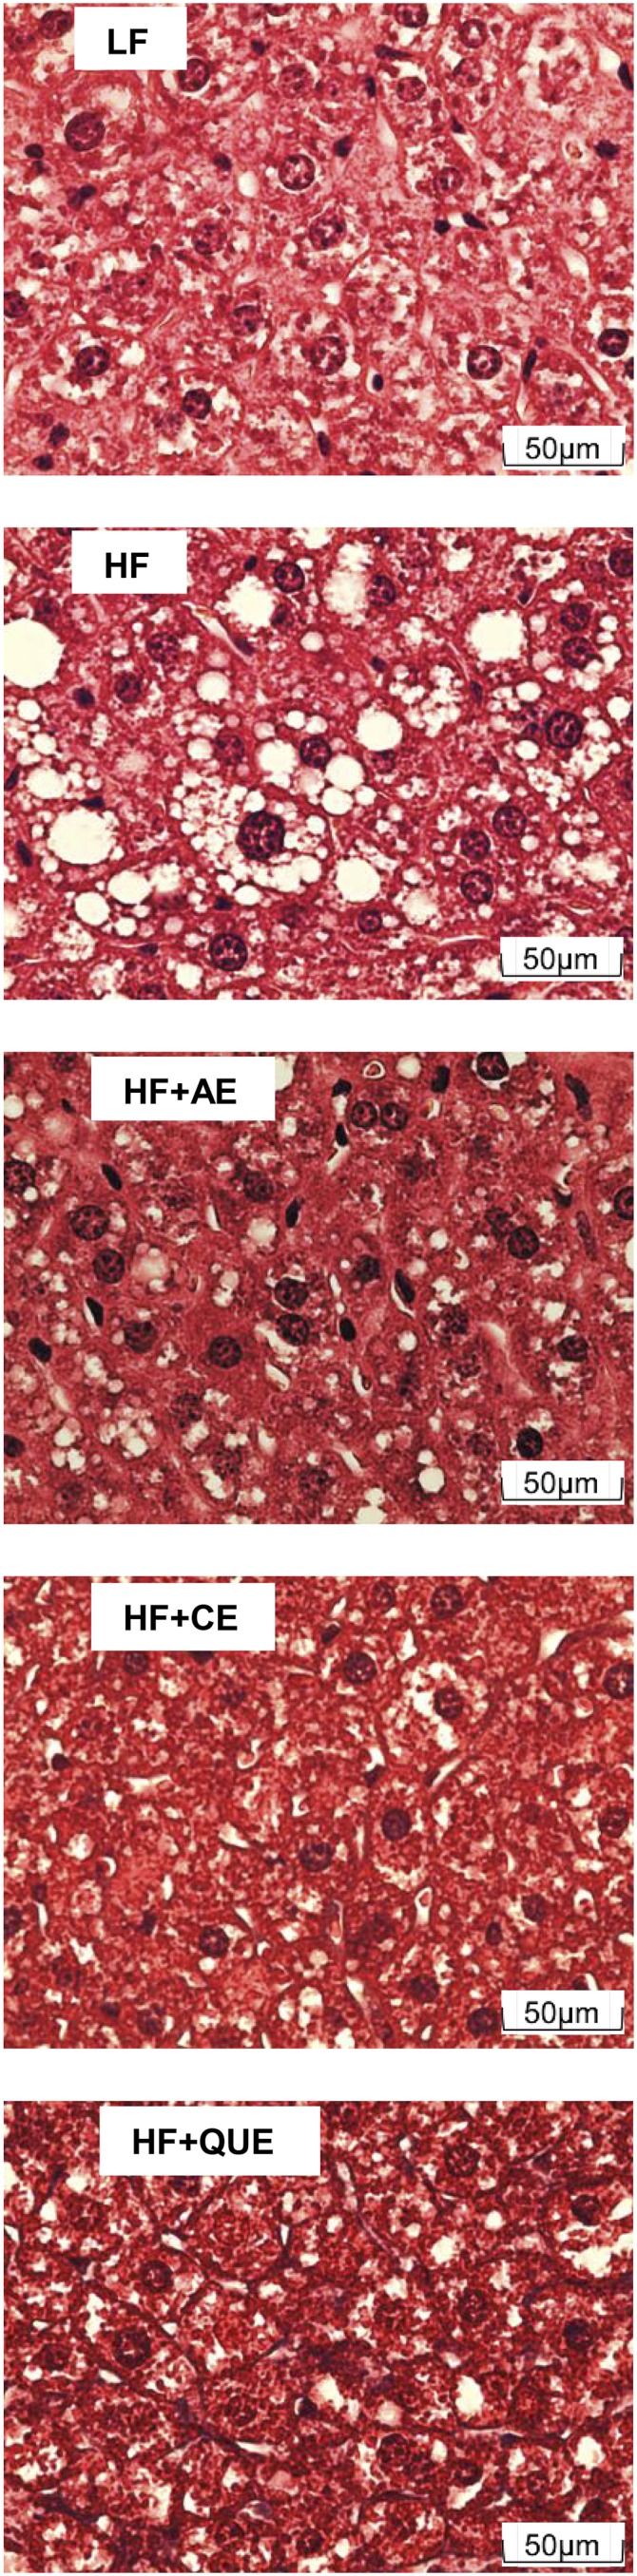
Liver histology stained with trichrome from male C57BL/6J mice fed an LF diet or HF diet alone or an HF diet containing apple peel extract, cherry extract, or quercetin for 10 wk. White globules within cells identify lipid accumulation. Scale: 0.5 inch = 50 μm. HF, high-fat; HF+AE, HF plus 0.2% apple peel extract; HF+CE, HF plus 0.2% cherry extract; HF+QUE, HF plus 0.2% quercetin; LF, low-fat.
In vitro hyperlipemia.
Finally, within the confines of a simple cell culture trial, we evaluated the hypothesis that quercetin could have an impact on cellular lipid accumulation. HepG2 cells were induced to become hyperlipidemic by incubation with oleic acid (cis-9-Octadecenoic). This MUFA has been shown to promote lipid accumulation without cell death in several different cell culture models. When coincubated with quercetin, a dose-dependent reduction in cellular lipid accumulation was observed (Figure 5; P < 0.05).
FIGURE 5.

Oil Red O staining of HepG2 cells exposed to oleic acid and various concentrations (0–100 μmol/L) of quercetin for 24 h. Intracellular lipid accumulation was measured. Values are means ± SEMs, n = 8. Means without a common letter differ, P < 0.05. QUE, quercetin.
Discussion
The obese state correlates with the risk of type 2 diabetes, cardiovascular disease, hepatosteatosis, and chronic inflammation. In animal models, phenolic acid– and anthocyanin-rich extracts have been shown to ameliorate some of the metabolic dysfunction that results from obesity (5, 8, 25–27). Although some studies have examined the effect of the intake of apples, cherries, and their phytochemical extracts, to our knowledge, the present study is unique in that it examines the relative effects of these 2 phytochemical extracts side by side, along with the abundant phytochemical, quercetin, by using the HF-fed C57BL/6J mouse model. At the given level of incorporation into the diet (0.2% wt:wt), this intake is equivalent to a person’s consuming approximately two 500-mg quercetin capsules/d, when the FDA-recommended dose conversion factor of 12.3 is used to translate mouse to human (28). Similar calculations show that the amount of AE and CE provided to these mice is similar to a few servings of each given fruit per day for a human. This conversion is necessary when one compares the metabolic rate and energy intake of a mouse, which might consume an amount of food equivalent to ∼10% of its own body weight, with humans, who typically consume a substantially lower amount of energy each day in proportion to their body weight.
In week 6, baseline glucose concentrations were shown to be reduced in all mice fed the HF diet plus a supplement compared with HF-fed control mice. This antidiabetic effect might be mediated through regulatory factors, including PPARγ or AMP-activated protein kinase.
No difference was observed in the HF-fed groups for LDL, VLDL, and HDL cholesterol and TGs. The absence of supplemental cholesterol in our diets may explain these data. Still, serum total cholesterol was reduced (P < 0.05) in HF+AE–fed mice compared with HF-fed mice. Creatinine concentrations were decreased in HF+QUE–fed mice compared with both HF-fed control and LF-fed mice. Because elevated serum creatinine is indicative of renal failure and is associated with high blood pressure and diabetes mellitus (29), it may be of interest to further explore this finding.
Several markers of chronic inflammation response and endocrine function were changed in mice fed the HF diets that were supplemented. Perhaps most importantly, the addition of quercetin to the HF diet resulted in a reduction in CRP concentrations to the concentrations observed in LF-fed mice.
The hyperinsulinemia observed in HF-fed mice at week 6 was ameliorated in HF+AE– and HF+QUE–fed mice to a level statistically equivalent to that observed in LF-fed mice. These data are consistent with the glucose AUC data reported in Figure 2 in that AUC values for those 2 groups tended to be lower than AUC values measured in HF-fed mice (P < 0.10). Changes were also observed in serum PAI-1 concentrations for both extract-fed groups. PAI-1 is a marker of metabolic syndrome and an inhibitor of fibrinolysis, and contributes to the pathology of fibrosis in tissues, including the liver and kidney.
Phytochemicals have been shown to have an impact on NHR-mediated regulation, notably for PPARα (11, 26, 30, 31), PPARγ (26, 30, 32), and PXR (33, 34), and regulation via the transcription factor Nuclear factor (erythroid-derived 2)-like 2 (35). FAs and fibrates have been found to serve as ligands for PPARα, along with other natural compounds, such as soy isoflavones (30, 31) and compounds in tart cherry powder (11). In 2003, Mezei et al. (30) observed an antidiabetic and hypolipidemic effect of soy isoflavones and attributed the effects to an increase in PPAR pathway activation. In 2006, Mezei et al. (31) further confirmed the role of soy isoflavones in activating PPARα by using a PPARα knockout model. The expression of Cpt1a was measured to confirm PPARα activity. The Cpt1a gene is strongly regulated by PPARα, and serves as a good marker for PPARα activation (37). Other genes that are regulated by PPARα are Acox1 and Scd1 (11, 37).
Cpt1a mRNA levels were increased in HF+AE–fed mice. Similar results were observed for Acox1, for which HF+AE– and HF+QUE–fed mice had increased relative expression. Scd1 mRNA expression appeared to parallel Cpt1a and Acox1, but no statistical differences were observed (P = 0.11). Recently, Okla et al. (37) demonstrated the potency of ellagic acid (4,4,5,5,6,6-Hexahydroxydiphenic acid 2,6,2,6-dilactone) in reducing hepatic lipid concentrations, perhaps involving PPARα as well.
Our qualitative histologic observations of the liver suggest a reduction in intracellular fat, especially in the HF+AE– and HF+CE–fed mice. A cell culture study also confirmed the ability of quercetin to remediate the dysregulated accumulation of lipid in HepG2, a hepatoma cell line commonly used as a human cell culture model for the hepatocyte. Reductions in hepatic lipid content would be entirely consistent with PPARα activation.
It is amply clear that bioactives likely act via a number of different mechanism and pathways (35). In the present study, it is suggested that NHR activation may explain our data. Remarkably, these physiologic and molecular changes occurred without a significant reduction in body weight or calorie consumption, suggesting some degree of metabolic improvement uncoupled from obesity.
We do not suggest that quercetin is the single bioactive factor in these foods or food extracts, but rather that the entire assembly of constituents needs to be considered the bioactive entity. A challenge for future research is not only to describe the improvements produced by the intake of specific healthful foods or phytochemicals, but also to determine what beneficial synergies may be produced by consuming complementary healthy foods containing a variety of bioactive compounds, acting on multiple and molecular-level regulatory pathways.
Acknowledgments
We thank Robert Durst at the Linus Pauling Institute for analysis of phytochemical content of fruit extracts, Michael Pellizzon of Research Diets, Inc. for helpful discussion, and Misty Bechtel at the University of Kansas Medical Center for analysis of serum cytokines, hormones, and adipokines. SMS, JH-R, DKS, and NFS designed the research; SMS, BZ, TL, CK, GC, and NFS conducted the research; SMS and NFS analyzed the data and wrote the paper; and NFS had primary responsibility for the final content. All authors read and approved the final manuscript.
Footnotes
Abbreviations used: Acox1, acyl-CoA oxidase 1; AE, apple peel extract; CE, cherry extract; Cpt1a, carnitine palmitoyltransferase 1α; CRP, C-reactive protein; HF, high-fat; HF+AE, HF plus 0.2% apple peel extract; HF+CE, HF plus 0.2% cherry extract; HF+QUE, HF plus 0.2% quercetin; LF, low-fat; NHR, nuclear hormone receptor; PAI-1, plasminogen activator inhibitor 1α; Rpl30, ribosomal protein L30; RT-PCR; real time PCR; Scd1, stearoyl-CoA desaturase 1.
References
- 1.Flegal KM, Carroll MD, Ogden CL, Curtin LR. Prevalence and trends in obesity among US adults, 1999–2008. JAMA 2010;303:235–41. [DOI] [PubMed] [Google Scholar]
- 2.Beltrán-Sánchez H, Harhay MO, Harhay MM, McElligott S. Prevalence and trends of metabolic syndrome in the adult US population, 1999–2010. J Am Coll Cardiol 2013;62:697–703. [DOI] [PMC free article] [PubMed] [Google Scholar]
- 3.Hyson DA. A comprehensive review of apples and apple components and their relationship to human health. Adv Nutr 2011;2:408–20. [DOI] [PMC free article] [PubMed] [Google Scholar]
- 4.McCune LM, Kubota C, Stendell-Hollis NR, Thomson CA. Cherries and health: a review. Crit Rev Food Sci Nutr 2011;51:1–12. [DOI] [PubMed] [Google Scholar]
- 5.Gourineni V, Shay NF, Chung S, Sandhu AK, Gu L. Muscadine grape (Vitis rotundifolia) and wine phytochemicals prevented obesity-associated metabolic complications in C57BL/6J mice. J Agric Food Chem 2012;60:7674–81. [DOI] [PubMed] [Google Scholar]
- 6.Johnston KL, Clifford MN, Morgan LM. Possible role for apple juice phenolic compounds in the acute modification of glucose tolerance and gastrointestinal hormone secretion in humans. J Sci Food Agric 2002;82:1800–5. [Google Scholar]
- 7.Boyer J, Liu RH. Apple phytochemicals and their health benefits. Nutr J 2004;3:5. [DOI] [PMC free article] [PubMed] [Google Scholar]
- 8.Jayaprakasam B, Olson LK, Schutzki RE, Tai M-H, Nair MG. Amelioration of obesity and glucose intolerance in high-fat-fed C57BL/6 mice by anthocyanins and ursolic acid in cornelian cherry (Cornus mas). J Agric Food Chem 2006;54:243–8. [DOI] [PubMed] [Google Scholar]
- 9.Kelley DS, Adkins Y, Reddy A, Woodhouse LR, Mackey BE, Erickson KL. Sweet bing cherries lower circulating concentration of markers for chronic inflammatory disease in healthy humans. J Nutr 2013;143:340–4. [DOI] [PubMed] [Google Scholar]
- 10.Kelley DS, Rasooly R, Jacob RA, Kader AA, Mackey BE. Consumption of bing sweet cherries lowers circulating concentrations of inflammation markers in healthy men and women. J Nutr 2006;136:981–6. [DOI] [PubMed] [Google Scholar]
- 11.Seymour EM, Singer AAM, Kirakosyan A, Urcuyo-Llanes DE, Kaufman PB, Bolling SF. Altered hyperlipidemia, hepatic steatosis, and hepatic peroxisome proliferator-activated receptors in rats with intake of tart cherry. J Med Food 2008;11:252–9. [DOI] [PubMed] [Google Scholar]
- 12.Song Y, Manson J, Buring J, Sesson H, Lin S. Associations of dietary flavonoids with risk of type 2 diabetes, and markers of insulin resistance and systemic inflammation in women: a prospective and cross-sectional analysis. J Am Coll Nutr 2005;24:376–84. [DOI] [PubMed] [Google Scholar]
- 13.Sesso HD, Gaziano JM, Liu S, Buring J. Flavonoid intake and risk of cardiovascular disease in women. Am J Clin Nutr 2003;77:1400–8. [DOI] [PubMed] [Google Scholar]
- 14.Zhou Z, Nair MG, Claycombe KJ. Snergistic inhibition of interleukin-6 production in adipose stem cells by tart cherry anthocyanins and atorvastatin. Phytomedicine 2012;19:878–81. [DOI] [PubMed] [Google Scholar]
- 15.Chuang CC, Martinez K, Xie G, Kennedy A, Bumrungpert A, Overman A, Jia W, McIntosh MK. Quercetin is equally or more effective than resveratrol in attenuating tumor necrosis factor-{alpha}-mediated inflammation and insulin resistance in primary human adipocytes. Am J Clin Nutr 2010;92:1511–21. [DOI] [PMC free article] [PubMed] [Google Scholar]
- 16.Chawla A, Repa JJ, Evans RM, Mangelsdorf DJ. Nuclear receptors and lipid physiology: opening the X-files. Science 2001;294:1866–70. [DOI] [PubMed] [Google Scholar]
- 17.He X, Liu RH. Phytochemicals of apple peels: isolation, structure elucidation, and their antiproliferative and antioxidant activities. J Agric Food Chem 2008;56:9905–10. [DOI] [PubMed] [Google Scholar]
- 18.Sun J, Chu Y, Wu X, Liu RH. Antioxidant and antiproliferative activities of common fruits. J Agric Food Chem 2002;50:7449–54. [DOI] [PubMed] [Google Scholar]
- 19.Waterhouse AL. Pigments, colorants, flavors, texture, and bioactive food components. In: Wrolstad RE, editor. Handbook of food analytical chemistry. New York: John Wiley and Sons; 2005. p. 463–70. [Google Scholar]
- 20.Andrikopoulos S, Blair AR, Deluca N, Fam BC, Proietoo J. Evaluating the glucose tolerance test in mice. Am J Physiol Endocrinol Metab 2008;295:E1323–32. [DOI] [PubMed] [Google Scholar]
- 21.Ayala JE, Samuel VT, Morton GJ, Obici S, Croniger CM, Shulman GI, Wasserman DH, McGuinness OP. Standard operating procedures for describing and performing metabolic tests of glucose homeostasis in mice. Dis Model Mech 2010;3:525–34. [DOI] [PMC free article] [PubMed] [Google Scholar]
- 22.Heikkinen S, Argmann CA, Champy M, Auwerx J. Evaluation of Glucose Homeostasis. In: Current protocols in molecular biology. New York: John Wiley and Sons; 2007. p. 29B.3.1–29B.3.22. [DOI] [PubMed] [Google Scholar]
- 23.Christensen SD, Mikkelsen LF, Fels JJ, Bodvarsdóttir TB, Hansen AK. Quality of plasma sampled by different methods for multiple blood sampling in mice. Lab Anim 2009;43:65–71. [DOI] [PubMed] [Google Scholar]
- 24.Nam H, Knutson MD. Effect of dietary iron deficiency and overload on the expression of ZIP metal-ion transporters in rat liver. Biometals 2012;25:115–24. [DOI] [PMC free article] [PubMed] [Google Scholar]
- 25.Prior RL, Wu X, Gu L, Hager TJ, Hager A, Howard LR. Whole berries versus berry anthocyanins: interactions with dietary fat levels in the C57BL/6J mouse model of obesity. J Agric Food Chem 2008;56:647–53. [DOI] [PubMed] [Google Scholar]
- 26.Moon J, Do H, Kim OY, Shin M. Anti-obesity effects of quercetin-rich onion peel extract on the differentiation of 3T3–L1 pre-adipocytes and the adipogenesis in high fat-fed rats. Food Chem Toxicol 2013;58:347–54. [DOI] [PubMed] [Google Scholar]
- 27.Baur JA, Pearson KJ, Price NL, Jamieson HA, Lerin C, Kalra A, Prabhu VV, Allard JS, Lopez-Lluch G, Lewis K, et al. Resveratrol improves health and survival of mice on a high-calorie diet. Nature 2006;444:337–42. [DOI] [PMC free article] [PubMed] [Google Scholar]
- 28. Guidance for industry—estimating the maximum safe starting dose in initial clinical trials for therapeutics in adult healthy volunteers. US Department of Health and Human Services. Published by: Food and Drug Administration, Center for Drug Evaluation and Research (CDER), July 2005, Pharmacology and toxicology.
- 29.Coresh J, Wei L, McQuillan G, Brancati FL, Levey AS, Jones C, Klag MJ. Prevalence of high blood pressure and elevated serum creatinine level in the United States. Arch Intern Med 2001;161:1207–16. [DOI] [PubMed] [Google Scholar]
- 30.Mezei O, Banz WJ, Steger RW, Peluso MR, Winters TA, Shay N. Soy isoflavones exert antidiabetic and hypolipidemic effects through the PPAR pathways in obese Zucker rats and murine RAW 264.7 cells. J Nutr 2003;133:1238–43. [DOI] [PubMed] [Google Scholar]
- 31.Mezei O, Li Y, Mullen E, Ross-Viola JS, Shay NF. Dietary isoflavone supplementation modulates lipid metabolism via PPARα-dependent and -independent mechanisms. Physiol Genomics 2006;26:8–14. [DOI] [PubMed] [Google Scholar]
- 32.Park HJ, Jung UJ, Lee M, Cho S, Jung H, Hong JH, Park YB, Kim SR, Shim S, Jung J, et al. Modulation of lipid metabolism by polyphenol-rich grape skin extract improves liver steatosis and adiposity in high fat fed mice. Mol Nutr Food Res 2013;57:360–4. [DOI] [PubMed] [Google Scholar]
- 33.Li Y, Mezei O, Shay NF. Human and murine hepatic sterol-12-α-hydroxylase and other xenobiotic metabolism mRNA are upregulated by soy isoflavones. J Nutr 2007;137:1705–12. [DOI] [PubMed] [Google Scholar]
- 34.Li Y, Ross-Viola JS, Shay NF, Moore DD, Ricketts M. Human CYP3A4 and murine Cyp3A11 are regulated by equol and genistein via the pregnane X receptor in a species-specific manner. J Nutr 2009;139:898–904. [DOI] [PMC free article] [PubMed] [Google Scholar]
- 35.Chuang CC, McIntosh MK. Potential mechanisms by which polyphenol-rich grapes prevent obesity-mediated inflammation and metabolic diseases. Annu Rev Nutr 2011;31:155–76. [DOI] [PubMed] [Google Scholar]
- 36.Hsu MH, Savas U, Griffin KJ, Johnson EF. Identification of peroxisome proliferator-responsive human genes by elevated expression of the peroxisome proliferator-acitvated receptor α in HepG2 cells. J Biol Chem 2001;276:27950–8. [DOI] [PubMed] [Google Scholar]
- 37.Okla M, Kang I, Kim da M, Gourineni V, Shay N, Gu L, Chung S. Ellagic acid modulates lipid accumulation in primary human adipocytes and human hepatoma Huh7 cells via discrete mechanisms. J Nutr Biochem 2015;26:82–90. [DOI] [PubMed] [Google Scholar]