

Abstract
Structure-function studies on steroid transforming enzymes often use site-directed mutagenesis to inform mechanisms of catalysis and effects on steroid binding, and data are reported in terms of changes in steady state kinetic parameters kcat, Km and kcat/Km. However, this dissection of function is limited since kcat is governed by the rate-determining step and Km is a complex macroscopic kinetic constant. Often site-directed mutagenesis can lead to a change in the rate-determining step which cannot be revealed by just reporting a decrease in kcat alone. These issues are made more complex when it is considered that many steroid transforming enzymes have more than one substrate and product. We present the case for using transient-kinetics performed with stopped-flow spectrometry to assign rate constants to discrete steps in these multi-substrate reactions and their use to interpret enzyme mechanism and the effects of disease and engineered mutations. We demonstrate that fluorescence kinetic transients can be used to measure ligand binding that may be accompanied by isomerization steps, revealing the existence of new enzyme intermediates. We also demonstrate that single-turnover reactions can provide a klim for the chemical step and Ks for steroid-substrate binding and that when coupled with kinetic isotope effect measurements can provide information on transition state intermediates. We also demonstrate how multiple turnover experiments can provide evidence for either “burst-phase” kinetics, which can reveal a slow product release step, or linear-phase kinetics, in which the chemical step can be rate-determining. With these assignments it becomes more straightforward to analyze the effects of mutations. We use examples from the hydroxysteroid dehydrogenases (AKR1Cs) and human steroid 5β-reductase (AKR1D1) to illustrate the utility of the approach, which are members of the aldo-keto reductase (AKR) superfamily.
Keywords: Aldo-keto reductase, Hydroxysteroid dehydrogenase, Kinetic-isotope effect, Stopped-flow, Steroid double-bond reductases, Transient-kientics
1. Introduction
To the novice, enzymes are described in terms of their steady state kinetic parameters: kcat (Vmax/[Et]) or turnover number in units of min−1; Km (substrate concentration at which half-maximal velocity is observed) in units of molarity; and kcat/Km or catalytic efficiency in units of min−1 M−1 making it a formal bimolecular rate constant. Both kcat and Km are macroscopic rate constants and can comprise multiple steps governed by several microscopic rate constants that are not revealed in these terms. Moreover, Km is often misinterpreted as being a measure of substrate affinity when even the simple Briggs–Haldane [1] treatment of the Michaelis–Menten equation [2] teaches us otherwise. Nevertheless the literature is abound with articles that interpret the effects of disease-based mutations or the effects of site-directed mutants on steroidogenic enzymes using these steady-state kinetic parameters when the true effect of these mutations is buried within the microscopic rate constants that make up these terms. The cursory investigation of mutations using steady-state kinetic parameters can occur when investigators interested in the physiology of a problem do not appreciate the shortcomings of the approach. Clearly, there is a need for approaches that permit individual steps governed by microscopic rate constants in the reaction scheme to be dissected so that the true effect of a mutation can be revealed. Transient kinetic approaches in which discrete steps of an enzyme reaction are captured provide the necessary window to dissect enzyme reactions and the effects of mutations more precisely. The use of transient kinetics is clearly beneficial to the study of steroid transforming enzymes, where natural occurring mutations are often causal in disease [3–6] and site-directed mutagenesis can inform structure-function relationships. As will be seen later one criteria for this approach is that it requires milligram amounts of homogeneous enzyme and therefore precludes the studies of some hydroxysteroid dehydrogenases. However, with improvement in expression systems and enzyme purification techniques this hurdle will likely be surmounted in the future.
2. Stopped-flow instrument/quench flow
Stopped-flow spectrometry provides a method to dissect individual components of an enzyme dependent reaction. Stopped-flow techniques were developed by Britton–Chance in the Johnson Foundation at the University of Pennsylvania [7,8]. The essentials of the apparatus consist of (a) two pneumatically driven syringes which contain different components of the reaction under study (enzyme and substrate); (b) a mixing device; (c) an observation cell with detection system; and (d) a stopping syringe. The reactant syringes deliver set amounts of reactant into the mixing chamber (20–50 μL) and the mixture is forced into the observation chamber. A small movement of the plunger of the stopped syringe brings it to a mechanical stop which prevents further mixing and activates the detection system. The time that elapses between mixing the reactants and data collection is known as the dead-time of the instrument which is typically 1–3 ms. The resultant absorbance or fluorescence change that occurs as a result of the enzymatic reaction is measured on a millisecond time scale. The experimental set up requires that a change occurs that can be measured spectrally, Fig. 1. When a spectral change cannot be monitored the alternative would be to conduct quench-flow experiments. Data from quench-flow experiments can be analyzed in the same manner as data from stopped-flow experiments since the transient kinetics being monitored are the same. In the stopped-flow, different types of experiments can be conducted. These include ligand binding studies, ligand chase experiments, single-turnover experiments and multiple turnover experiments. Single-turnover experiments allow only a single turnover event to occur and is representative of a single molecule of substrate being turned over by a single molecule of enzyme and can be referred to as “single-molecule enzymology.” Examples of these experimental approaches will be given in subsequent sections.
Fig. 1.

Stopped-flow instrument. (A) Schematic of stopped-flow principle; (B) Components of Applied Photophysics stopped-flow instrument.
Stopped-flow experiments are usually conducted with syringes 2–5 mL in volume which contain micromolar quantities of enzyme. These high concentrations are required so that spectral changes involving enzyme absorbance or fluorescence can be detected. Thus a series of experiments in which replicates are required may require >5–10 mg of protein which can usually be met using recombinant enzymes expressed in Escherichia coli or Saccharomy-ces etc. When the absorbance or fluorescence change is due to the consumption of substrate or the appearance of product the change is calibrated using a standard curve. Curve-fitting of the data is an important aspect of the stopped-flow experiment and a number of equations (Eqs. (1)–(4)) and simulation routines are available to fit the observed progress curves.
| (1) |
| (2) |
| (3) |
| (4) |
(where A = amplitude of the signal; kobs = pseudo-first order rate constant; a = intercept; kss = second order rate constant of the linear phase; and kburst is the pseudo-first order rate constant of the exponential phase).
Curve fitting of the progress curves to equations is usually performed using any number of software packages e.g., DynaFit, Grafit. Goodness-of-fit is usually determined by the pattern of the residuals. Kinetic simulation programs are also available. In KINSIM the investigator simulates the time course of one or more reactions, changing the rate constants, concentrations etc., [9] to obtain reasonable fits of simulated progress curves to real data. The approximate fits can then be used in FITSIM to provide global fitting of many sets of data [10]. These older programs are not compatible with modern PC’s and another alternative is COPASI. Once all the microscopic rate constants for both a forward and reverse reaction have been derived they can be reconciled to the experimentally determined Keq using the Haldane relationship (Eq. (5)) [11,12]. Examples of these approaches using steroid transforming enzymes of the aldo-keto reductase (AKR) superfamily now follow. These enzymes include the hydroxysteroid dehydrogenases (AKR1C sub-family) and steroid 5β-reductase (AKR1D sub-family). Each of these enzymes follow an ordered bi bi kinetic mechanism in which cofactor binds first and leaves last, Fig. 2.
Fig. 2.
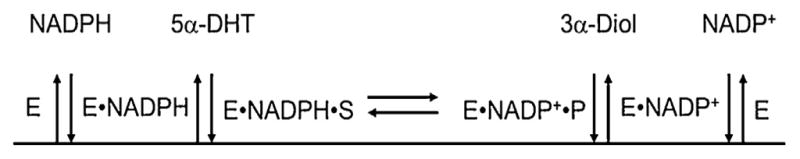
Ordered Bi–Bi mechanism for aldo-keto reductases. Schematic of ordered bi–bi mechanism for AKR1C enzymes catalyzing the reduction of 5α-DHT using the Cleland notation. E = enzyme; S = steroid substrate; and P = steroid product. 3α-diol, 5α-androstan-3α,17β-diol.
| (5) |
3. Studies with steroid transforming aldo-keto reductases
3.1. Ligand binding and release
In an ordered bi–bi reaction the sequential binding and release of the first and second substrate can often be monitored in the stopped-flow. AKR1 family members share this kinetic mechanism, a common (α/β)8 barrel fold and a highly conserved NADP(H) binding site [13]. The nicotinamide head group of the cofactor inserts itself in close proximity to a conserved Trp residue and upon doing so a portion of the intrinsic protein fluorescence is quenched (Ex 285 nm and Em 330 nm) [14]. When NADPH is used there is energy transfer between the Trp residue and the dihydronicotinamide ring to give a new fluorescence signal (Ex 285 nm and Em 450 nm). The loss of fluorescence at 340 nm can be used to monitor NADP+ and NADPH binding and the increase in fluorescence at 450 nm can be used to monitor only NADPH binding. In the steady state, fluorescence titration experiments yield KdNADPH 140 nM and KdNADP+ 320 nM for AKR1C9 (rat liver 3α-hydroxysteroid dehydrogenase) [11]. However, these experiments fail to identify the isomerization events that take place during cofactor binding and the new enzyme intermediates that may exist.
In these experiments the investigator needs to ensure that they keep the NADPH concentration in the low micromolar range to avoid artifacts due to the inner-filter effect where NADPH absorbance may cause self-quench and because of the ability of NADPH to quench the fluorescence of free Trp in solution (a non-binding event). Concentration limits for NADPH can be set by conducting control fluorescence titration experiments between NADPH and free Trp.
In the stopped-flow, kinetic fluorescence transients can distinguish between a single step, two-step and three-step binding model. If it is single-step binding mechanism then it is diffusion controlled and is too rapid to measure as a kinetic fluorescence transient. Therefore, the change in fluorescence is within the dead-time of the instrument. More often, there is a single exponential decay in the fluorescence signal and this is due to a two-step binding mechanism comprised of a rapid binding step followed by a slow isomerization event. When the kinetic transient does not fit to the single exponential equation, a double exponential equation is used. In this instance a three-step binding model is invoked in which there is a rapid binding step followed by two slow isomerization events. To distinguish between the latter two models one examines the size and distribution of the residuals that result from the fits.
Using stopped-flow methods in which one syringe contained AKR1C9 (0.25 μM) and the second syringe contained increasing concentrations of cofactor (2.5–40 μM NADP+) quenching of the tryptophan fluorescence revealed that this was accompanied by a kinetic fluorescence transient [11]. Curve-fitting showed that the double exponential equation provided the best fit to the progress curve (where A = ΔF) in which there was both a fast and slow phase revealing the formation of a loose complex (E.NADP+) which is diffusion controlled, the formation of a tight complex (E*.NADP+) governed by the fast phase; and the formation of a very tight complex (E**.NADP+) governed by the slow phase. Plots of kobs for the fast and slow phases yielded saturation kinetics and provided estimates of the Kd for the loose complex and tight complex where the Kd for the loose complex is 1–2 orders of magnitude greater than that observed for the tight complex determined by fluorescence titration in the steady state. The presence of these additional enzyme forms could have only been detected by the stopped flow technique. Similar results were subsequently reported for AKR1C2 (human type 3 3α-hydroxysteroid dehydrogenase), which is involved in the inactivation of DHT in the prostate, Fig. 3 [15]. In an important aspect of this work it was found that the koff for the E.**NADP+ complex and the koff for the E**.NADPH complex gave values of 2.9 s−1 and 6.4 s−1 which can place an upper limit on kcat.
Fig. 3.

Isomerization events associated with NADP(H) binding to AKR1C2 (type 3 3α-hydroxysteroid dehydrogenase). Global simulation of progress curves for the binding of NADPH to AKR1C2. Experimental (gray) and simulated (black) progress curves of protein fluorescence at 330 nm are shown. The samples contained 0.5 μM AKR1C2 and 5.0, 7.5, and 12.5 μM NADPH (top to bottom in panel A) (all final concentrations). (B) Secondary plots of the observed rate constants vs [NADPH] fitted to a hyperbolic function using multiple concentrations of NADPH. Adapted from reference 15.
Examination of the crystal structure of AKR1C9.NADP+ binary complex showed that the 2′-phosphate of AMP is anchored by a conserved arginine residue, Arg 276. When the Arg276Met mutant was generated the fluorescence kinetic transient associated with cofactor binding was eliminated and NADP(H) could only form the loose complex, and gave Kd values for NAD(P)H reminiscent of that observed with NAD(H) [16]. It should be noted that the AKR1C enzymes also bind NAD(H) with an affinity that is 2–3 orders of magnitude lower than observed with NADP(H). With this knowledge it was apparent that the tight E*.NADP+ complex was due to cofactor anchoring and this event was required for the formation of the very tight E**.NADP+ complex which likely reffects loop movement over the pyrophosphate bridge to form a tunnel.
koff for cofactor release can also be measured directly by conducting a ligand chase experiment [11]. In this experiment the E**.NADP+ complex is pre-formed in one syringe and an excess of NADPH is mixed from a second syringe. The formation of the energy transfer band at 450 nm is followed as NADPH chases NADP+ from the binary complex. This approach was used to verify that the AKR1D1 P133R disease mutant implicated in bile-acid deficiency had a significantly reduced affinity for NADPH versus the wild type enzyme [17]. Wild-type AKR1D1 demonstrated that NADPH could chase NADP+ with a measurable exponential increase in fluorescence at 450 nm. By contrast the chase of enzyme-bound NADP+ with NADPH from the P133R mutant occurred at a rate too fast to measure indicative of the low affinity for cofactor, Fig. 4. Previous studies failed to implicate the P133R mutant in cofactor binding [18]. This long range effect resulted in 80-fold reduction in cofactor affinity and ensured that the mutant enzyme remained in its cofactor free labile form; and provided an explanation as to how this mutation contributes to bile-acid deficiency. This molecular basis for bile-acid deficiency could only have been revealed by stopped-flow approaches.
Fig. 4.

Ligand chase experiments from AKR1D1 and the P133R mutant. NADP+ is chased from the E·NADP+ complex by NADPH. The P133R mutant (red) showed a much faster rate of releae of NADP+ than the WT (green). An enzyme-NADP+ solution (AKR1D1, 1 μM; NADP+, 5 μM) from one syringe was rapidly mixed (1:1) with a NADPH solution (100 μM) from the second syringe in the stopped-flow. In the control experiments, the enzyme solution or the buffer were mixed with the NADPH solution in the stopped-flow (blue). Experiments were performed in 100 mM potassium phosphate pH 7.0. Reproduced with permission from the American Chemical Society, Biochemistry (2015) [Epub ahead of print Sep 29]. (For interpretation of the references to color in this figure legend, the reader is referred to the web version of this article.)
The energy transfer band observed at 450 nm following formation of an AKR.NAD(P)H complex can be quenched by adding increasing amounts of competitive inhibitor or steroid substrate. This occurs when the second ligand or steroid inserts itself between the cofactor and the conserved Trp responsible for energy transfer. In the steady state this can yield a Kd value for the ligand but by monitoring the quenching of the fluorescence in real time one can determine whether a kinetic fluorescence transient forms that can be used to determine whether an isomerization event is involved in the binding of the second ligand. In this experiment the E**.NAD(P)H complex is pre-formed in one syringe and excess substrate or competitive inhibitor is mixed from a second syringe and the decay in the energy transfer band is followed. The use of steroid substrates can be limited in this approach because of turnover. However, often substrate binding can be measured at reduced temperature. The use of reduced temperatures to measure substrate Kd raises the prospect that temperature may affect the size of the kon and koff rate constants to give an incorrect value. To control for this contingency the binding of a competitive inhibitor at the low and normal temperature are measured to ensure that its Kd is unaffected by temperature change.
The equation for a single exponential is then fit to the progress curve to obtain a kobs. A plot of kobs versus steroid concentration should yield the Kd of the E**.NADPH complex for the steroid ligand.
4. Single turnover experiments
Measurements of kcat or kcat/Km do not isolate the chemical step when measured in the steady state. As indicated kcat is a measure of the rate-determining step in an ordered bi bi reaction. When all the enzyme is in the E**.NADPH form, kcat/Km is measure of the binding of the second substrate to form the central complex, the chemistry step and release of the first product. Single turnover experiments can be used to isolate the chemistry step associated with steroid transformation still further. In this experimental system, one syringe contains stoichiometric amounts of enzyme and cofactor so that the enzyme is only capable of one turnover. In the second syringe excess steroid substrate is present. Mixing of the contents of both syringes provides a means for measuring the fluorescence or absorbance change associated with the single turnover event representative of a single molecule of substrate being turned over by a single molecule of enzyme. The equation for a single exponential is fit to the progress curve to yield a kobs. The experiment is repeated with increasing concentrations of steroid and a plot of kobs versus [steroid] should show saturation kinetics and will be hyperbolic and is fitted to the hyperbolic equation [Eq. (6)]:
| (6) |
(where kobs = pseudo-first order rate constant; klim is kchem (limiting rate constant for the chemical step also known as ktrans) and Ks is the Kd for the steroid).
This approach provides an estimate of kchem and Ks. If kchem is equal to or approaches kcat then the rate determining step in the reaction would be the chemical step.
Primary and solvent kinetic isotope effects (KIEs) can be used to determine the slow bond-making and breaking events in an enzymatic reaction and can provide valuable information as to the nature of the transition state. When a bisubstrate reaction is monitored in the steady state, kinetic constants such as Dkcat, Dkcat/Km or D2Okcat, D2Okcat/Km may not provide a KIE if there is another event that is much slower than the chemical event since the KIE will be masked. [In this treatment, Dkcat and Dkcat/Km (is the ratio of kcat or kcat/Km performed with NADPD versus the kcat or kcat/Km performed with NADPH) similarly, D2Okcat, D2Okcat/Km (is the ratio of kcat or kcat/Km performed in D2O versus the kcat or kcat/Km performed in H2O) [19,20]. When the KIE is masked the primary and solvent KIEs may only be revealed under single turnover conditions and in this instance Dkchem and D2Okchem are reported. The difference in energy to cleave the C—H versus the C—D bond predicts a upper limit of a primary KIE of 7.0 when only the chemical step is monitored.
For dehydrogenase reactions, we are interested in hydride donation to the recipient carbonyl which has to be protonated to complete the reaction. There are three formal mechanisms for this reaction [21]. In the first mechanism there is fast hydride transfer and slow protonation which would indicate that an oxyanion transition state exists. There can be slow hydride transfer following initial protonation of the carbonyl suggesting a carbocation transition state exists. Or both events may occur at a similar rate in which case the reaction is concerted, Fig. 5. By performing single turnover experiments using NADPD and D2O and measuring Dkchem and D2Okchem these mechanisms can be distinguished. For the oxyanion mechanism D2Okchem > 2.0 and Dkchem will be >1.0 (there will be asymmetry due to the slow protonation even). For the carbocation mechanism D2Okchem > 1.0 and DKchem will be >2.0 (there will be asymmetry due to the slow hydride transfer event). For the concerted mechanism D2Okchem and Dkchem will be of the same magnitude. When this approach is combined with site-directed mutagenesis of the candidate residue acting as the general acid—base the D2Okchem is expected to be perturbed and can be used to validate the role of that residue.
Fig. 5.

Transition-state intermediates for hydroxysteroid dehydrogenases. Three possible mechanisms are shown with different consequences for KIEs. When hydride transfer occurs first an oxyanion intermediate is expected and will yield a solvent KIE > primary KIE. When protonation occurs first a carbocation intermediate is expected and a primary KIE > solvent KIE. When a concerted mechanism occurs a neutral intermediate is expected and the primary and solvent KIE will be similar.
This approach was applied to the inactivation of DHT catalyzed by type 3 3α-hydroxysteroid dehydrogenase (AKR1C2) which is the major enzyme involved in this process in androgen target tissues. Dkcat and Dkcat/Km gave KIE values of 1.5 and 2.1, respectively revealing that the KIE was becoming elevated as more of the chemical step was isolated. By contrast Dkchem in single turnover experiments was 3.5, indicating a significantly slow hydride transfer step and the possible formation of a carbocation intermediate [22].
5. Multiple turnover experiments
In multiple-turnover experiments one syringe of the stopped-flow contains enzyme and excess NADP (H) and the other syringe contains increasing concentrations of steroid so that multiple turnovers can be captured within the dead-time of the instrument. There are two possible outcomes for the fluorescence or absorbance transient. In one instance a linear decay in the signal is observed where kobs is identical to kss (observed rate in the steady state) and the linear equation is fit to the progress curve (Eq. (3)). With increasing concentrations of steroid, saturation kinetics will be observed and the kobs at saturation should be the same as kcat. In this instance kcat is controlled by the chemical step because no burst is observed. In the other instance, burst-phase kinetics can be observed, where an initial fast event is followed by a slow step. The burst-phase usually reflects a fast chemical event or transformation which is followed by a slow product release step. In this instance the equation for burst-phase kinetics is fit to the progress curve (Eq. (4)). The exponential term is fit to the burst phase and the linear term is fit to the subsequent linear phase. At saturation the kobs(kburst) for the burst-phase is an independent measure of klim or kchem and the kobs for the linear phase should be equal to kss or kcat. The amplitude of the burst-phase can vary depending on how close kchem and kss are in value. When the kburst is an order of magnitude greater than kss the amplitude of the signal is usually equivalent to the concentration of enzyme present (i.e., a full-burst is seen). However, the amplitude of the burst phase will decrease in proportion to other contributing factors that may be rate determining so that only a partial burst is seen (often represented by a curvilinear trace). The contribution of several steps to rate determination is given by the following equation (Eq. (7)):
| (7) |
(where kred = klim for reduction; kpr = steroid product release rate; and kQr = cofactor product release rate).
By substituting the terms generated in the stopped-flow the contribution of each step to rate determination can be revealed (Fig. 6).
Fig. 6.

Single turnover experiments for the reduction of DHT by AKR1C2. Global simulation of progress curves for NADPH dependent (A) and NADPD-dependent (B) single turnover of DHT catalyzed by AKR1C2. Experimental (gray) and simulated (black) progress curves of the decrease in NADPH fluorescence at 450 nm are shown. The samples contained 0.45 μM AKR1C2, 0.4 μM NADPH or NADPD, and 5, 15, and 20 μM DHT (traces from top to bottom). For clarity, data for other concentrations of DHT are not shown but were used in the global fitting. (C) kobs for the individual progress curves observed with increasing DHT using fixed concentrations of NADPH or NADPD were obtained and the hyperbolic equation fit to the kobs. Adapted from reference 15.
Many of the steroid transforming AKR enzymes have more than one substrate and using these approaches it is clear that the turnover of different substrates can have different rate determining steps. This is especially true of AKR1D1 (human steroid 5β-reductase), which has both fast and slow substrates. Fast substrates such as cortisone show burst-phase kinetics under multiple turnover conditions where a fast-chemical step is slowed down by a product release step which places an upper limit on kcat. By contrast slow substrates such as the bile acid precursor 7α-hydroxy-cholest-4-en-3-one which yielded only a linear decay indicating that the chemistry step is rate determining, Fig. 7 [23].
Fig. 7.

Discrimination of fast and slow substrates for AKR1D1 under multiple turnover conditions. For stopped-flow multiple turnover experiments, the enzyme–cofactor solution contained a fixed concentration of AKR1D1 and excess NADPH, and was mixed with excess steroid substrate. A typical reaction contained 2.5 μM AKR1D1, 18 μM NADPH and 25 μM steroid. Either the burst equation (Eq. (4)) or the linear equations (Eq. (3)) were fit to averaged reaction traces from at least three replicates. (A) Averaged progress curves of decreases in NADPH fluorescence for samples containing testosterone (○), cortisone (▽), and aldosterone (△); (B) averaged progress curves of decreases in NADPH fluorescence for samples containing no steroid (⋄), cholestenone (+), or 7α-hydroxycholest-4-en-3-one (×). (C) fitting of the burst-equation to an averaged trace of a cortisone multiple turnover reaction; (D) fitting of the linear equation to an averaged trace of a 7α-hydroxycholest-4-en-3-one multiple turnover reaction. The initial increase in fluorescence signal in the reaction of 7α-hydroxycholest-4-en-3-one was also observed in the sample containing no steroid and was not used in data fitting. Fitted lines are in grey and are mostly superimposed by the actual data points. Residual plots demonstrate the quality of the fit. Reproduced with permission from Portland Press. This Figure was originally published by Y. Jin, M. Chen, and T.M. Penning in the Biochem. J. 462 (2014) 163–171.
A combination of multiple-turnover experiments with alanine scanning mutagenesis is a particularly powerful approach to determine the effects of residues at a steroid binding site on Kd for steroid ligand and kcat. Alanine scanning mutagenesis of the steroid binding site of AKR1C9 where Thr24, Leu54, Phe118, Phe129, Thr226, Trp227, Asn306, and Tyr310 were replaced with alanine showed that these residues had little effect on the Kd for the competitive inhibitor testosterone. By far, the greatest effects were on kcat which was decreased by more than 2 log units, suggesting that the rate-determining step was either altered or slowed significantly. Multiple-turnover experiments for androsterone oxidation showed that while the wild-type enzyme demonstrated burst-phase kinetics consistent with rapid chemistry followed by slow product release, the Trp227Ala and Phe118Ala mutants eliminated the burst phase. Instead, multiple-turnover experiments gave linear kinetics with a kss equal to kcat, indicating that chemistry was now rate-determining. Thus Trp227 and Phe118 were more important in substrate positioning to maintain the reaction trajectory than in determining ligand affinity [24,25]. This is also an example of how multiple turnover reactions can reveal how a single point mutation can change the rate-determining step of a reaction which could not be revealed by measuring kcat alone.
6. Conclusions
The power of transient kinetics using stopped-flow techniques permits different steps along a reaction coordinate to be isolated so that new enzyme intermediates can be revealed and the effects of disease causing mutations and engineered mutations can be dissected with precision. These techniques can be applied to steroid transforming dehydrogenases and double-bond reductases of the AKR family and are transferable to other enzymes involved in steroid biosynthesis and metabolism.
Acknowledgments
This work was supported by NIH grants R01-DK47015 and P30-ES013508 awarded to TMP.
Abbreviations
- AKRs
aldo-keto reductases
- DHT
5α-dihydrotestosterone
- 3α-diol
5α-androstane-3α, 17β-diol
- KIE’s
kinetic isotope effects
- HSDs
hydroxyster-oid dehydrogenases
References
- 1.Briggs GE, Haldane JBS. A note on the kinetics of enzyme action. Biochem J. 1925;19:338–339. doi: 10.1042/bj0190338. [DOI] [PMC free article] [PubMed] [Google Scholar]
- 2.Michealis L, Menten ML. Kinetik der Invertinwirkung. Biochemishches Zietschrift. 1913;49:333–369. [Google Scholar]
- 3.Boehmer AL, Brinkmann AO, Sandkuijl LA, Halley DJ, Niermeijer MF, Andersson S, de Jong FH, Kayserili H, de Vroede MA, Otten BJ, Rouwé CW, Mendonça BB, Rodrigues C, Bode HH, de Ruiter PE, de Waal Delemarre-van HA, Drop SL. 17β-hydroxysteroid dehydrogenase-3 deficiency: diagnosis, phenotypic variability, population genetics, and worldwide distribution of ancient and de novo mutations. J Clin Endocrinol Metab. 1999;84:4713–4721. doi: 10.1210/jcem.84.12.6174. [DOI] [PubMed] [Google Scholar]
- 4.Flück CE, Meyer-Böni M, Pandey AV, Kempná P, Miller WL, Schoenle EJ, Biason-Lauber A. Why boys will be boys: two pathways of fetal testicular androgen biosynthesis are needed for male sexual differentiation. Am J Hum Genetics. 2011;89:201–218. doi: 10.1016/j.ajhg.2011.06.009. [DOI] [PMC free article] [PubMed] [Google Scholar]
- 5.Setchell KD, Suchy FJ, Welsh MB, Zimmer-Nechemias L, Heubi J, Balistreri WF. Δ4-3-oxosteroid 5β-reductase deficiency described in identical twins with neonatal hepatitis. A new inborn error in bile acid synthesis. J Clin Invest. 1988;82:2148–2157. doi: 10.1172/JCI113837. [DOI] [PMC free article] [PubMed] [Google Scholar]
- 6.Simard J, Ricketts ML, Moisan AM, Tardy V, Peter M, Van Vliet G, Morel Y. A new insight into the molecular basis of 3β-hydroxysteroid dehydrogenase deficiency. Endocrine Res. 2000;26:761–770. doi: 10.3109/07435800009048597. [DOI] [PubMed] [Google Scholar]
- 7.Chance B. The accelerated flow method for rapid reactions. J Franklin Inst. 1940;229:455–476. [Google Scholar]
- 8.Chance B. Enzyme-substrate compounds. Adv Enzymol. 1951;12:153–190. doi: 10.1002/9780470122570.ch3. [DOI] [PubMed] [Google Scholar]
- 9.Barshop BA, Wrenn RF, Frieden C. Analysis of numerical methods for computer simulation of kinetic processes: development of KINSIM-a flexible, portable system. Anal Biochem. 1983;130:134–145. doi: 10.1016/0003-2697(83)90660-7. [DOI] [PubMed] [Google Scholar]
- 10.Zimmerle CT, Frieden C. Analysis of progress curves by simulations generated by numerical integration. Biochem J. 1989;258:381–387. doi: 10.1042/bj2580381. [DOI] [PMC free article] [PubMed] [Google Scholar]
- 11.Cooper WC, Jin Y, Penning TM. Elucidation of a complete kinetic mechanism for a mammalian hydroxysteroid dehydrogenase (HSD) and identification of all enzyme forms on the reaction coordinate: the example of rat liver 3α-HSD (AKR1C9) J Biol Chem. 2007;282:33484–33493. doi: 10.1074/jbc.M703414200. [DOI] [PubMed] [Google Scholar]
- 12.Haldane JBS. Enzymes. Longmans Green; London: 1930. [Google Scholar]
- 13.Jez JM, Bennett MJ, Schlegel BP, Lewis M, Penning TM. Comparative anatomy of the aldo-keto reductase superfamily. Biochem J. 1997;326(Pt 3):625–636. doi: 10.1042/bj3260625. [DOI] [PMC free article] [PubMed] [Google Scholar]
- 14.Jez JM, Schlegel BP, Penning TM. Characterization of the substrate binding site in rat liver 3α-hydroxysteroid/dihydrodiol dehydrogenase. The roles of tryptophans in ligand binding and protein fluorescence. J Biol Chem. 1996;271:30190–30198. doi: 10.1074/jbc.271.47.30190. [DOI] [PubMed] [Google Scholar]
- 15.Jin Y, Penning TM. Multiple steps determine the overall rate of the reduction of 5α-dihydrotestosterone catalyzed by human type 3 3α-hydroxysteroid dehydrogenase: implications for the elimination of androgens. Biochemistry. 2006;45:13054–13063. doi: 10.1021/bi060591r. [DOI] [PMC free article] [PubMed] [Google Scholar]
- 16.Ratnam K, Ma H, Penning TM. The arginine 276 anchor for NADP(H) dictates fluorescence kinetic transients in 3α-hydroxysteroid dehydrogenase, a representative aldo-keto reductase. Biochemistry. 1999;38:7856–7864. doi: 10.1021/bi982838t. [DOI] [PubMed] [Google Scholar]
- 17.Chen M, Jin Y, Penning TM. In depth dissection of the P133R mutation in steroid 5β-reductase (AKR 1D1): a molecular basis of bile acid deficiency. Biochemistry. 2015;54:6343–6351. doi: 10.1021/acs.biochem.5b00816. [DOI] [PMC free article] [PubMed] [Google Scholar]
- 18.Drury JE, Mindnich R, Penning TM. Characterization of disease-related 5β-reductase (AKR1D1) mutations reveals their potential to cause bile acid deficiency. J Biol Chem. 2010;285:24529–24537. doi: 10.1074/jbc.M110.127779. [DOI] [PMC free article] [PubMed] [Google Scholar]
- 19.Northrop DB. Determining the absolute magnitude of hydrogen isotope effects. In: Cleland WW, O’Leary M, Northrop DB, editors. Isotope Effects on Enzyme-Catalyzed Reactions. University Park Press; Baltimore, MD: 1977. pp. 122–152. [Google Scholar]
- 20.Northrop DB. Uses of isotope effects in the study of enzymes. Methods. 2001;24:117–124. doi: 10.1006/meth.2001.1173. [DOI] [PubMed] [Google Scholar]
- 21.Akhtar M, Wilton DC, Watkinson IA, Rahimtula AD. Substrate activation in pyridine nucleotide-linked reactions: illustrations from the steroid field. Proc R Soc Lond B Biol Sci. 1972;180:167–177. doi: 10.1098/rspb.1972.0012. [DOI] [PubMed] [Google Scholar]
- 22.Heredia VV, Penning TM. Dissection of the physiological interconversion of 5α-DHT and 3α-diol by rat 3α-HSD via transient kinetics shows that the chemical step is rate-determining: effect of mutating cofactor and substrate-binding pocket residues on catalysis. Biochemistry. 2004;43:12028–12037. doi: 10.1021/bi0489762. [DOI] [PubMed] [Google Scholar]
- 23.Jin Y, Chen M, Penning TM. Rate of steroid double-bond reduction catalysed by the human steroid 5β-reductase (AKR1D1) is sensitive to steroid structure: implications for steroid metabolism and bile acid synthesis. Biochem J. 2014;462:163–171. doi: 10.1042/BJ20140220. [DOI] [PMC free article] [PubMed] [Google Scholar]
- 24.Heredia VV, Cooper WC, Kruger RG, Jin Y, Penning TM. Alanine scanning mutagenesis of the testosterone binding site of rat 3α-hydroxysteroid dehydrogenase demonstrates contact residues influence the rate-determining step. Biochemistry. 2004;43:5832–5841. doi: 10.1021/bi0499563. [DOI] [PubMed] [Google Scholar]
- 25.Heredia VV, Kruger RG, Penning TM. Steroid-binding site residues dictate optimal substrate positioning in rat 3α-hydroxysteroid dehydrogenase (3α-HSD or AKR1C9) Chem Biol Interact. 2003;143–144:393–400. doi: 10.1016/s0009-2797(02)00176-x. [DOI] [PubMed] [Google Scholar]