

Abstract
Background and Purpose
The resistance of CA3 neurons to ischaemia and the ischaemic tolerance conferred by ischaemic preconditioning (IPC) are two well‐established endogenous neuroprotective mechanisms. Elucidating the molecules involved may help us find new therapeutic targets. Thus, we determined whether dynamin‐related protein 1 (Drp‐1) is involved in these processes.
Experimental Approach
In vivo, we subjected rats to either 10 min severe global ischaemia using a four‐vessel occlusion (4‐VO) model or 2 min IPC before the onset of 4‐VO. In vitro, we performed oxygen glucose deprivation (OGD) studies in rat hippocampal neurons. Drp‐1 was silenced or inhibited by siRNA or pharmacological inhibitor Mdivi1. To assess whether mitochondrial Drp‐1 alters neuronal vulnerability to ischaemic injury, various approaches were used including western blot, immunohistochemistry, immunofluorescence staining and electron microscopy. Hippocampal function was assessed using an open‐field test.
Key Results
Mitochondrial dynamin‐related protein 1 (mtDrp‐1) was selectively induced by ischaemia in hippocampal CA3 neurons. In hippocampal CA1 neurons, mtDrp‐1 was not affected by ischaemia but significantly up‐regulated by IPC. Suppression of Drp‐1 increased the vulnerability of cells to OGD and global ischaemia. Inhibition of Drp‐1 in vivo resulted in loss of acquisition and encoding of spatial information, and also prevented ischaemia‐induced mitophagy in CA3. Thus mitochondrial‐mediated injury was amplified and resistance to ischaemic injury lost.
Conclusions and Implications
Our findings that Drp‐1 increases the resistance of neurons of hippocampal CA3 affected by global ischaemia and contributes to the tolerance conferred by IPC highlight Drp‐1 as a potential therapeutic target for brain ischaemic stroke.
Abbreviations
- CCA
common carotid arteries
- Drp‐1
dynamin‐related protein 1
- H/I
hypoxia/ischaemia
- IPC
ischaemic preconditioning
- mtDrp‐1
mitochondrial Drp‐1
- OGD
oxygen glucose deprivation
- 4‐VO
four‐vessel occlusion
Tables of Links
| TARGETS | |
|---|---|
| VDAC1 |
| LIGANDS | |
|---|---|
| Cyclosporin A | Glutamate |
| Cytarabine | Malate |
These Tables list key protein targets and ligands in this article which are hyperlinked to corresponding entries in http://www.guidetopharmacology.org, the common portal for data from the IUPHAR/BPS Guide to PHARMACOLOGY (Pawson et al., 2014) and are permanently archived in the Concise Guide to PHARMACOLOGY 2015/16 (Alexander et al., 2015).
Introduction
Brain ischaemia is the third leading cause of death and the first leading cause of disability worldwide (van der Worp and van Gijn, 2007). In the past decades, numerous neuroprotective evidence and related agents were found in animal models but failed in clinical trials. The commonly used thrombolytic treatment is limited in therapeutic window. Nevertheless, regardless of the past failures, there is an unmet need to identify novel molecular targets that are suitable for translation to efficacious therapies for ischaemic stroke. We hypothesized that understanding the mechanisms of endogenous neuroprotection, those contributing to the resistance of CA3 hippocampal neurons to global ischaemia and the tolerance conferred by ischaemic preconditioning (IPC), would help us find new neuroprotective molecules.
Mitochondrial dysfunction is well‐established in cerebral ischaemia. Mitochondria play a key role in various cell processes including ATP production, Ca2 + homeostasis, ROS generation and apoptosis. Neurons are particularly vulnerable to ischaemia for high‐energy utility. It seems reasonable to hypothesize resistance of neurons to ischaemia is dependent on their ability to maintain mitochondrial homeostasis such as timely clearing the dysfunctional mitochondria. The traditional opinion that mitochondria are static organelles has recently changed (Goldenthal and Marin‐Garcia, 2004). Mitochondria are now recognized as dynamic organelles constantly going through fission, fusion, biogenesis and selective degradation (Anne et al., 2013). Thus, we propose that these organelles' dynamics may exert a major influence on cell survival. The main controller of mitochondrial fission is a member of the dynamin family of GTPases named dynamin‐related protein‐1 (Drp‐1), which led to mitochondrial fission when it was translocated from the cytosol to the outer membrane of mitochondria (Detmer and Chan, 2007). In contrast, mitofusin (Mfn‐1) and optic atrophy‐1 (OPA‐1) are essential for mitochondrial outer or inner membrane fusion respectively. The main effect of mitochondrial fusion is to allow the complementation and mixing of the contents of two mitochondrian. Mitochondrial fusion decreases content heterogeneity, which protects against dysfunction. However, the main purpose of fusion is to create unequal daughter units, thus to concentrate undesirable material in a minimal number of units. These injured mitochondria are consequently isolated due to their lack of fusion proteins. In some cases, the abnormal proteins can be degraded through ubiquitylation. In certain cases mitochondrial units can also be cleared by autophagy, but this does not apply to individual proteins. Now it is widely recognized that the steady‐state of the fission and fusion processes is responsible for many pathophysiological conditions such as neurodegeneration (Terry et al., 1991), cell death (Frank et al., 2001; Karbowski et al., 2004), metabolism (Pitts et al., 1999; Schrader, 2006; Motley and Hettema, 2007) and mitochondrial degradation (Twig et al., 2008). In a previous study, we demonstrated that translocation of Drp‐1 to the mitochondrial membrane was enhanced transiently in the cortex after ischaemic stress, and this is required for the elimination of damaged mitochondria through mitophagy (Zuo et al., 2014). Timely clearance of the damaged mitochondria could avoid the consequences of mitochondria‐mediated injury such as ROS generation, Ca2 + overload and apoptosis. Thus, it should be possible to target the damaged mitochondria as a whole by controlling Drp‐1‐mediated mitophagy. However, a further study was needed to broaden our understanding of the role of Drp‐1 in ischaemic injury, such as its exact temporal and spatial expressions in different regions of the hippocampus after ischaemic injury and whether it is involved in endogenous neuroprotective mechanisms. Therefore, the aim of this study was to investigate whether Drp‐1 is involved in the resistance of CA3 neurons to global ischaemia and the tolerance conferred by IPC.
Methods
Animals
Three hundred and sixty‐five male Sprague–Dawley rats weighing 260 to 280 g and 30 newborn male SD rats (all within 24 h of their birth) were all provided by Vital River (Beijing, China). All animal procedures were approved by the Institutional Animal Care and Use Committee of the Peking Union Medical College and Chinese Academy of Medical Sciences, and were in accordance with the principles outlined in the NIH Guide for the Care and Use of Laboratory Animals. Animals were divided randomly into different groups according to a random number table, and all the animal experiments were double‐blind. Investigators responsible for the behavioural monitoring and data processing knew nothing about the group assignment. Animal studies are reported in compliance with the ARRIVE guidelines (Kilkenny et al., 2010; McGrath & Lilley, 2015).
Global ischaemia
Rats were subjected to either 10 min ischaemia or to 2 min sub‐lethal IPC, followed by 72 h of reperfusion and 10 min ischaemia and 72 h of reperfusion using a 4‐VO method (Pulsinelli and Buchan, 1988). Rats were anaesthetized with 1.75% enflurane in 70% nitrous oxide and 30% oxygen. Common carotid arteries (CCA) were dissected and exposed gently, and a nylon thread was loosely placed around both of them. Both vertebral arteries were occluded by electrocauterization with a 0.5 mm diameter needle through the foramen of the first cervical vertebra. On the next day, rats were anaesthetized briefly, and both CCA were temporarily ligated by microvascular clips for 10 min of ischaemia. Reperfusion was started by carefully removing both clips. Within 10 s of both CCA being clamped, rats showed complete loss of consciousness, loss of righting and corneal reflex, and loss of tail and foot pad response. IPC was conducted by blocking both CCA for 2 min before the onset of 4‐VO as described above. Sham‐operated rats underwent the same surgical procedure except with no electrocauterization or ligation of blood vessels. Core body temperatures were monitored by a rectal probe connected to a feedback‐controlling heating pad and maintained at 36.5–37.5°C during the whole experiment. For sham ischaemia and sham IPC, the rats were subjected to the same procedures, except the occlusion of the CCA. The rats were anaesthetized with 10% chloral hydrate (3.5 mL·kg−1) and then killed by decapitation immediately after 10 min of ischaemia or 12 h, 24 h or 7 days after reperfusion. During the establishment of the model, rats that showed convulsions or sustained consciousness disturbances were excluded from subsequent experiments. The mortality rate was about 15% within 24 h and 25–30% within 3 days. After 3 days of reperfusion, there were no further deaths. In healthy animals, no deaths occurred after treatment with Mdivi1. After global ischaemic injury, the average mortality rate was higher in the Mdivi1‐treated group (20–25%) than the vehicle group (15%) within 24 h but the differences were not siginificant.
Cell culture and OGD
Primary rat hippocampal neurons were obtained from the brains of newborn SD rats within 24 h and plated in poly‐l‐lysine (0.1 mg·mL−1) coated chamber slides or plates with neurobasal medium containing 2% B27, 2 mM glutamine, 100 U·mL−1 penicillin and 100 μg·mL−1 streptomycin (Invitrogen, Waltham, MA, USA) at 37°C in a humidified atmosphere of 5% CO2 and 95% air atmosphere. Two days later, 10 μg·mL−1 of cytarabine were added to the culture for 48 h to inhibit glial cells. Transfection was carried out after 7 days in vitro. Oxygen glucose deprivation (OGD) was established by plating the cells in an incubator within an anaerobic chamber at 37°C with a controlled atmosphere of 5% CO2, 85% N2 and 10% H2 (Goldberg and Choi, 1993). The standard medium was replaced by glucose and serum‐free basic salt solution (BSS, 5 mmol·L−1 KCl, 120 mmol·L−1 NaCl, 1.2 mmol·L−1 CaCl2, 1.1 mmol·L−1 KH2PO4, 20 mmol·L−1 Na2CO3 and 1.2 mmol·L−1 MgSO4). Before use BSS was deoxygenated by stirring overnight in the anaerobic chamber. Three hours later, the cells were placed back into their previous, normal incubator and were treated with standard medium for 24 h of recovery.
Treatments
The first dose of Mdivi1 [1 mg·kg−1 BW, i.p., Sigma (St. Louis, MO, USA)] was given before the onset of IPC and then it was given once daily until the rats were killed. In vitro transfection with Drp‐1 siRNA (GenePharma, Shanghai, China) was performed 48 h before OGD. Briefly, Lipo2000 (Invitrogen) and Drp‐1 siRNA or non‐functional mutant siRNA were dissolved in Optimem I (Invitrogen) separately and equilibrated for 10 min. Then the respective volume of Lipo2000 were added in each solution and mixed for 20 min at room temperature for siRNA liposomes formation. Subsequently, the mixture was added to the culture medium (antibiotic‐free) adjusting the final concentration to 60 or 80 nM RNA separately. Transfection with Mfn‐2 siRNA (sc‐156013) was performed as described above.
Immunobloting
Brain tissues were microdissected under a surgical microscope, and the CA1 and CA3 areas were separated according to their visual boundaries. We homogenized tissues in lysis buffer containing 1 mM PMSF and protease inhibitor cocktail. Then we centrifuged the homogenates at 12 000 g for 30 min at 4°C. We precipitated cytoplasmic/mitochondrial fractions or whole‐cell homogenates (50 μg), which were separated by SDS‐PAGE, and then transferred to PVDF membranes (Millipore, Temecula, CA, USA). After being blocked for 2 h in Tris‐buffered saline with 0.1% Tween‐20 (TBST) and 3% BSA, membranes were incubated with primary antibodies in TBST supplemented with 3% BSA overnight at 4°C. Then the membranes were washed three times with TBST and incubated with secondary antibodies for 2 h at room temperature. Primary antibodies used were anti‐Drp‐1 [1:1000, santa cruz (Dallas, TX, USA), 32898], anti‐COX4 [1:1000, Abcam (Cambridge, UK), 14744], anti‐LC3 (1:1000, Sigma, L7543), anti‐P62 (1:1000, Abcam, 56416), anti‐TIM23 (1:1000, santa cruz, 13298), anti‐VDAC1 (1:1000, santa cruz), anti‐peroxisome proliferator‐activated receptor‐γ coactivator‐1α (PGC‐1a, 1:1000, santa cruz, 13067), anti‐mitochondrial transcription factor A (mtTFA, 1:500, santa cruz, 376672), anti‐β‐actin (1:1000, sigma). HRP‐conjugated goat anti‐rat IgG and goat anti‐rabbit IgG were used as secondary antibodies at a concentration of 1:5000 (KPL, Gaithersburg, MD, USA). Lastly, we developed immunoreactive assays by using enhanced chemoluminescence (Polygen, Beijing, China), quantified by Gel‐Pro Analyzer software (Media Cybernetics, Rockville, MD, USA). For this test, four rats were used in each group.
Electron microcopy
EM was performed with a conventional osmium‐uranyl‐lead approach as previously described (Jasinska et al., 2006). Briefly, coronal brain sections were cut into small blocks at a thickness of 1 mm3 at hippocampal level after 24 h of reperfusion. The brain blocks were fixed with 2.5% glutaraldehyde for 2 h, and then postfixed with 1% osmium tetroxide for 2 h. After completely rinsing with double distilled water, brain blocks were dehydrated in a serious of ascending concentrations of ethanol, and then embedded in Epon. Randomly selected sections were stained with 3% lead citrate and examined with a transmission EM (H‐7650, Hitachi, Tokyo, Japan). Quantitative analyses were conducted in CA1/CA3 sections from each group (n = 5). For each sample, 15 randomly selected microscopic vision fields were taken. For this test, five rats were used in each group.
Nissl staining
Rats were killed after 24 h of reperfusion. We cut coronal sections of paraffin‐embedded brains into 4 μm slices at the hippocampal level (Pulsinelli and Brierley, 1979). Six sections per rat were stained with a solution consisting of 1% cresyl violet in 0.25% acetic acid for 15 min, rinsed, dehydrated and mounted with neutral balsam. The number of surviving pyramidal neurons per 200 μm liner length of the medial CA1 and CA3 pyramidal cell layer was counted bilaterally in six sections per animal under a light microscope. Cell counts from the left and right hippocampus on each of the six sections were averaged to provide a single value for each animal. For this test, six rats were used in each group.
Cell viability assays
We analysed cell viability in primary hippocampal neurons by LDH release quantification kit and by PI and Hoechst 33342 double staining kit (Nanjing Jiancheng Bioengineering Institute, Jiangsu, China).
For the LDH assay, the conditioned medium of primary cultures with different treatments was collected and measured by a LDH kit. The data were obtained under 440 nm by a microplate reader (Multiscan Go, Thermo, Waltham, MA, USA). The data are presented as a percentage of the LDH released in the primary culture medium to the overall LDH.
For the detection of necrotic/apoptotic cells caused by OGD, a Hoechst 33342/PI‐double staining assay was conducted. Primary cell cultures were double‐stained with 1.5 μM PI and 8 μM Hoechst 33342 for 20 min at 37°C, and then washed twice with medium. Images were captured and PI‐positive cells were counted under a fluorescence microscope at a magnification of 100× (Olympus, Tokyo, Japan). The results are presented as a ratio of PI‐positive cells to the total cell number. At least 400 cells per well were counted for each treatment group (n = 3).
Open‐field test
This test was performed blind as previously described (Jiang et al., 2008; Papadakis et al., 2013). The rearing performance of rats as well as boxes crossed at baseline was tested to make sure there was no significant difference between groups prior to further treatments. The rats were divided randomly into different treatment groups according to a random number table. The open‐field apparatus was a 60 × 100 cm black wooden box with walls 18 cm high. The bottom was divided into 15 squares of the same size. The activity of each rat was recorded for 3 min. The numbers of squares crossed and rears performed were counted and recorded in a blinded manner. Time points for test: the first was baseline, the second was immediately before the surgical treatment and the third was 7 days after ischaemia. For this test, 15 rats were used in each group.
Immunohistochemistry
As previously described, a series of 4 μm slices at hippocampal level were prepared. After deparaffinization in dimethyl benzene and rehydration by ethanol at graded concentrations, slices were incubated in 1 mM citrate buffer for antigen retrieval by microwave. After being blocked with 10% (v v‐1) donkey serum in PBS for 1 h at 37°C, we incubated the slices with the primary antibodies overnight at 4°C, followed by Alexa Flour 594‐conjugated and Alexa Flour 488‐conjugated donkey secondary antibodies. The fluorescence was detected with fluorescent microscopy (Eclipse TE2000e).
To visualize mitophagy in primary cells, cultures were incubated in 100 nmol anti‐LC3 (1:100) and Mitotracker Green FM (Beyotime Institute of Biotechnology, Jiangsu, China) at 37°C for 30 min, then 594‐conjugated donkey anti‐mouse secondary antibody (1:200) was added and the samples incubated for 1 h at room temperature. The secondary antibody was removed and replaced by fresh medium. The images for mitophagy were captured with a fluorescence microscope.
Measurement of mitochondrial ROS
ROS generation was determined by using a membrane‐permeable probe 2',7'‐dichlorofluorescin diacetate (DCFH‐DA, Sigma). Forty micrograms of mitochondrial proteins for each sample were incubated together with 200 μL of DCFH‐DA buffer (20 mM MOPS, 250 mM sucrose, 10 mM Tris, 0.5 mM Mg2 +, 0.1 mM Pi(K+), 1.0 mM cyclosporin A and 10 mM DCFH‐DA, pH 7.0, 50 μM EGTA). One hour later, malate and glutamate were added. Fluorescence of each sample was measured under a 488 nm excitation wavelength and a 525 nm emission wavelength. For this test, four rats were used in each group.
Statistical analysis
Data are presented as mean ± SEM. Statistical analyses were carried out with graphpad prism 5. For comparison between two groups, a two‐tailed Student's t‐test was used. For comparisons among multiple groups, one‐way ANOVA followed by Bonferroni's post hoc test was used if F achieved P < 0.05. P < 0.05 was considered significant. There is a limitation in this study in that the formal sample size calculations were not carried out. In some circumstances, changes were calculated against the mean value of control (sham) and expressed as fold increase over it. The data and statistical analysis comply with the recommendations on experimental design and analysis in pharmacology (Curtis et al., 2015).
Results
Temporal and spatial expression of Drp‐1
We examined the expression of fission‐related protein and fusion‐related protein. First, we investigated the temporal profile of Drp‐1 expression within CA1 and CA3 after ischaemia in cytosolic/mitochondrial membrane subfractions. In sham rats, Drp‐1 expression was similar between CA1 and CA3 (Figure 1A). In CA1 regions, Drp‐1 expression was unaffected in the cytosol and mitochondria after ischaemia compared with sham groups (Figure 1B). While in CA3, translocation of Drp‐1 from the cytoplasm to the mitochondrial membrane was increased after 10 min of ischaemia and remaining elevated after 24 h of reperfusion compared with sham groups (Figure 1C). From the results, we could see that the translocation of Drp‐1 to mitochondrial membrane was up‐regulated in the CA1 region of rats that had been subjected to 2 min of IPC (Figure 1D). Next, we investigated the temporal profile of Mfn‐1 and OPA1 expressions within CA1 and CA3 after ischaemia in mitochondrial subfractions. From the results, we could see there were no significant differences temporally between CA1 and CA3 (Figure 1E–G).
Figure 1.
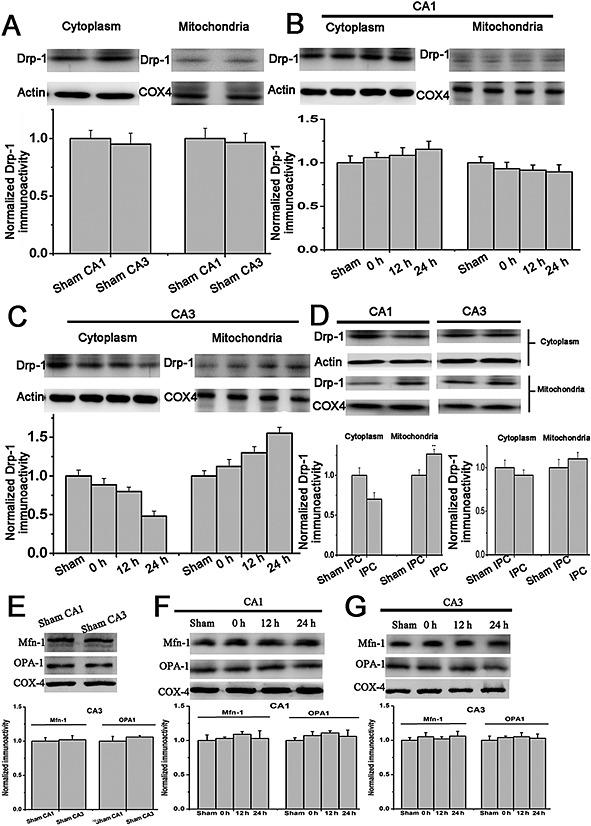
Expression of Drp‐1 in hippocampus after 10 min of global ischaemia or IPC. Drp‐1 in cytosolic/mitochondrial subfractions from rats subjected to (A) sham operation in CA1 and CA3 areas, (B) (C) 10 min of global ischaemia and 0, 12 or 24 h reperfusion in CA1 and CA3 areas, (D) sham IPC or 2 min of IPC, followed by 72 h reperfusion, 10 min global ischaemia and then 24 h reperfusion. (E) (F) (G) Time course of mitochondrial fusion‐related protein (Mfn‐1 and OPA‐1) expression in CA1 and CA3 before or after global ischaemia. n = 4. Data are presented as mean ± SEM.
The role of Drp‐1 in vulnerability of neuron to OGD‐induced death in vitro
To investigate whether Drp‐1 played a role in neuronal susceptibility to ischaemia, we subjected primary hippocampal neurons to OGD. Drp‐1 expression was silenced using siRNA (Figure 2A). The cultures transfected with a Drp‐1 siRNA or a scrambled siRNA were then subjected to 3 h OGD and 24 h recovery. The OGD‐induced damage of primary hippocampal neurons was measured by LDH, which is an indicator of cell damage. The release of LDH in Drp‐1 siRNA‐transfected cell was significantly higher than that in control (P < 0.05; Figure 2A). The PI and Hoechst double staining assay further revealed that in Drp‐1 siRNA‐transfected cell cultures death was 33.91 ± 5.1% higher than in control ones (P < 0.05; Figure 2B).
Figure 2.
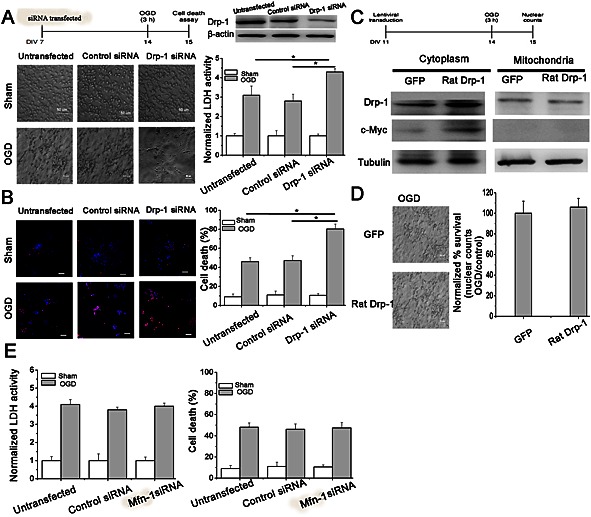
Drp‐1 is responsible for the susceptibility of hippocampal neurons to OGD injury. Cells were untransfected, transfected with scrambled siRNA or Drp‐1 siRNA. (A) (B) Quantification of cell injury was measured by LDH activity or PI staining. n = 10. One‐way ANOVA followed by Bonferroni's post hoc test. * P < 0.05. Bar = 50 μm. Cells were transduced with GFP or Myc‐tagged Drp‐1. (C) Quantification of Drp‐1 expression in cytoplasm and mitochondria. (D) Quantification of cell injury by nuclear counts. n = 10. Two‐tailed t‐test. Data are presented as mean ± SEM. (E) Quantification of cell injury was measured by LDH activity or PI staining after inhibition of Mfn‐2. n = 10. One‐way ANOVA followed by Bonferroni's post hoc test.
As neurons showed more susceptibility to OGD after Drp‐1 suppression, we further carried out studies to see whether Drp‐1 was sufficient to protect cells from ischaemia. Drp‐1 was overexpressed in primary hippocampal neurons using a lentiviral vector expressing rat Drp‐1‐GFP. Transduction efficiency was about 50% (Figure 2C). Hippocampal neurons overexpressing Drp‐1 showed similar resistance to OGD compared with sham neurons (Figure 2D). This might be because the overexpression of Drp‐1 could not induce higher translocation of Drp‐1 to mitochondria even though the overall expression was increased (Figure 2C). From these results, we proposed that the mitochondrial Drp‐1 is neuroprotective.
Drp‐1‐mediated mitochondrial fission. Is there something special about Drp‐1 or would just fragmenting mitochondria be sufficient to have the same benefit? Does forcing mitochondria to fission (by inhibiting Mfn‐1, which is responsible for mitochondrial fusion) affect neuronal survival in these ischaemia assays? To solve this problem, we silenced Mfn‐1 by siRNA. From the results, we could see that inhibiting Mfn‐1‐mediated mitochondrial fusion has no effect on neuronal survival against OGD indicating there was something special about the Drp‐1‐mediated neuroprotective role (Figure 2E).
The role of Drp‐1 in resistance of neurons to ischaemia in vivo
To further confirm our findings in vivo, we used Mdivi1, a mitochondrial fission inhibitor, to block the translocation of Drp‐1 to the mitochondrial membrane. Mitochondrial membrane Drp‐1 was significantly reduced in hippocampal tissues (Figure 3A, P < 0.05). After ischaemia, the number of surviving neurons in the CA1 region was significantly decreased while the remaining neurons were morphologically abnormal; they exhibited karyopyknosis, anachromasis, a lack of nucleoli and vacuolization. However, the number of neurons in the CA3 region was not affected indicating their resistance. However, after inhibiting Drp‐1 by Mdivi1, we observed a drastically decreased number of neurons in the CA3, which further confirmed the role of mitochondrial Drp‐1 in CA3 neuronal resistance to ischaemia (Figure 3B, P < 0.05). Similarly, the number of neurons in the CA1 region was significantly increased after IPC. However, after treatment with Mdivi1, we observed significantly decreased neuronal numbers in both the CA1 and CA3 regions (Figure 3D, P < 0.05).
Figure 3.
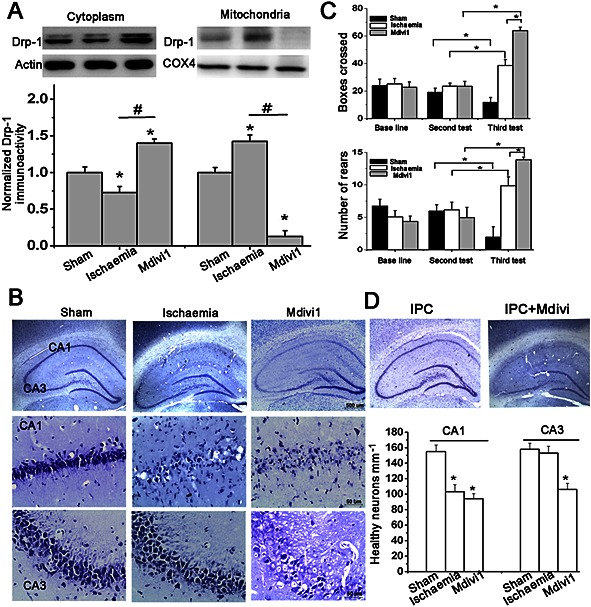
Resistance of CA3 hippocampal neurons is attributed to mitochondrial outer membrane Drp‐1 in vivo. (A) Suppression efficiency of Mdivi1 was quantified by immunoblots. n = 4. (B) Representative images by Nissl staining in hippocampus and quantification of healthy neurons mm‐1 in CA1 and CA3 regions. n = 6. Bar = 50 or 500 μm. One‐way ANOVA followed by Bonferroni's post hoc test. * P < 0.05, versus sham. # P < 0.05 versus ischaemia model. (C) Quantification of number of rears performed and boxes crossed in an open‐field test. n = 15. (D) Representative images by Nissl staining in hippocampus from rats subjected to IPC treated with Mdivi1 or not. Two‐way ANOVA followed by Bonferroni's post hoc test. * P < 0.05 versus sham. Data are presented as mean ± SEM.
An open‐field test was performed as hippocampal CA3 neurons are involved in the acquisition and encoding of spatial information (Kesner, 2007). After repeated testing, we observed a significant decrease in the activity of the sham groups but an increased number of both boxes crossed and rears performed was observed in the ischaemia model groups indicating a loss of habituation (Figure 3C), which is consistent with the extent of neuronal loss in the pyramidal layer of the hippocampus (Mileson and Schwartz, 1991; Papadakis et al., 2013). Mdivi1‐treated rats showed a marked enhancement in both tests compared with the vehicle‐treated ischaemia model groups (P < 0.05), suggesting that the loss of hippocampal CA3 neurons (Nissl staining) contributed to their enhanced locomotor activity and loss of habituation.
The role of Drp‐1 and mitophagy
To investigate the role of mitophagy in Drp‐1‐mediated resistance of CA3 hippocampal neurons, we measured the amount of mitochondria undergoing autophagy. In the immunofluorescence assay, only the mitochondria (stained for COX4) surrounded by LC3 puncta (autophagic vesicles) were identified as undergoing mitophagy (Geisler et al., 2010). We observed a significant increase in the colocalization of COX4 and LC3 puncta in the CA3 of the ischaemia model groups, but a marked decrease in this colocalization in the Mdivi1 treated groups. (Figure 4A, P < 0.05). Interestingly, the level of LC3B and p62 was not changed after Drp‐1 suppression compared with ischaemia model groups (Figure 4B) indicating that Drp‐1 may mediate mitophagy by recruiting autophagic factors to the mitochondria instead of increasing the overall autophagy. Under EM, sham rats showed mitochondria with clear and complete double membrane and crista structures (Figure 4C). In the ischaemia model groups, we observed damaged mitochondria with vague cristae and onion structures within CA1 (Figure 4C, arrows head), but numerous autophagosomes enclosing mitochondria within CA3 (Figure 4C, arrows). However, mitophagy disappeared after treatment with Mdivi1 (Figure 4C, stars).
Figure 4.
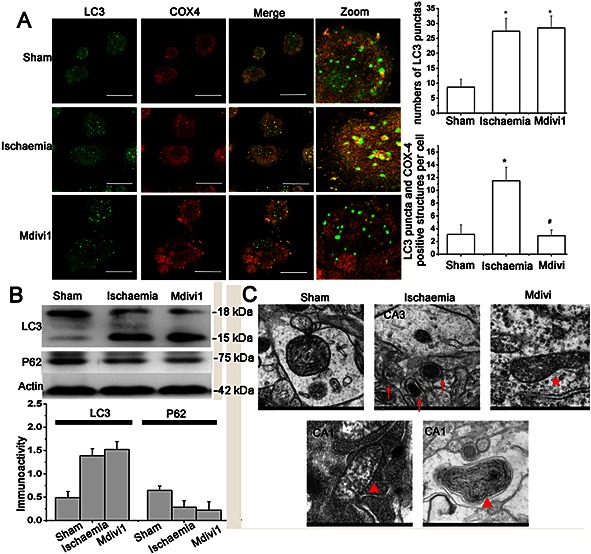
Drp‐1 contributes to neuronal survival by inducing mitophagy. (A) Representative double staining images and quantification of bulk autophagy/mitophagy level in CA3. n = 6 (at least 100 cells counted for each experiment). Bar = 50 μm. One‐way ANOVA followed by Bonferroni's post hoc test. * P < 0.05 versus sham. # P < 0.05 versus ischaemia model. (B) Immunoblot and quantitative analysis of LC3 and p62 expression after 10 min ischaemia followed by 24 h reperfusion. n = 4. (C) Representative EM images of mitochondria. Arrows: autophagosome with mitochondria; Arrow heads: hyperdense membranous material and onion‐like layers; Stars: larger diameter mitochondria. Bar = 500 μm. n = 5. Data were presented as mean ± SEM.
The role of Drp‐1‐mediated mitophagy in mitochondrial damage
In vitro, the mitophagy was detected by Mitotracker Green FM (independently of the transmembrane potential) and LC3 after 24 h reperfusion of 3 h OGD. Most of the hippocampal cells transfected with Drp‐1 siRNA showed a regular mitochondrial reticulum; however, in the ischaemia model group that had been transfected with scramble siRNAs, half of the cells showed fragmented mitochondria (Figure 5A, insert). In the Drp‐1 siRNAs transfected cells, mitophagy was significantly decreased, as the colocalization of LC3 puncta and Mitotracker Green FM was decreased (Figure 5A, zoom, 5B, P < 0.05). We then examined whether mitochondrial accumulation was increased after silencing Drp‐1 in CA3. The level of mitochondrial proteins including the outer membrane protein VDAC1 and inner membrane protein TIM23 were quantified. The overall mitochondrial proteins were enhanced in samples transfected with Drp‐1 siRNAs (Figure 5C, D), while the expressions of the mitochondrial biogenesis marker proteins PGC‐1a and mtTFA were not changed (Figure 5C, D). These results show that inhibiting Drp‐1 led to an increased accumulation of mitochondria, which was induced by blocking mitophagy but not promoting biogenesis.
Figure 5.
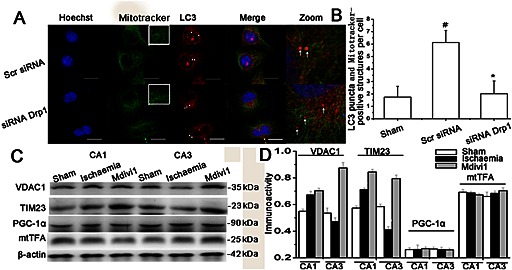
The effect of Drp‐1‐mediated mitophagy on mitochondrial mass. (A) Primary hippocampal cells untransfected, transfected with scrambled siRNA or Drp‐1 siRNA were double‐stained by LC3 and Mitotracker Green FM to observe mitophagy and mitochondria. (B) Mitotracker Green FM‐positive mitochondria with spherical or rod‐like morphology were considered as fragmented mitochondria. The extent of mitophagy was measured by counting the number of Mitotracker Green FM‐positive mitochondria encapsulated with LC3 puncta‐positive structures per cell. The results are shown as mean per cell ± SEM. (n ≥ 30 cells). Bar = 20 μm. one‐way ANOVA followed by Turkey test. # P < 0.05 versus sham; * P < 0.05 versus ischaemia model group. (C) Western blot and (D) quantitative analysis of mitochondrial membrane proteins (TIM23 and VDAC1) and mitochondrial biogenesis‐related proteins (PGC‐1a and mtTFA). Data are presented as mean ± SEM, n = 3.
In accord with this, we found that the release of cyt‐c and the generation of ROS were increased in hippocampal CA1, but there were no changes in the CA3 of the ischaemia model group. However, after treatment with Mdivi1, the accumulation of injured mitochondria led to an enhanced release of cyt‐c (Figure 6A) and generation of ROS both in the CA1 and CA3, and especially the CA3 region (Figure 6B). Thus, Drp‐1‐mediated neuroprotection against ischaemia may contribute to mitophagy that aptly removes the dysfunctional mitochondria.
Figure 6.
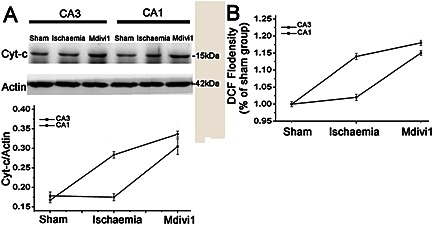
The role of Drp‐1 in mitochondria‐mediated injury after ischaemia. Quantification of (A) cyt‐c expression and (B) ROS generation with or without treatment with Mdivi1. n = 4. Data are presented as mean ± SEM.
Discussion
Global ischaemia and reperfusion injury can be induced by sudden cessation of heartbeat and cardiac function, during which process CA1 hippocampal cells are especially vulnerable and die (Petito et al., 1987), while CA3 neurons next to the CA1 survive as they are more resistant (Kirino, 1982). In addition to this endogenous neuroprotection, the cellular and subcellular mechanisms that support IPC as a neuroprotective approach are also much better understood today. Although numerous studies have been taken, many of the signalling pathways and interactions among the pathways remain unclear (Chen et al., 1996; Gidday, 2006; Ouyang et al., 2007; Sun et al., 2009). In our previous study, we found that mitochondrial fission was induced transiently in response to hypoxia/ischaemia (H/I) in the cortex, followed by a decrease in fission and accumulation of damaged mitochondria (Zuo et al., 2014). The transient mitochondrial fission mediated by Drp‐1 might be a spontaneous reaction to H/I, which was not sufficient to protect against the injury in the short‐term. We proposed that Drp‐1 is involved in the endogenous neuroprotective mechanism. Thus, in the present study, we investigated whether Drp‐1‐mediated mitochondrial fission contributes to the resistance of CA3 cells to global ischaemia and/or is involved in the cellular protection conferred by IPC. The results showed that despite the spatial expression of Drp‐1 being similar in CA1 and CA3 regions in sham rats, the translocation of Drp‐1 to the outer membrane of mitochondria in the CA3 was increased in response to global ischaemia showing a different expression profile to CA1. These observations were in accordance with the opinion that Drp‐1 has a role after translocating to the outer membrane of mitochondria (Westermann, 2010). Mitochondrial Drp‐1 was also up‐regulated in CA1 after IPC treatment, which was in accordance with the fact that IPC (a sub‐lethal ischaemic stress) can enhance cellular resistance and protect cells against extensive ischaemic injury (Dirnagl et al., 2009). Based on these results, we silenced the expression of Drp‐1 with siRNA in vitro or blocked the translocation of Drp‐1 with a selective inhibitor in vivo to investigate the relationship between Drp‐1 and neuronal vulnerability in response to global ischaemia. These findings provide direct evidence that mitochondrial Drp‐1 plays a role in neuroprotection and is one of the contributors to the characteristic resistance of cells in the CA3. What is more, silencing the expression of Mfn‐1 to force the mitochondria towards fission showed no protective effect against OGD injury indicating a specific role of Drp‐1 in this process. Functional changes were observed with an open‐field experiment. Rats treated with Mdivi1 showed increased locomotor activity indicating a more severe loss of habituation. These results were corroborated by the results of the Nissl staining of samples from the CA3 hippocampus where cells responsible for organizing the spatial information are located, suggesting that the abnormal locomotor activity was attributed to the loss of CA3 neurons (Kesner, 2007).
Drp‐1 is the main regulator of mitochondrial morphology and acts as a stabilizing force for fusion. It has been reported that damaged mitochondria that fail to fuse can be eliminated through autophagy. Thereby, mitochondrial quantity and qualityare controlled by mitophagy. Recent studies suggested that loss of Drp‐1‐mediated fission decreases mitophagy under physical (Twig et al., 2008) and pathological (Narendra et al., 2008; Tanaka et al., 2010) conditions. Considering the importance of mitochondria in metabolic and apoptotic processes, we would like to see whether the Drp‐1‐mediated neuroprotective mechanism can be attributed to downstream mitophagy.
Under EM, a large number of autophagosomes containing mitochondria were observed in the CA3 region after ischaemic damage. However, in the CA1 region, a considerable amount of hyperdense membranous material was observed indicating the accumulation of damaged mitochondria. Accordingly, the total mitochondrial protein mass were higher in the CA1 region compared with CA3 indicating a severe accumulation of mitochondria in the CA1. This discrepancy between the CA1 and CA3 regions was further confirmed by measuring the release of cyt‐c and the generation of ROS. We found that there were no changes in CA3 after global ischaemic injury; however, the release of cyt‐c and the generation of ROS were increased in the CA1. Blocking the translocation of Drp‐1 to mitochondria resulted in the accumulation of damaged mitochondria and impaired mitophagy, which enhanced the mitochondria‐mediated injury, as the release of ROS and cyt‐c were increased in the CA3 region. These results indicate that mtDrp‐1 contributes to the resistant property of CA3 neurons. Interestingly, in the in vitro study, we found that silencing Drp‐1 by siRNA showed no influence on the total level of autophagy, as the number of LC3‐positive pucta was not changed. However, the number of mitochondria surrounded by LC3 positive pucta was increased. From these results we propose that Drp‐1‐mediated mitochondrial fission is essential for the removal of damaged mitochondria through the recruitment of pro‐autophagic factors to the outer membrane of mitochondria.
In conclusion (Figure 7), our research is the first to show the different spatial and temporal expression of Drp‐1 in hippocampal CA1 and CA3 regions in response to brain ischaemic injury, which might contribute to the discrepancies in their response to global ischaemic injury. Furthermore, we propose that Drp‐1 protects against ischaemic injury by facilitating the activity of the autophagic pathway and hence the rapid removal of damaged mitochondria. Understanding this endogenous neuroprotective mechanism is important for discovering novel targets and our results highlight Drp‐1 as a potential therapeutic target for stroke.
Figure 7.
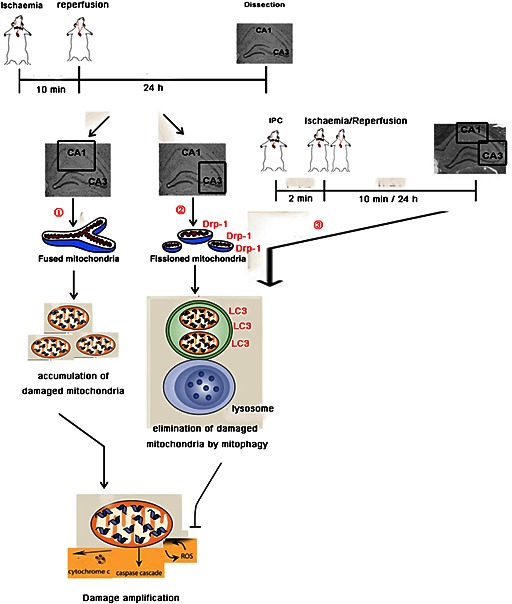
A summary of the results. Neurons in different regions of hippocampus showed different responses to global brain ischaemia. ① In CA1 region, cytoplasmic Drp‐1 failed to translocating to mitochondria in response to global ischaemia. Injured mitochondria could not be recognized and removed by mitophagy. The accumulation of damaged mitochondria enhanced the ischaemic injury. ② In CA3 region, mtDrp‐1 was increased after global ischaemic injury resulting in mitochondrial fission. LC3 was recruited to the outer membrane of damaged mitochondria resulting in their elimination by mitophagy. The rapid clearance of damaged mitochondria avoided the release of cyt‐3 and the generation of ROS. ③ After the treatment with IPC, CA1 showed similar responses as CA3 to global ischaemia indicating the involvement of mtDrp‐1 in the neuroprotective mechanism of IPC.
Author contributions
W.Z. designed and performed all the experiments, analysed data and wrote the manuscript; P.F.Y. and C.J. performed animal experiments; Z.Z provided intellectual contributions; N.H.C. supervised all experiments, analysed data and helped prepare the manuscript. All co‐authors read and edited the manuscript.
Conflict of interest
The authors declare no conflicts of interest.
Declaration of transparency and scientific rigour
This Declaration acknowledges that this paper adheres to the principles for transparent reporting and scientific rigour of preclinical research recommended by funding agencies, publishers and other organizations engaged with supporting research.
Acknowledgements
This work was supported by funding from National Natural Science Foundation of China grants (nos. 81274122, 81102831, 81073078, 81373997, 81173578); Special Purpose for New Drug Development (2012ZX09301002‐004, 2012ZX09103101‐006); Studies on Structure and Function of Bioactive Substabces from Natural Medicines (IRT1007); Beijing Natural Science Foundation (7131013); Research Fund for the Doctoral Program of Higher Education of China (20121106130001) and Beijing Key Laboratory of New Drug Mechanisms and Pharmacological Evaluation Study (no. BZ0150).
Zuo, W. , Yang, P. F. , Chen, J. , Zhang, Z. , and Chen, N. H. (2016) Drp‐1, a potential therapeutic target for brain ischaemic stroke. British Journal of Pharmacology, 173: 1665–1677. doi: 10.1111/bph.13468.
References
- Alexander SPH, Peters JA, Kelly E, Marrion N, Benson HE, Faccenda E et al. (2015). The Concise Guide to PHARMACOLOGY 2015/16: Other ion channels. Br J Pharmacol 172: 5942–5955. [DOI] [PMC free article] [PubMed] [Google Scholar]
- Anne SR, Leak RK, Gao Y, Chen J (2013). The dynamics of the mitochondrial organelle as a potential therapeutic target. J Cereb Blood Flow Metab 33: 22–32. [DOI] [PMC free article] [PubMed] [Google Scholar]
- Chen J, Zhu RL, Nakayama M, Kawaguchi KJ, Jin KL, Stetler RA (1996). Expression of the apoptosis‐effector gene, Bax, is up‐regulated in vulnerable hippocampal CA1 neurons following global Ischaemia. J Neurochem 67: 64–71. [DOI] [PubMed] [Google Scholar]
- Curtis MJ, Bond RA, Spina D, Ahluwalia A, Alexander SP, Giembycz MA et al. (2015). Experimental design and analysis and their reporting: new guidance for publication in BJP. Br J Pharmacol 172: 3461–3471. [DOI] [PMC free article] [PubMed] [Google Scholar]
- Detmer SA, Chan DC (2007). Functions and dysfunctions of mitochondrial dynamics. Nature 8: 870–879. [DOI] [PubMed] [Google Scholar]
- Dirnagl U, Becker K, Meisel A (2009). Preconditioning and tolerance against cerebral ischaemia: from experimental strategies to clinical use. Lancet Neurol 8: 398–412. [DOI] [PMC free article] [PubMed] [Google Scholar]
- Frank S, Gaume B, Bergmann‐Leitner ES, Leitner WW, Robert EG, Catez F (2001). The role of dynamin‐related protein 1, a mediator of mitochondrial fission, in apoptosis. Dev Cell 1: 515–525. [DOI] [PubMed] [Google Scholar]
- Geisler S, Holmström KM, Skujat D, Fiesel FC, Rothfuss OC, Kahle PJ (2010). PINK1/Parkin mediated mitophagy is dependent on VDAC1 and p62/SQSTM1. Nat Cell Biol 12: 119–131. [DOI] [PubMed] [Google Scholar]
- Gidday JM (2006). Cerebral preconditioning and ischemic tolerance. Nat Rev Neurosci 7: 437–448. [DOI] [PubMed] [Google Scholar]
- Goldberg MP, Choi DW (1993). Combined oxygen and glucose deprivation in cortical cell culture: calcium‐dependent and calcium‐independent mechanisms of neuronal injury. J Neurosci 13: 3510–3524. [DOI] [PMC free article] [PubMed] [Google Scholar]
- Goldenthal MJ, Marin‐Garcia J (2004). Mitochondrial signaling pathways: a receiver/integrator organelle. Mol Cell Biochem 262: 1–16. [DOI] [PubMed] [Google Scholar]
- Jasinska M, Siucinska E, Glazewski S, Pyza E, Kossut M (2006). Characterization and plasticity of the double synapse spines in the barrel cortex of the mouse. Acta Neurobiol Exp 66: 99–104. [DOI] [PubMed] [Google Scholar]
- Jiang Y, Deacon R, Anthony DC, Campbell SJ (2008). Inhibition of peripheral TNF can block the malaise associated with CNS inflammatory diseases. Neurobiol Dis 32: 125–132. [DOI] [PubMed] [Google Scholar]
- Karbowski M, Arnoult D, Chen H, Chan DC, Smith CL, Youle RJ (2004). Quantitation of mitochondrial dynamics by photolabeling of individual organelles shows that mitochondrial fusion is blocked during the Bax activation phase of apoptosis. J Cell Biol 164: 493–499. [DOI] [PMC free article] [PubMed] [Google Scholar]
- Kesner RP (2007). Behavioral functions of the CA3 subregion of the hippocampus. Learn Mem 14: 771–781. [DOI] [PubMed] [Google Scholar]
- Kilkenny C, Browne W, Cuthill IC, Emerson M, Altman DG (2010). Animal research: reporting in vivo experiments: the ARRIVE guidelines. Br J Pharmacol 160: 1577–1579. [DOI] [PMC free article] [PubMed] [Google Scholar]
- Kirino T (1982). Delayed neuronal death in the gerbil hippocampus following Ischaemia. Brain Res 239: 57–69. [DOI] [PubMed] [Google Scholar]
- McGrath JC, Lilley E (2015). Implementing guidelines on reporting research using animals (ARRIVE etc.): new requirements for publication in BJP. Br J Pharmacol 172: 3189–3193. [DOI] [PMC free article] [PubMed] [Google Scholar]
- Mileson BE, Schwartz RD (1991). The use of locomotor activity as a behavioral screen for neuronal damage following transient forebrain Ischaemia in gerbils. Neurosci Lett 128: 71–76. [DOI] [PubMed] [Google Scholar]
- Motley AM, Hettema EH (2007). Yeast peroxisomes multiply by growth and division. J Cell Biol 178: 399–410. [DOI] [PMC free article] [PubMed] [Google Scholar]
- Narendra D, Tanaka A, Suen DF, Youle RJ (2008). Parkin is recruited selectively to impaired mitochondria and promotes their autophagy. J Cell Biol 183: 795–803. [DOI] [PMC free article] [PubMed] [Google Scholar]
- Ouyang YB, Voloboueva LA, Xu LJ, Giffard RG (2007). Selective dysfunction of hippocampal CA1 astrocytes contributes to delayed neuronal damage after transient forebrain Ischaemia. J Neurosci 27: 4253–4260. [DOI] [PMC free article] [PubMed] [Google Scholar]
- Papadakis M, Hadley G, Xilouri M, Hoyte LC, Nagel S, McMenamin MM et al. (2013). Tsc1 (hamartin) confers neuroprotection against Ischaemia by inducing autophagy. Nat Med 19: 351–357. [DOI] [PMC free article] [PubMed] [Google Scholar]
- Pawson AJ, Sharman JL, Benson HE, Faccenda E, Alexander SP, Buneman OP et al., NC‐IUPHAR (2014). The IUPHAR/BPS guide to PHARMACOLOGY: an expert‐driven knowledge base of drug targets and their ligands. Nucleic Acids Res 42: D1098–D1106. [DOI] [PMC free article] [PubMed] [Google Scholar]
- Petito CK, Feldmann E, Pulsinelli WA, Plum F (1987). Delayed hippocampal damage in humans following cardiorespiratory arrest. Neurology 37: 1281–1286. [DOI] [PubMed] [Google Scholar]
- Pitts KR, Yoon Y, Krueger EW, McNiven MA (1999). The dynamin‐like protein DLP1 is essential for normal distribution and morphology of the endoplasmic reticulum and mitochondria in mammalian cells. Mol Biol Cell 10: 4403–4417. [DOI] [PMC free article] [PubMed] [Google Scholar]
- Pulsinelli WA, Brierley JB (1979). A new model of bilateral hemispheric Ischaemia in the unanesthetized rat. Stroke 10: 267–272. [DOI] [PubMed] [Google Scholar]
- Pulsinelli WA, Buchan AM (1988). The four‐vessel occlusion rat model: method for complete occlusion of vertebral arteries and control of collateral circulation. Stroke 19: 913–914. [DOI] [PubMed] [Google Scholar]
- Schrader M (2006). Shared components of mitochondrial and peroxisomal division. Biochim Biophys Acta 1763: 531–541. [DOI] [PubMed] [Google Scholar]
- Sun SH, Jackson MF, Martin LJ, Jansen K, Teves L, Cui H (2009). Suppression of hippocampal TRPM7 protein prevents delayed neuronal death in brain Ischaemia. Nat Neurosci 12: 1300–1307. [DOI] [PubMed] [Google Scholar]
- Tanaka A, Cleland MM, Xu S, Narendra DP, Suen DF, Karbowski M (2010). Proteasome and p97 mediate mitophagy and degradation of mitofusins induced by Parkin. J Cell Biol 191: 1367–1380. [DOI] [PMC free article] [PubMed] [Google Scholar]
- Terry RD, Masliah E, Salmon DP, Butters N, DeTeresa R, Hill R (1991). Physical basis of cognitive alterations in Alzheimer's disease: synapse loss is the major correlate of cognitive impairment. Ann Neurol 30: 572–580. [DOI] [PubMed] [Google Scholar]
- Twig G, Elorza A, Molina AJ, Mohamed H, Wikstrom JD, Walzer G (2008). Fission and selective fusion govern mitochondrial segregation and elimination by autophagy. EMBO J 27: 433–446. [DOI] [PMC free article] [PubMed] [Google Scholar]
- van der Worp HB, van Gijn J (2007). Clinical practice. Acute ischemic stroke. N Engl J Med 357: 572–579. [DOI] [PubMed] [Google Scholar]
- Westermann B (2010). Mitochondrial fusion and fission in cell life and death. Nat Rev Mol Cell Biol 11: 872–884. [DOI] [PubMed] [Google Scholar]
- Zuo W, Zhang S, Xia CY, Guo XF, He WB, Chen NH (2014). Mitochondria autophagy is induced after hypoxic/ischemic stress in a Drp1 dependent manner: the role of inhibition of Drp1 in ischemic brain damage. Neuropharmacology 86: 103–115. [DOI] [PubMed] [Google Scholar]