

Abstract
Aims
Phospholamban (PLN) and sarcolipin (SLN) are small inhibitory proteins that regulate the sarco(endo)plasmic reticulum Ca2+‐ATPase (SERCA) pump. Previous work from our laboratory revealed that in the soleus and gluteus minimus muscles of mice overexpressing PLN (Pln OE), SERCA function was impaired, dynamin 2 (3–5 fold) and SLN (7–9 fold) were upregulated, and features of human centronuclear myopathy (CNM) were observed. Here, we performed structural and functional experiments to evaluate whether the diaphragm muscles of the Pln OE mouse would exhibit CNM pathology and muscle weakness.
Methods
Diaphragm muscles from Pln OE and WT mice were subjected to histological/histochemical/immunofluorescent staining, Ca2+‐ATPase and Ca2+ uptake assays, Western blotting, and in vitro electrical stimulation.
Results
Our results demonstrate that PLN overexpression reduced SERCA's apparent affinity for Ca2+ but did not reduce maximal SERCA activity or rates of Ca2+ uptake. SLN was upregulated 2.5‐fold, whereas no changes in dynamin 2 expression were found. With respect to CNM, we did not observe type I fiber predominance, central nuclei, or central aggregation of oxidative activity in diaphragm, although type I fiber hypotrophy was present. Furthermore, in vitro contractility assessment of Pln OE diaphragm strips revealed no reductions in force‐generating capacity, maximal rates of relaxation or force development, but did indicate that ½ relaxation time was prolonged.
Conclusions
Therefore, the effects of PLN overexpression on skeletal muscle phenotype differ between diaphragm and the postural soleus and gluteus minimus muscles. Our findings here point to differences in SLN expression and type I fiber distribution as potential contributing factors.
Keywords: Centronuclear myopathy, fiber types, phospholamban, sarcolipin, SERCA
Introduction
Centronuclear myopathies (CNM) are a group of congenital myopathies that, along with general muscle weakness, display increased central nuclei, type I fiber predominance and hypotrophy, and central aggregation of oxidative activity upon muscle biopsy (Sharma et al. 2009; Romero 2010). Phospholamban (PLN) is a small (52 amino acid) protein that physically interacts with and inhibits the sarco(endo)plasmic reticulum Ca2+‐ATPase (SERCA) pump (Morita et al. 2008). Recently, we found that the soleus and gluteus minimus muscles from mice overexpressing PLN (Pln OE) in their slow‐twitch type I skeletal muscle fibers had impaired SERCA function and displayed the histopathological features associated with human CNM (Fajardo et al. 2015). Based on the appearance of radiating sarcoplasmic strands, type II fiber hypertrophy, and endomysial fibrosis, the CNM observed in the Pln OE mice resembles human autosomal dominant CNM and, to an extent, RYR‐related and TTN‐related CNM (Jungbluth and Gautel 2014).
A recently published review highlighted that although diaphragm and ventilatory function have been examined in several murine models of myopathy including Pompe disease and Duchenne muscular dystrophy, among other neuromuscular diseases, similar reports are not available for animal models of CNM (Smith et al. 2014). Compared with the other two major CNM variants, X‐linked myotubular myopathy and autosomal‐recessive CNM, respiratory function in patients with autosomal dominant CNM, for the most part, is intact and patients live a normal lifespan (Bitoun et al. 2005; Jungbluth et al. 2008; Romero 2010; Smith et al. 2014). Thus, it was of interest to determine whether or not the diaphragm muscles of the Pln OE mouse, which more closely resembles autosomal dominant CNM, would exhibit CNM pathology and muscle weakness. Since in this model, PLN is overexpressed specifically in the type I fibers and the murine diaphragm normally consists of around 10% type I fibers (Green et al. 1984; Talmadge et al. 2004); we initially hypothesized that the diaphragm from Pln OE mice would display impaired SERCA function, muscle weakness, and the appearance of the histopathological features associated with human CNM.
Materials and Methods
Animals and tissue collection
The Pln OE mice were resuscitated from cryopreserved embryos by the mmRRC (00067‐MU, FVB/N background) to generate a breeding colony with WT FVB/N mice at the University of Waterloo. The Pln transgene was attached to the β‐MHC promoter so that these mice exhibit type I fiber‐specific PLN overexpression. A total of 15 male wild‐type (WT; 30.9 ± 1.2 g) and 16 male Pln OE (30.7 ± 0.9 g) 4–6‐month‐old mice were used in the study. Animals were housed in an environmentally controlled room with a standard 12:12‐h light–dark cycle and allowed access to food and water ad libitum. Mice were sacrificed by cervical dislocation and diaphragm, soleus, and gluteus minimus muscles were extracted. We restricted analyses to the anterior‐lateral costal regions of the diaphragm muscles. Diaphragm strips were either used for the assessment of SERCA function, contractility, or histological/histochemical/immunofluorescence staining for the examination of central nuclei, central aggregation of oxidative activity and fiber type distribution and CSA. Nuclear and cytosolic fractions from the diaphragm, soleus, and gluteus minmus muscles were extracted as previously described (McMillan and Quadrilatero 2011). All animal procedures were reviewed and approved by the Animal Care Committee of the University of Waterloo and are consistent with the guidelines established by the Canadian Council on Animal Care.
SERCA activity and Ca2+ uptake
Ca2+‐dependent SERCA activity was assessed in homogenates prepared from mouse (WT and Pln OE) diaphragm muscles over Ca2+ concentrations ranging from pCa 7.0 to 4.8 at 37°C using a spectrophotometric plate reader assay that has been described previously (Duhamel et al. 2007). Briefly, 10 μL of crude diaphragm homogenate was added to 5 mL cocktail buffer containing the reaction buffer (200 mmol/L KCl, 20 mmol/L HEPES, 15 mmol/L MgCl2, 10 mmol/L NaN3, 10 mmol/L phosphoenolpyruvate, 5 mmol/L ATP, 1 mmol/L EGTA, pH 7.0), 18 U/mL lactate dehydrogenase, 18 U/mL pyruvate kinase, 0.3 mmol/L NADH, in the presence of ionophore A23187 (Sigma C7522, 4 μmol/L, St. Louis, MO). Total ATPase activity across the range of pCa was determined as the rate of NADH disappearance over 30 min measured at 340 nm using a spectrophotometric plate reader (SPECTRAMAX plus; Molecular Devices, Toronto, ON, Canada). SERCA activity was then calculated by subtracting ATPase activity in the presence of a SERCA‐specific inhibitor, cyclopiazonic acid (40 μmol/L) (Seidler et al. 1989), and SERCA activity‐pCa curves were generated with GraphPad Prism™ (version 6, GraphPah Software, Inc. La Jolla, CA) by nonlinear regression curve fitting using an equation for a general cooperative model for substrate activation. Ca2+ uptake was measured in muscle homogenates at 37°C in the presence of the precipitating anion, oxalate, using the fluorescent dye Indo‐1 (50042; Biotium, Hayward, CA) and a spectrofluorometer (Ratiomaster™ System; Photon Technology International, Birmingham, NJ) equipped with a monochromator to control the excitation wavelength (355 nm) and two photomultiplier tubes to detect emitted light (405 and 485 nm) (Tupling and Green 2002). Rates of Ca2+ uptake were assessed at a free Ca2+ concentration of 1.0 μmol/L.
Antibodies
Primary antibodies against SERCA2a (2A7‐A1), PLN (2D12), NFATc1 (7A6), and dynamin 2 (PA5‐19800) were obtained from Pierce Antibodies. The primary antibody for calcineurin was obtained from Millipore (07‐1491). The primary antibody for SERCA1a (A52) was a kind gift from Dr. David MacLennan (University of Toronto) (Zubrzycka‐Gaarn et al. 1984). The primary antibody directed against sarcolipin (SLN) was generated by Lampire Biological Laboratories (Fajardo et al. 2013). The primary antibody against α‐actin (A4700) was obtained from Sigma Aldrich (St. Louis, MO). The primary antibodies against MHCI (BA‐F8), MHCIIa (SC‐71), and MHCIIb (BF‐F3) were obtained from Developmental Studies Hybridoma Bank (Schiaffino et al. 1989). These antibodies are highly specific for use in murine skeletal muscle, although the antibody for MHCIIa does cross‐react with MHCIIx in human tissue (Bloemberg and Quadrilatero 2012). Secondary antibodies for Western blotting, goat anti‐mouse IgG (peroxidase conjugated; sc‐2005) and goat anti‐rabbit IgG (peroxidase conjugated; sc‐2030) were obtained from Santa Cruz Biotechnology (Dallas, TX). Secondary antibodies for immunofluorescence staining, Alexa Fluor 350 anti‐mouse IgG2b (A‐21140), Alexa Fluor 488 anti‐mouse IgG1 (A‐21121), and Alexa Fluor 555 anti‐mouse IgM (A‐21426), were obtained from Molecular Probes Thermo Fisher.
Western blot analysis
Western blot analysis was performed to determine expression levels of SERCAs, SLN, PLN, and dynamin 2 in the diaphragm muscles from WT and Pln OE mice as previously described (Fajardo et al. 2015). In addition, calcineurin expression and NFAT nuclear localization in soleus, gluteus minimus, and diaphragm muscles were assessed. Samples were not boiled prior to electrophoresis, which allows for detection of monomeric and pentameric PLN content (Tupling et al. 2011). Electrophoretically separated proteins were transferred onto 0.2 μm polyvinylidene difluoride (PVDF) membranes (PLN, 1:2000; SERCA1a, 1:10,000; SERCA2a, 1:2000; dynamin 2, 1:2000; NFATc1, 1:2000; calcineurin, 1:1000) or nitrocellulose membranes (SLN, 1:100) and then immunoprobed with their corresponding primary antibodies. Subsequently, membranes were washed and immunoprobed with either goat anti‐mouse IgG (horseradish peroxidase conjugated) with a 1:20,000 dilution for SERCA1a and SERCA2a, and a 1:2000 dilution for PLN, dynamin 2, and NFATc1; or a goat anti‐rabbit IgG (horseradish peroxidase conjugated) in a 1:2000 dilution for SLN and calcineurin. Antigen‐antibody complexes were detected by SuperSignal West Femto™ substrate (Pierce; Thermo Fisher Scientific Inc., Grand Island, NY) for SLN; Luminata Forte™ (Millipore, Billerica, MA) for PLN and SERCA2a; and ECL Western Blot Substrate (BioVision, MA) for SERCA1a, NFAT, calcineurin, and dynamin 2. Quantitation of optical densities was performed using GeneTools (Syngene, MD) and was normalized to total protein or α‐actin.
Histological, histochemical, and immunofluorescence staining
Diaphragm muscles from WT and Pln OE mice were removed and embedded in O.C.T. compound (Tissue‐Tek, Sakura Finetek USA Inc., Torrance, CA), frozen in liquid nitrogen‐cooled isopentane, stored at −80°C, and cut into 10‐μm‐thick cryosections with a cryostat (Thermo Fisher Scientific Inc., Grand Island, NY, United States) maintained at −20°C. To examine the percent of fibers containing centrally located nuclei and central aggregation of oxidative activity, hematoxylin and eosin (H&E) staining, and succinate dehydrogenase (SDH) activity were performed, respectively. Images were acquired with a brightfield Nikon microscope linked to a PixeLink digital camera and central nuclei counts were quantified with ImageJ software (National Institutes of Health, Bethesda, MD) using the cell counter plugin. One section of the diaphragm muscle from each mouse (n = 4 per genotype) was randomly selected and 793–1292 fibers were analyzed for central nuclei per section. For fiber type analysis (CSA and % distribution), immunofluorescence analysis of MHC expression with primary antibodies against MHCI, MHCIIa, and MHCIIb was performed. Details regarding the dilutions of the primary and secondary antibodies for fiber type analysis have been previously described (Bloemberg and Quadrilatero 2012). Slides were visualized with an Axio Observer Z1 fluorescent microscope equipped with standard red/green/blue filters, an AxioCam HRm camera, and AxioVision software (Carl Ziess, North York, ON, Canada). Details of the immunofluorescence procedures and analysis of MHC expression were previously described (McMillan and Quadrilatero 2011; Bloemberg and Quadrilatero 2012; Fajardo et al. 2013). Briefly, for fiber type distribution, one section of the diaphragm muscle from each mouse was randomly selected and all fiber types within that section were counted and sorted by fiber type (1126–3105 total fibers per section) using ImageJ's cell counter plugin. For analysis of fiber type area, 20 fibers of each type were randomly selected within a diaphragm section and the area of each fiber was determined and then averaged using ImageJ's area measurement tool after calibrating with the corresponding scale bar. This was repeated for five different WT and Pln OE mice, and the values reported represent the calculated averages from the five animals within the specific genotype.
In vitro diaphragm contractile assessment
Diaphragm strips were isolated and immediately placed into a bath of oxygenated Tyrode's solution (95% O2, 5% CO2) containing 121 mmol/L NaCl2, 5 mmol/L KCl, 24 mmol/L NaHCO3, 1.8 mmol/L CaCl2, 0.4 mmol/L NaH2PO4, 5.5 mmol/L glucose, 0.1 mmol/L EDTA, and 0.5 mmol/L MgCl2, pH 7.3 (Bombardier et al. 2013) and were maintained at 25°C. Muscle strips were situated between flanking platinum electrodes driven by a biphasic simulator (Model 710B; Aurora Scientific, Inc., Aurora, ON, Canada) and electrically evoked muscle force was assessed across a range of stimulation frequencies from 1 to 100 Hz at optimum length for force production. Data were analyzed using Dynamic Muscle Control Data Acquisition software (Aurora Scientific, Inc). Specifically, peak isometric force amplitude (mN) was determined across the range of stimulation frequencies and measures of twitch kinetics: maximal rates of force development (+dF/dt) and relaxation (−dF/dt), ½ relaxation time (1/2 RT), and time to peak tension (TPT) were assessed. Peak isometric force was then normalized to the calculated CSA of the muscle strip (m/l*d) where m is the muscle mass, l is the length, and d is mammalian skeletal muscle density (1.06 mg/mm3) (Mendez 1960). A fatigue protocol (70 Hz for 350 ms every 2 sec for 5 min) was performed to determine the number of contractions required to reduce force to 60% of the force of the initial 70 Hz contraction.
Statistics
All values are presented as means ± standard error. Statistical significance was set to P < 0.05. Most comparisons between WT and Pln OE mice were performed using unpaired Student's t‐tests; however, a two‐way repeated measures ANOVA was used for force–frequency analysis of peak isometric force. A one‐way ANOVA with a Dunnet's multiple comparison post hoc test was used to compare PLN expression levels in WT gluteus minimus and soleus muscles with diaphragm.
Results
SERCA function and expression of Ca2+ handling proteins
Phospholamban overexpression was evident in the diaphragm homogenates from Pln OE mice as only 2.5 μg of total protein was required to detect PLN compared to the 25 μg required in the WT diaphragm (Fig. 1A). Specifically, measurements of optical density relative to actin indicate a 13‐fold and 22‐fold overexpression of PLN monomer and pentamer, respectively, compared with WT. PLN overexpression in diaphragm muscles was associated with a rightward shift in the activity‐pCa curves (Fig. 1B) and a significant increase in K Ca compared to WT (Table 1, P = 0.02). However, maximal SERCA activity was not significantly different between genotypes (Table 1, P = 0.45). We did observe lower rates of Ca2+ uptake in the Pln OE diaphragm homogenates compared to WT (Fig. 1C), however, this only approached statistical significance (P = 0.08). Western blot analysis revealed no differences in the expression of SERCA1a (Fig. 1D) or SERCA2a (Fig. 1E) between WT and Pln OE mice. SLN expression was found to be upregulated nearly 2.5‐fold in the diaphragm homogenates from Pln OE mice compared to WT (Fig. 1F, P < 0.001).
Figure 1.

SERCA function in diaphragm muscles in Pln OE mice at 4–6 months of age. (A) Western blotting for PLN in WT and Pln OE mice from diaphragm muscle homogenates. For WT mice, 25 μg of total protein was loaded, whereas only 2.5 μg was required for Pln OE mice to detect PLN protein. (B) Ca2+‐ATPase activity‐pCa curves in WT (n = 6) and Pln OE mice (n = 6) in the presence of the Ca2+ ionophore. (C) Ca2+ uptake assessed in diaphragm muscles from WT (n = 4) and Pln OE mice (n = 5). Western blotting for SERCA1a (D), SERCA2a (E), and SLN (F) in soleus from WT and Pln OE mice (n = 4–5 per genotype). Total protein loaded was 1 μg, 4 μg, and 25 μg for SERCA1a, SERCA2a, and SLN, respectively. Actin was used as a loading control and all values are expressed relative to WT. For, A, D, E the two lanes for WT and Pln OE correspond to samples from two different WT and two different Pln OE mice, respectively. *P ≤ 0.05 versus WT using Student's t‐test. All values are presented as mean ± standard error.
Table 1.
SERCA activity in mouse diaphragm muscles from WT and Pln OE mice at 4–6 months of age
| Genotype | V max (μmol/g of protein/min) | K Ca | ΔK Ca |
|---|---|---|---|
| WT | 409.1 ± 29.8 | 5.98 ± 0.02 | – |
| Pln OE | 382.1 ± 17.3 | 5.90 ± 0.02a | 0.08 |
Values are means ± standard error. Homogenates were isolated from WT (n = 6) and Pln OE (n = 6) mouse diaphragm muscles and were analyzed for Ca2+‐ATPase activity over Ca2+ concentrations ranging from pCa 7 to pCa 4.8 to obtain K Ca. K Ca is the Ca2+ concentration required to attain the half‐maximal Ca2+‐ATPase activity rate and is expressed in pCa units. ΔK Ca is the difference in K Ca between genotypes.
Significantly different from WT using Student's t‐test, P < 0.05.
Assessment of CNM features in diaphragm muscles from Pln OE mice
H&E and SDH staining of diaphragm cryosections revealed no elevations in the percentage of fibers showing central nuclei (WT, 1.2 ± 0.2% vs. Pln OE, 1.2 ± 0.3%, P = 0.86) or evidence of central aggregation of oxidative activity in the Pln OE diaphragm (Fig. 2A and B). A significant reduction in the percentage of type I fibers was found (Fig. 2C and D, P < 0.001) and although individually the type II fibers (IIA, IIX, IIB) were not different between genotypes, there was a significant increase in the collective percentage of all type II fibers in the Pln OE diaphragm (WT, 86.5 ± 0.7% vs. Pln OE, 95.0 ± 1.8%, P < 0.001). Furthermore, we observed a significant reduction (P < 0.001) in type I fiber CSA and a significant increase in type IIA (P = 0.01), type IIX (P < 0.001), and type IIB (P < 0.001) CSA in the Pln OE diaphragm (Fig. 2E). Western blotting for dynamin 2 expression in diaphragm revealed no significant differences between WT and Pln OE mice (Fig. 2F, P = 0.87).
Figure 2.
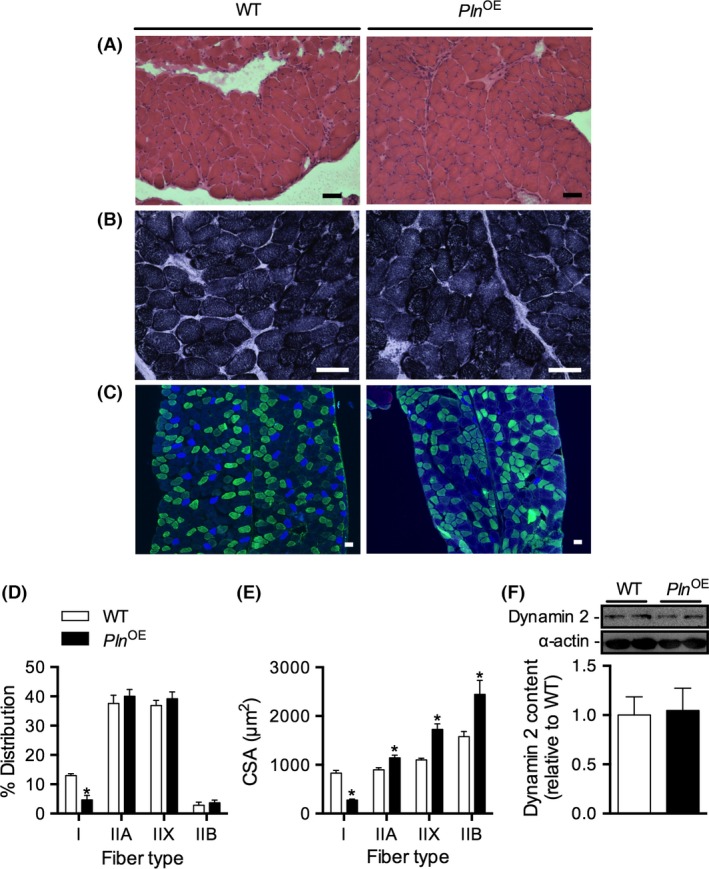
Diaphragm muscles from Pln OE mice do not display CNM. Representative diaphragm cryosections from Pln OE and WT mice after H&E staining (A), SDH staining (B), immunofluorescence staining for fiber type analysis (C) (n = 5 per genotype for all staining protocols). Cross sections were stained with MHC antibodies to identify type I (blue), type IIA (green), type IIB (red), and type IIX (unstained). (D) Quantitative analysis of fiber type distribution in diaphragm muscles from WT and Pln OE mice at 4–6 months of age (n = 5 per genotype). (E) Quantitative analysis of fiber type cross‐sectional area (CSA) in diaphragm muscles from WT and Pln OE mice at 4–6 months of age (n = 5 per genotype). (F) Dynamin 2 expression in diaphragm homogenates from WT and Pln OE mice (n = 6 per genotype). Total protein loaded for dynamin 2 was 7.5 μg. *P ≤ 0.05 versus WT using Student's t‐test. All values are presented as mean ± standard error. Scale bars in (A–C) are set to 50 μm.
Diaphragm contractility
Representative twitch and tetanic (100 Hz) force tracings illustrate no significant differences in force production between WT and Pln OE diaphragm strips (Fig. 3A and B). In addition, there were no differences in maximal rates of relaxation (−dF/dt: WT, 0.73 ± 0.04 vs. Pln OE, 0.68 ± 0.07, mN/ms/mm2, P = 0.49) or maximal rates of force development (+dF/dt: WT, 5.04 ± 0.51 vs. Pln OE, 5.87 ± 0.68 mN/ms/mm2, P = 0.34). Correspondingly, there were no differences in TPT between genotypes (WT, 39. 2 ± 1.9 vs. Pln OE, 38.5 ± 1.7, ms, P = 0.78, n = 6 per genotype); however, there was a significant increase in ½ relaxation time in the Pln OE diaphragm compared with WT (WT, 78.0 ± 5.3 vs. Pln OE 95.8 ± 3.8, ms, P = 0.02, n = 6 per genotype). Interestingly, across submaximal and maximal frequencies, Pln OE diaphragm strips generated more specific force compared to WT but the difference was not significant (Fig. 3C). Finally, in response to a fatiguing stimulation protocol, Pln OE diaphragms required on average 100 ± 8 contractions to reach 60% maximum isometric force at 70 Hz compared to 132 ± 19 in the WT diaphragm; however, this difference was not statistically significant (Fig. 3D, P = 0.16).
Figure 3.
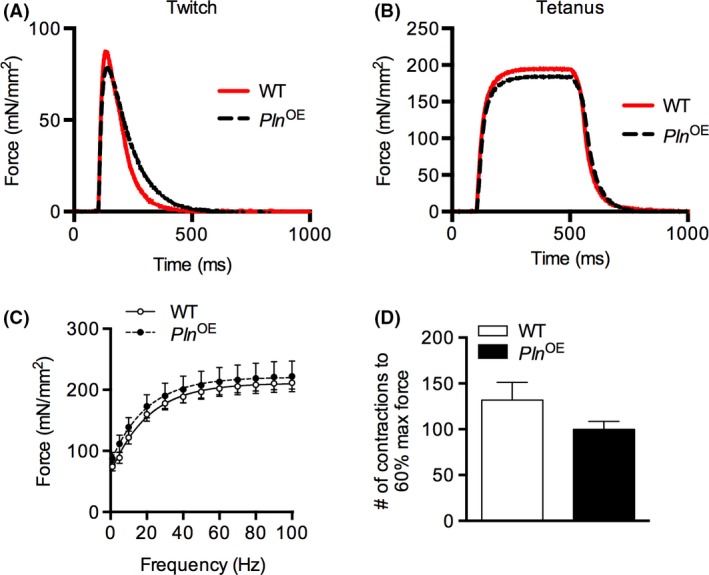
Diaphragm contractility in Pln OE and WT mice at 4–6 months of age. (A) Representative twitch (A) and tetanic (B) force tracings normalized to CSA from WT and Pln OE diaphragm strips. (C) Force–frequency curve analysis in diaphragm strips from WT and Pln OE mice. (D) Number of contractions to reduce force to 60% of initial isometric force when isolated diaphragm strips underwent a fatiguing stimulation protocol (70 Hz for 350 ms every 2 sec for 5 min). For C and D, all values are presented as mean ± standard error, n = 6 per genotype.
Discussion
Studies examining diaphragm function in animal models of CNM are limited as recently highlighted in a review by Smith Goddard, and Childers (Smith et al. 2014). However, in a study published in the same year, Cowling et al. (2014) showed histopathological abnormalities with more atrophic fibers containing mislocalized nuclei in the diaphragm muscles from mtm1 −/y mice, a mouse model which accurately recapitulates human X‐linked myotubular myopathy (Buj‐Bello et al. 2002). Correspondingly, mtm1 −/y mice have a very short lifespan (6–14 weeks) (Buj‐Bello et al. 2002) which is consistent with the severe respiratory complications often leading to early death reported in human cases of myotubular myopathy (Jungbluth et al. 2008). We have recently reported that the Pln OE mouse histopathologically resembles human autosomal dominant CNM (Fajardo et al. 2015), which, in contrast to myotubular myopathy, is generally less severe, and patients often have a normal lifespan with very few respiratory complications (Bitoun et al. 2005; Jungbluth et al. 2008; Romero 2010). Here, we have shown that the Pln OE diaphragm exhibits type I fiber hypotrophy but does not display type I fiber predominance, increased central nuclei, central aggregation of oxidative activity, or muscle weakness. In agreement with the differences in disease severity found in the diaphragm between mouse models, the Pln OE mice live much longer than mtm1 −/y mice, albeit, shorter than their WT littermates (Fig. S1).
Previous studies have shown that elevated dynamin 2 in skeletal muscle can lead to features of CNM (Cowling et al. 2011; Liu et al. 2011) while reducing its expression can improve muscle function and alleviate murine CNM pathology (Cowling et al. 2014). Since, dynamin 2 is upregulated 3–5 fold in the Pln OE soleus and gluteus minimus (Fajardo et al. 2015) but not diaphragm (Fig. 2F), it is possible that differences in dynamin 2 expression could explain the lack of CNM phenotype in the Pln OE diaphragm. How PLN overexpression and impaired SERCA function leads to increased dynamin 2 in the affected muscles is unclear. Furthermore, although dynamin 2 has been implicated in the pathology of murine CNM, its role in human CNM is less established since we have recently observed a 35% reduction in its expression in muscle biopsies from CNM patients (Fajardo et al. 2015) while others have seen a twofold increase in patients with myotubular myopathy (Cowling et al. 2014).
Our findings of minimal histopathological defects within the Pln OE diaphragm despite PLN overexpression may argue against a potential role of elevated PLN in CNM pathology. An important difference between diaphragm and the postural limb muscles in the Pln OE model is that SERCA function was not impaired in the diaphragm to the extent we observed in the soleus and gluteus minimus muscles (Fajardo et al. 2015). Maximal SERCA activity was not reduced in the Pln OE diaphragm compared to WT and rates of Ca2+ uptake were only trending to be lower in the Pln OE diaphragm compared to WT (−15%), whereas Ca2+ uptake measured at the same pCa was significantly reduced in the Pln OE soleus (−75%) and gluteus minimus muscles (−25%) (Fig. S3). This may be surprising given the 13‐fold overexpression of monomeric PLN in the Pln OE diaphragm compared with the previously observed 6.3‐fold and 6.7‐fold overexpression found in the soleus and gluteus miminus, respectively (Fajardo et al. 2015). However, since these measures are expressed relative to WT, it appears that the differences in PLN overexpression across muscle types can be accounted for by a fivefold lower monomeric PLN expression in the WT diaphragm compared with soleus and gluteus minimus muscles (Fig. S2). In our view, the simplest explanation for the muscle differences in this model is that WT diaphragm has the lowest proportion of type I fibers (~12%) compared with soleus and gluteus minimus, which is even lower in Pln OE (~6%); therefore, the inhibitory effects of PLN overexpression on SERCA function would be constrained to the few type I fibers present in diaphragm.
Despite near normal maximal activity, SERCA's apparent affinity for Ca2+ was reduced in the Pln OE diaphragm as indicated by a rightward shift in the activity‐pCa curve and a significantly higher K Ca. Reduced Ca2+ sensitivity of SERCA activity would be expected with PLN overexpression in type I fibers but could also be due to increased SLN expression. SLN is a well‐known structural and functional homolog of PLN (Odermatt et al. 1998; Tupling et al. 2011; Fajardo et al. 2013; Gorski et al. 2013) and, together, they have been shown to form a superinhibitory ternary complex with SERCA that not only reduces SERCA's affinity for Ca2+, but also the maximal rates of SERCA activity (Gorski et al. 2013) and Ca2+ uptake (Asahi et al. 2002). Interestingly, compared to the soleus and gluteus minimus, where SLN protein was upregulated ninefold and sevenfold, respectively (Fajardo et al. 2015), SLN in the diaphragm was only elevated 2.5‐fold, providing another possible mechanism which may contribute to the differences in severity of SERCA dysfunction across skeletal muscles in the Pln OE mouse. Finally, differences in SERCA's apparent affinity for Ca2+ may be related to differences in SERCA isoform expression. In a previous study using human single fibers, it was shown that type I fibers, which express SERCA2, have greater Ca2+ sensitivity of Ca2+ uptake compared with type II fibers, which express SERCA1 (Lamboley et al. 2014). Corresponding with this, when we compare WT diaphragm, a fast‐twitch muscle (our current study), with WT soleus, a slow‐twitch muscle (Fajardo et al. 2015), we find a much lower Ca2+ sensitivity of SERCA activity in diaphragm. While differences in SERCA isoform may contribute to the differences in K Ca we have observed between diaphragm and soleus, they cannot explain the reduction in SERCA's apparent affinity for Ca2+ we observed in Pln OE diaphragm compared with WT since there were no differences in SERCA1 or SERCA2 between Pln OE and WT.
Upregulated SLN protein and/or mRNA is becoming widely known as a common feature in many myopathies (Nakagawa et al. 2005; Ottenheijm et al. 2008; Liu et al. 2011; Calvo et al. 2012) and findings in the mdx mouse and mdx‐utrophin double knockout model suggest that its expression may be directly proportional to disease severity (Schneider et al. 2013). Similarly, SLN may follow disease severity in the Pln OE mouse since the myopathy in the diaphragm, where only abnormalities in fiber CSA were evident, is far less severe than that found in the Pln OE soleus and gluteus minimus, where all histopathological signs of CNM with additional endomysial fibrosis and core‐like aspects were evident (Fajardo et al. 2015). However, the role that SLN plays in the Pln OE mouse model of CNM or any other animal model of myopathy remains unknown. Corresponding with the SERCA activity and Ca2+ uptake results, the maximal rates of relaxation and rates of contraction were not different between genotypes in the diaphragm, which is in direct contrast to what we and others have observed previously in the soleus of these mice (Song et al. 2004; Fajardo et al. 2015). However, we did find that the Pln OE diaphragm displayed a prolonged ½ RT compared with WT, which is consistent with the significant and trending reductions in SERCA's apparent affinity for Ca2+ and rates of Ca2+ uptake, respectively. Taken together, our results are suggestive of a relatively modest impairment in SERCA function in the Pln OE diaphragm, which, in part, may contribute to the lack of CNM histopathology in that muscle.
Analysis of hybrid fiber types further suggests that Pln overexpression in the diaphragm does not promote a type I fiber phenotype since the number of transitional type I/IIA fibers was not different between WT and Pln OE (Fig. S4A). Moreover, there were increases in type IIA/IIX and IIX/IIB hybrid fibers in the Pln OE diaphragm compared with WT; however, these effects only approached statistical significance (P = 0.08 and 0.11, respectively; Fig. S4B and C). In any event, our data indicate that there was a general shift towards the faster fiber phenotype in the Pln OE diaphragm, which perhaps may explain the relatively small impairments in SERCA function and the lack in CNM phenotype. Analyses of central nuclei, fiber type distribution and CSA of 10–12‐month‐old mice produced similar findings to that of 4–6‐month‐old animals (Fig. S5), suggesting that the lack in CNM phenotype is not due to a delay in the disease progression of the diaphragm muscles.
To examine the underlying mechanisms behind these distinct effects on type I fiber proportions in the Pln OE diaphragm, soleus, and gluteus minimus muscles, we focused on the Ca2+‐dependent serine/threonine phosphatase, calcineurin. We suspect that in compensation for the type I fiber hypotrophy, the type II fibers of the postural soleus and gluteus minimus muscles exhibit greater load‐bearing activity thereby leading to myofiber hypertrophy and a fast‐to‐slow fiber type transition. A similar phenomenon is noted in functional overload studies whereby removal of the synergist muscles, soleus and gastrocnemius, causes the plantaris muscles to hypertrophy and transition towards a slow‐oxidative phenotype (Dunn et al. 1999; Michel et al. 2004). Importantly, calcineurin is activated during functional overload and is known to promote both the slow‐oxidative fiber phenotype (Timmerman et al. 1996; Dolmetsch et al. 1997; Chin et al. 1998) and myofiber hypertrophy (Dunn et al. 1999; Semsarian et al. 1999). Here, and similar to a previous study where calcineurin expression was found to be higher in the Pln OE soleus compared with WT (Song et al. 2004), our findings indicate greater calcineurin expression and NFAT nuclear content in the soleus and gluteus minimus muscles, but not in the Pln OE diaphragm (Fig. S6). Moreover, calsarcin‐2, an endogenous calcineurin inhibitor, is known to be highly expressed in diaphragm muscles (Frey et al. 2008). Thus, the inability to promote calcineurin signaling may help to explain both the reduction in the percent of type I fibers and the apparent increased susceptibility to muscle fatigue in the Pln OE diaphragm compared with WT. Although we did not assess force recovery after our fatigue protocol, successful recovery has been shown with a similar protocol (Coirault et al. 1999), which suggests that the protocol used in this study likely does not induce damage to the muscle fibers. Finally, it should also be noted that respiratory muscles do not typically undergo transformation with training and inactivity in the same way as limb muscle fibers, particularly with respect to MHC isoform (Polla et al. 2004). Thus, the reduced type I and increased type II fiber population may also represent a selective loss or underdevelopment of type I fibers due to PLN overexpression. Nevertheless, this innate response found within the diaphragm to limit the type I fibers may represent a novel therapeutic strategy combatting CNM and other congenital myopathies such as central cores since these are all type I fiber‐related myopathies (Sharma et al. 2009).
In summary, our results indicate that the Pln OE diaphragm, compared with soleus and gluteus minimus, is generally more resistant to the CNM phenotype, and that this lack in CNM pathology and weakness further supports the Pln OE mouse as a model of human autosomal dominant CNM where very little respiratory complications occur. Furthermore, we suggest that understanding the underlying mechanisms behind the diaphragm's apparent resistance to Pln OE‐induced CNM and muscle weakness may lead to the generation of novel therapeutic strategies. Our findings here point to differences in SLN expression and type I fiber distribution as potential contributing factors, and future studies will determine their impact.
Conflict of Interest
None declared.
Supporting information
Figure S1. Lifespan of Pln OE (n = 23) and WT (n = 17) mice.
Figure S2. Monomeric (m) PLN expression in WT diaphragm is lower than WT soleus and gluteus minimus.
Figure S3. Ca2+ uptake assays in the soleus (A) and gluteus minimus (B) muscles from Pln OE and WT mice.
Figure S4. Percent distribution of hybrid I/IIA (A), IIA/IIX (B), and IIX/IIB (C) fibers in the diaphragm muscles from WT and Pln OE mice (n = 5 per genotype).
Figure S5. Analysis of central nuclei (A) and fiber type distribution (B) and cross‐sectional area (CSA; C) in 10–12‐month‐old WT (n = 4) and Pln OE (n = 5) mice.
Figure S6. Calcineurin (CnA) and nuclear factor of activated T‐cell (NFAT) nuclear content in soleus (A, D), gluteus minimus (B, E), and diaphragm (C, F) muscles from Pln OE and WT mice. (G) Nuclear cell fraction purity demonstrated through Western blots from tibialis anterior muscles using Histone H2B and CuZnSOD as nuclear and cytosolic markers, respectively.
Acknowledgments
This work was supported by research grants from the Canadian Institutes of Health Research (CIHR; MOP 86618 and MOP 47296 to A.R.T.). I.C.S., was supported by postgraduate scholarship doctoral awards from the Natural Sciences and Engineering Research Council of Canada. V.A.F. was supported by a doctoral award from CIHR.
Fajardo V. A., Smith I. C., Bombardier E., Chambers P. J., Quadrilatero J., Tupling A. R., Diaphragm assessment in mice overexpressing phospholamban in slow‐twitch type I muscle fibers, Brain and Behavior, 2016; 6(6), e00470, doi: 10.1002/brb3.470
References
- Asahi, M. , Kurzydlowski K., Tada M., and MacLennan D. H.. 2002. Sarcolipin inhibits polymerization of phospholamban to induce superinhibition of sarco(endo)plasmic reticulum Ca2 + ‐ATPases (SERCAs). J. Biol. Chem. 277:26725–26728. [DOI] [PubMed] [Google Scholar]
- Bitoun, M. , Maugenre S., Jeannet P. Y., Lacene E., Ferrer X., Laforet P., et al. 2005. Mutations in dynamin 2 cause dominant centronuclear myopathy. Nat. Genet. 37:1207–1209. [DOI] [PubMed] [Google Scholar]
- Bloemberg, D. , and Quadrilatero J.. 2012. Rapid determination of myosin heavy chain expression in rat, mouse, and human skeletal muscle using multicolor immunofluorescence analysis. PLoS One 7:e35273. [DOI] [PMC free article] [PubMed] [Google Scholar]
- Bombardier, E. , Smith I. C., Vigna C., Fajardo V. A., and Tupling A. R.. 2013. Ablation of sarcolipin decreases the energy requirements for Ca2 + transport by sarco(endo)plasmic reticulum Ca2 + ‐ATPases in resting skeletal muscle. FEBS Lett. 587:1687–1692. [DOI] [PubMed] [Google Scholar]
- Buj‐Bello, A. , Laugel V., Messaddeq N., Zahreddine H., Laporte J., Pellissier J. F., et al. 2002. The lipid phosphatase myotubularin is essential for skeletal muscle maintenance but not for myogenesis in mice. Proc. Natl Acad. Sci. USA 99:15060–15065. [DOI] [PMC free article] [PubMed] [Google Scholar]
- Calvo, A. C. , Manzano R., Atencia‐Cibreiro G., Olivan S., Munoz M. J., Zaragoza P., et al. 2012. Genetic biomarkers for ALS disease in transgenic SOD1(G93A) mice. PLoS One 7:e32632. [DOI] [PMC free article] [PubMed] [Google Scholar]
- Chin, E. R. , Olson E. N., Richardson J. A., Yang Q., Humphries C., Shelton J. M., et al. 1998. A calcineurin‐dependent transcriptional pathway controls skeletal muscle fiber type. Genes Dev. 12:2499–2509. [DOI] [PMC free article] [PubMed] [Google Scholar]
- Coirault, C. , Attal P., Blanc F. X., Chemla D., and Lecarpentier Y.. 1999. Cross‐bridge kinetics in fatigued mouse diaphragm. Eur. Respir. J. 13:1055–1061. [DOI] [PubMed] [Google Scholar]
- Cowling, B. S. , Toussaint A., Amoasii L., Koebel P., Ferry A., Davignon L., et al. 2011. Increased expression of wild‐type or a centronuclear myopathy mutant of dynamin 2 in skeletal muscle of adult mice leads to structural defects and muscle weakness. Am. J. Pathol. 178:2224–2235. [DOI] [PMC free article] [PubMed] [Google Scholar]
- Cowling, B. S. , Chevremont T., Prokic I., Kretz C., Ferry A., Coirault C., et al. 2014. Reducing dynamin 2 expression rescues X‐linked centronuclear myopathy. J. Clin. Invest. 124:1350–1363. [DOI] [PMC free article] [PubMed] [Google Scholar]
- Dolmetsch, R. E. , Lewis R. S., Goodnow C. C., and Healy J. I.. 1997. Differential activation of transcription factors induced by Ca2 + response amplitude and duration. Nature 386:855–858. [DOI] [PubMed] [Google Scholar]
- Duhamel, T. A. , Green H. J., Stewart R. D., Foley K. P., Smith I. C., and Ouyang J.. 2007. Muscle metabolic, SR Ca(2 + ) ‐cycling responses to prolonged cycling, with and without glucose supplementation. J. Appl. Physiol. (1985) 103:1986–1998. [DOI] [PubMed] [Google Scholar]
- Dunn, S. E. , Burns J. L., and Michel R. N.. 1999. Calcineurin is required for skeletal muscle hypertrophy. J. Biol. Chem. 274:21908–21912. [DOI] [PubMed] [Google Scholar]
- Fajardo, V. A. , Bombardier E., Vigna C., Devji T., Bloemberg D., Gamu D., et al. 2013. Co‐expression of SERCA isoforms, phospholamban and sarcolipin in human skeletal muscle fibers. PLoS One 8:e84304. [DOI] [PMC free article] [PubMed] [Google Scholar]
- Fajardo, V. A. , Bombardier E., McMillan E., Tran K., Wadsworth B. J., Gamu D., et al. 2015. Phospholamban overexpression in mice causes a centronuclear myopathy‐like phenotype. Dis. Model. Mech. 8:999–1009. [DOI] [PMC free article] [PubMed] [Google Scholar]
- Frey, N. , Frank D., Lippl S., Kuhn C., Kogler H., Barrientos T., et al. 2008. Calsarcin‐2 deficiency increases exercise capacity in mice through calcineurin/NFAT activation. J. Clin. Invest. 118:3598–3608. [DOI] [PMC free article] [PubMed] [Google Scholar]
- Gorski, P. A. , Glaves J. P., Vangheluwe P., and Young H. S.. 2013. Sarco(endo)plasmic reticulum calcium ATPase (SERCA) inhibition by sarcolipin is encoded in its luminal tail. J. Biol. Chem. 288:8456–8467. [DOI] [PMC free article] [PubMed] [Google Scholar]
- Green, H. J. , Reichmann H., and Pette D.. 1984. Inter‐ and intraspecies comparisons of fibre type distribution and of succinate dehydrogenase activity in type I, IIA and IIB fibres of mammalian diaphragms. Histochemistry 81:67–73. [DOI] [PubMed] [Google Scholar]
- Jungbluth, H. , and Gautel M.. 2014. Pathogenic mechanisms in centronuclear myopathies. Front. Aging Neurosci. 6:339. [DOI] [PMC free article] [PubMed] [Google Scholar]
- Jungbluth, H. , Wallgren‐Pettersson C., and Laporte J.. 2008. Centronuclear (myotubular) myopathy. Orphanet J. Rare Dis. 3:26. [DOI] [PMC free article] [PubMed] [Google Scholar]
- Lamboley, C. R. , Murphy R. M., McKenna M. J., and Lamb G. D.. 2014. Sarcoplasmic reticulum Ca2 + uptake and leak properties, and SERCA isoform expression, in type I and type II fibres of human skeletal muscle. J. Physiol. 592:1381–1395. [DOI] [PMC free article] [PubMed] [Google Scholar]
- Liu, N. , Bezprozvannaya S., Shelton J. M., Frisard M. I., Hulver M. W., McMillan R. P., et al. 2011. Mice lacking microRNA 133a develop dynamin 2‐dependent centronuclear myopathy. J. Clin. Invest. 121:3258–3268. [DOI] [PMC free article] [PubMed] [Google Scholar]
- McMillan, E. M. , and Quadrilatero J.. 2011. Differential apoptosis‐related protein expression, mitochondrial properties, proteolytic enzyme activity, and DNA fragmentation between skeletal muscles. Am. J. Physiol. Regul. Integr. Comp. Physiol. 300:R531–R543. [DOI] [PubMed] [Google Scholar]
- Mendez, J. K. A. 1960. Density and composition of mammalian muscle. Metabolism 9:184–188. [Google Scholar]
- Michel, R. N. , Dunn S. E., and Chin E. R.. 2004. Calcineurin and skeletal muscle growth. Proc. Nutr. Soc. 63:341–349. [DOI] [PubMed] [Google Scholar]
- Morita, T. , Hussain D., Asahi M., Tsuda T., Kurzydlowski K., Toyoshima C., et al. 2008. Interaction sites among phospholamban, sarcolipin, and the sarco(endo)plasmic reticulum Ca(2 + )‐ATPase. Biochem. Biophys. Res. Commun. 369:188–194. [DOI] [PubMed] [Google Scholar]
- Nakagawa, O. , Arnold M., Nakagawa M., Hamada H., Shelton J. M., Kusano H., et al. 2005. Centronuclear myopathy in mice lacking a novel muscle‐specific protein kinase transcriptionally regulated by MEF2. Genes Dev. 19:2066–2077. [DOI] [PMC free article] [PubMed] [Google Scholar]
- Odermatt, A. , Becker S., Khanna V. K., Kurzydlowski K., Leisner E., Pette D., et al. 1998. Sarcolipin regulates the activity of SERCA1, the fast‐twitch skeletal muscle sarcoplasmic reticulum Ca2 + ‐ATPase. J. Biol. Chem. 273:12360–12369. [DOI] [PubMed] [Google Scholar]
- Ottenheijm, C. A. , Fong C., Vangheluwe P., Wuytack F., Babu G. J., Periasamy M., et al. 2008. Sarcoplasmic reticulum calcium uptake and speed of relaxation are depressed in nebulin‐free skeletal muscle. FASEB J. 22:2912–2919. [DOI] [PMC free article] [PubMed] [Google Scholar]
- Polla, B. , D'Antona G., Bottinelli R., and Reggiani C.. 2004. Respiratory muscle fibres: specialisation and plasticity. Thorax 59:808–817. [DOI] [PMC free article] [PubMed] [Google Scholar]
- Romero, N. B. 2010. Centronuclear myopathies: a widening concept. Neuromuscul. Disord. 20:223–228. [DOI] [PubMed] [Google Scholar]
- Schiaffino, S. , Gorza L., Sartore S., Saggin L., Ausoni S., Vianello M., et al. 1989. Three myosin heavy chain isoforms in type 2 skeletal muscle fibres. J. Muscle Res. Cell Motil. 10:197–205. [DOI] [PubMed] [Google Scholar]
- Schneider, J. S. , Shanmugam M., Gonzalez J. P., Lopez H., Gordan R., Fraidenraich D., et al. 2013. Increased sarcolipin expression and decreased sarco(endo)plasmic reticulum Ca2 + uptake in skeletal muscles of mouse models of Duchenne muscular dystrophy. J. Muscle Res. Cell Motil. 34:349–356. [DOI] [PubMed] [Google Scholar]
- Seidler, N. W. , Jona I., Vegh M., and Martonosi A.. 1989. Cyclopiazonic acid is a specific inhibitor of the Ca2 + ‐ATPase of sarcoplasmic reticulum. J. Biol. Chem. 264:17816–17823. [PubMed] [Google Scholar]
- Semsarian, C. , Wu M. J., Ju Y. K., Marciniec T., Yeoh T., Allen D. G., et al. 1999. Skeletal muscle hypertrophy is mediated by a Ca2 + ‐dependent calcineurin signalling pathway. Nature 400:576–581. [DOI] [PubMed] [Google Scholar]
- Sharma, M. C. , Jain D., Sarkar C., and Goebel H. H.. 2009. Congenital myopathies–a comprehensive update of recent advancements. Acta Neurol. Scand. 119:281–292. [DOI] [PubMed] [Google Scholar]
- Smith, B. K. , Goddard M., and Childers M. K.. 2014. Respiratory assessment in centronuclear myopathies. Muscle Nerve 50:315–326. [DOI] [PMC free article] [PubMed] [Google Scholar]
- Song, Q. , Young K. B., Chu G., Gulick J., Gerst M., Grupp I. L., et al. 2004. Overexpression of phospholamban in slow‐twitch skeletal muscle is associated with depressed contractile function and muscle remodeling. FASEB J. 18:974–976. [DOI] [PubMed] [Google Scholar]
- Talmadge, R. J. , Otis J. S., Rittler M. R., Garcia N. D., Spencer S. R., Lees S. J., et al. 2004. Calcineurin activation influences muscle phenotype in a muscle‐specific fashion. BMC Cell Biol. 5:28. [DOI] [PMC free article] [PubMed] [Google Scholar]
- Timmerman, L. A. , Clipstone N. A., Ho S. N., Northrop J. P., and Crabtree G. R.. 1996. Rapid shuttling of NF‐AT in discrimination of Ca2 + signals and immunosuppression. Nature 383:837–840. [DOI] [PubMed] [Google Scholar]
- Tupling, R. , and Green H.. 2002. Silver ions induce Ca2 + release from the SR in vitro by acting on the Ca2 + release channel and the Ca2 + pump. J. Appl. Physiol. (1985) 92:1603–1610. [DOI] [PubMed] [Google Scholar]
- Tupling, A. R. , Bombardier E., Gupta S. C., Hussain D., Vigna C., Bloemberg D., et al. 2011. Enhanced Ca2 + transport and muscle relaxation in skeletal muscle from sarcolipin‐null mice. Am. J. Physiol. Cell Physiol. 301:C841–C849. [DOI] [PMC free article] [PubMed] [Google Scholar]
- Zubrzycka‐Gaarn, E. , MacDonald G., Phillips L., Jorgensen A. O., and MacLennan D. H.. 1984. Monoclonal antibodies to the Ca2 + + Mg2 + ‐dependent ATPase of sarcoplasmic reticulum identify polymorphic forms of the enzyme and indicate the presence in the enzyme of a classical high‐affinity Ca2 + binding site. J. Bioenerg. Biomembr. 16:441–464. [DOI] [PubMed] [Google Scholar]
Associated Data
This section collects any data citations, data availability statements, or supplementary materials included in this article.
Supplementary Materials
Figure S1. Lifespan of Pln OE (n = 23) and WT (n = 17) mice.
Figure S2. Monomeric (m) PLN expression in WT diaphragm is lower than WT soleus and gluteus minimus.
Figure S3. Ca2+ uptake assays in the soleus (A) and gluteus minimus (B) muscles from Pln OE and WT mice.
Figure S4. Percent distribution of hybrid I/IIA (A), IIA/IIX (B), and IIX/IIB (C) fibers in the diaphragm muscles from WT and Pln OE mice (n = 5 per genotype).
Figure S5. Analysis of central nuclei (A) and fiber type distribution (B) and cross‐sectional area (CSA; C) in 10–12‐month‐old WT (n = 4) and Pln OE (n = 5) mice.
Figure S6. Calcineurin (CnA) and nuclear factor of activated T‐cell (NFAT) nuclear content in soleus (A, D), gluteus minimus (B, E), and diaphragm (C, F) muscles from Pln OE and WT mice. (G) Nuclear cell fraction purity demonstrated through Western blots from tibialis anterior muscles using Histone H2B and CuZnSOD as nuclear and cytosolic markers, respectively.