

Abstract
Objective:
The molecular and cellular basis of structural and functional abnormalities of the hippocampus found in schizophrenia is currently unclear. Postnatal neurogenesis contributes to hippocampal function in animal models and is correlated with hippocampal volume in primates. Reduced hippocampal cell proliferation has been previously reported in schizophrenia, which may contribute to hippocampal dysfunction.
Method:
We measured the cell proliferation marker, Ki67, in post-mortem hippocampal tissue from patients with schizophrenia (n = 10) and matched controls (n = 16). Ki67-labelled cells were counted within the dentate gyrus and hilus on sections taken from the anterior hippocampus.
Results:
We replicated the finding of a significant reduction in Ki67+ cells/mm2 in schizophrenia cases compared to controls (t24 = 2.1, p = 0.023). In our relatively small sample, we did not find a relationship between Ki67+ cells and age overall, or between Ki67 + cells and duration of illness or antipsychotic treatment in people with schizophrenia.
Conclusion:
Our results confirm that reduced hippocampal cell proliferation may be present in schizophrenia. Restoring hippocampal neurogenesis may be a potential therapeutic target for the treatment of hippocampal dysfunction in schizophrenia.
Keywords: Neurogenesis, schizophrenia, hippocampus, proliferation, Ki67
Introduction
The hippocampus in schizophrenia is characterised by functional and structural abnormalities. It is well known that the hippocampus plays critical roles in learning and memory. People with schizophrenia experience deficits in hippocampal-mediated memory functions, such as declarative memory (Titone et al., 2004; Weiss and Heckers, 2001). Reduced performance in episodic memory retrieval tasks is associated with decreased hippocampal activity in schizophrenia (Heckers et al., 1998; Weiss et al., 2003), and the hippocampus is over activated when patients are experiencing auditory hallucinations (Silbersweig et al., 1995). Structural magnetic resonance imaging (MRI) studies indicate a reduction in the volume of the hippocampus of 4–8% (for meta-analysis, see Nelson et al., 1998; Shenton et al., 2001). Volume reductions of the hippocampus are correlated with reduced verbal and spatial memory performance (Gur et al., 2000; Sanfilipo et al., 2002). The molecular and cellular substrates behind functional and structural changes in schizophrenia remain unclear, as there appears to be no change in overall cell number in the hippocampus in schizophrenia (Heckers et al., 1991; Walker et al., 2002).
Although the total number of hippocampal neurons may not be detectably reduced in schizophrenia, there is some evidence for a reduction in adult-born hippocampal granule cell neurons in schizophrenia (Reif et al., 2006). New neurons become functionally integrated into hippocampal circuitry throughout life in humans (Toni et al., 2008; Van Praag et al., 2002). In animals, adult hippocampal neurogenesis has been shown to contribute to learning and memory function, in particular contextual and spatial learning and can correlate positively with hippocampus volume (Aizawa et al., 2009; Allen et al., 2014; Snyder et al., 2005; Winocur et al., 2006). Reduced adult neurogenesis has been suggested as a component of the cellular substrate of hippocampal dysfunction in schizophrenia (DeCarolis and Eisch, 2010; Kempermann et al., 2008; Reif et al., 2007).
Several studies have examined adult hippocampal neurogenesis in post-mortem brains from people with schizophrenia; however, the results are not conclusive. One study found a 20–95% reduction in hilar cells expressing the highly glycosylated form of the neural cell adhesion molecule (PSA-NCAM), a marker of immature neurons, in the absence of changes in total cell number (Barbeau et al., 1995). This reduction was found in most (80%) but not all of the post-mortem schizophrenia brains in the cohort, and one schizophrenia case showed an increase in PSA-NCAM+ neurons relative to controls. A second study, in an independent cohort, found an approximate 50% decrease in the number of cells positive for the proliferation marker Ki67 in the granule cell layer (GCL) of the dentate gyrus in schizophrenia, although two cases with schizophrenia were excluded due to very high levels of proliferation (Reif et al., 2006). However, a more recent study in the same post-mortem cohort did not find any alteration in cell proliferation as measured by the marker proliferating cell nuclear antigen (PCNA) (Walton et al., 2012). Although Ki67 and PCNA are not specific neuronal markers, reduced expression in cells within known neurogenic regions of the hippocampus may also be suggestive of a deficit in neurogenesis.
This study aimed to investigate changes in cell proliferation (Ki67+ cells) in an independent cohort of post-mortem brains from people with schizophrenia. As structural changes in the hippocampus are found in the earliest stages of schizophrenia (Buehlmann et al., 2010; Vita et al., 2006), we also sought to determine whether any changes in cell proliferation were also found in early schizophrenia by investigating the relationship between cell proliferation and duration of illness. As hippocampal neurogenesis is known to be down regulated across ageing in humans (Knoth et al., 2010), we also sought to determine whether cell proliferation would be related to age. There is mixed evidence from rat models, suggesting that antipsychotics may modulate postnatal hippocampal neurogenesis (Halim et al., 2004; Kodama et al., 2004). As all of the schizophrenia cases in our cohort were receiving antipsychotic treatment, we also sought to determine whether cell proliferation would correlate with antipsychotic treatment.
Materials and methods
Human post-mortem brain samples
Hippocampus tissue from people with schizophrenia (n = 10) and controls (n = 16) was obtained (New South Wales Tissue Resource Centre, Sydney, Australia). One fresh-frozen hemisphere (randomly left or right) was available for each case, with the opposing hemisphere fixed, although overall, both right and left hemispheres were assessed in patients and controls. This study was approved by the Human Research Ethics Committee of the University of New South Wales (HREC 12435).
Tissue preparation and cohort selection
Blocks containing the anterior hippocampus were sectioned on a cryostat at 14 µm and thaw mounted onto glass slides (38 × 75 mm, Brain Research Laboratories). Sections were counterstained with thionin, and an assessment made of the tissue quality, including localisation of the dentate gyrus. The final cohort was not significantly different in age, post-mortem interval (PMI) or brain pH (Table 1). The schizophrenia cases had an average freezer storage time of 3098.40 days compared to controls which had an average of 1402.19 days (i.e. a difference of 4.6 years).
Table 1.
Demographics of control schizophrenia groups.
| Control, n = 16 | Schizophrenia, n = 10 | |
|---|---|---|
| Gender | 3F, 13M | 5F, 5M |
| Age (range) | 55.00 ± 15.4 (21–81) | 62.70 ± 8.2 (55–75) |
| pH (PFC) (range) | 6.59 ± 0.24 (6.22–6.92) | 6.54 ± 0.26 (6.14–6.85) |
| PMI (hours) (range) | 32.84 ± 9.48 (10.0–50.0) | 31.55 ± 18.02 (12.5–72.0) |
| Freezer storage time (days) (range) | 1402.19 ± 10004.02 (322–3786) | 3098.40 ± 728.52 (1596–4277) |
| Antidepressants | 7Y, 3N | |
| Age of onset (years) (range) | 25.2 ± 8.51 (17–40) | |
| Duration of illness (years) (range) | 37.50 ± 10.07 (17–52) | |
| Daily Chlorpromazine mean (mg) (range) | 949.65 ± 657.88 (300.0–2362.5) | |
| Lifetime Chlorpromazine (mg) (range) | 13,390,645.50 ± 10,562,985.73 (3,723,000.00–32,767,875.00) |
PFC: prefrontal cortex; PMI: post-mortem interval.
Immunohistochemistry
Immunohistochemistry was performed for Ki67, a marker of cell proliferation (Gerdes et al., 1984), and for a mature neuronal marker NeuN (Gittins and Harrison, 2004) on 14-µm frozen sections, using standard 3,3′-diaminobenzidine (DAB) protocols. All washes were performed in 1× phosphate buffered saline (PBS, 152 mmol L−1 NaCl, 15.6 mmol L−1 K2HPO4, 2.98 mmol L−1 KCL, 1.85 mmol KH2PO4, pH 7.4) for 3 × 5 minutes. Briefly, sections were fixed in 4% paraformaldehyde in PBS for 10 minutes at 4°C. Sections were washed in PBS, treated for 20 minutes at room temperature (RT) with methanol +3% H2O2 (3:1) solution and incubated with 10% normal goat serum in diluent (0.05% bovine serum albumin, 0.3% Triton X-100 in PBS) for 1 hour at RT. Sections were incubated with rabbit anti-Ki67 primary antibody (1:200 in diluent; Abcam, Cambridge, UK; Cat # ab15580) or mouse anti-NeuN primary antibody (1:1000 in diluent, Millipore, Temecula, California; MAB377) overnight at 4°C, followed by goat anti-rabbit/goat anti-mouse IgG biotinylated secondary antibody (1:200 or 1:500, respectively; Vector Laboratories, Burlingame, CA) for 1 hour at RT. Sections were incubated for 1 hour at RT in avidin–biotin–peroxidase complex (Vectastain ABC kit; Vector Laboratories, Burlingame, CA) and treated with DAB (12 mmol L−1 final concentration in PBS with 0.003% H2O2; Sigma–Aldrich, St Louis, MO) for 5–10 minutes. Sections were Nissl counterstained (~5 minutes exposure to 0.02% thionin), dehydrated in ethanol, cleared in xylene and cover slipped using Permount (Fischer Scientific, Pittsburgh, PA). Control slides were incubated with normal sera without primary antibody for each immunohistochemical assay. Three slides spaced 1.34 mm apart within the anterior hippocampus were used per case for Ki67 staining, and one slide per case for NeuN staining.
Area measurements and Ki67 cell counting
StereoInvestigator (MBF Biosciences, Wilson, VT) was used to measure the cross-sectional area of the subgranular zone (SGZ)/GCL and hilus on each Ki67 stained slide. The boundaries of the hippocampal subfields were defined according to the Atlas of the Human Brain (Mai et al., 2007). The hilus was defined as the area between the blades of the GCL. As the dentate gyrus is typically ‘C’ shaped at this level of the anterior hippocampus, a straight line drawn between the two open ends of the GCL was used to consistently define the boundary of the hilus/CA3 (Figure 1).
Figure 1.
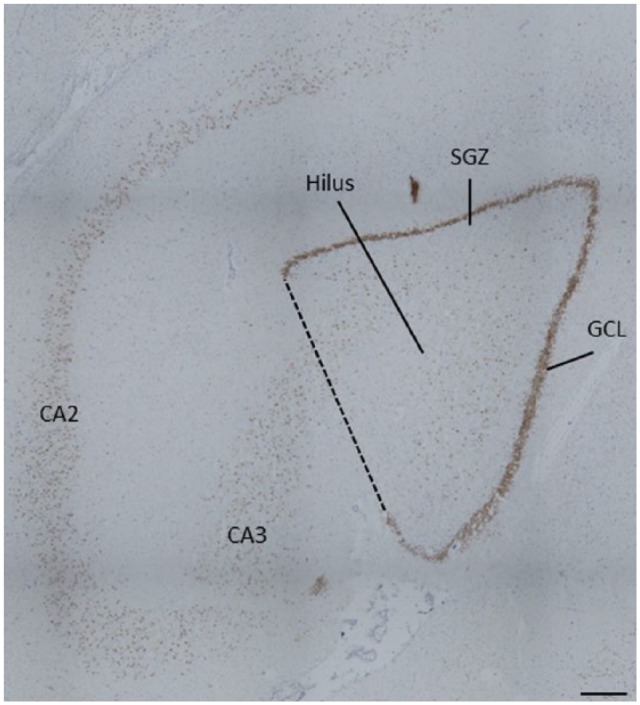
Representative boundary of region of interest. Ki67+ cells were counted within the region bounded by the granule cell layer (dark brown band of cells), and including the subgranular zone (two-cell wide band under the granule cell layer) and hilus. A straight line drawn between the open ends of the granule cell layer was used to consistently define the boundary of the hilus/CA3 (dashed line).
GCL: granule cell layer; SGZ: subgranular zone.
All Ki67+ cells within this region were counted using a Nikon Eclipse 80i light microscope, at 200× magnification initially, and immunopositive cells were confirmed at 400×. Positively labelled cells were identified as those having dark brown nuclear staining. As the total number of Ki67+ cells was low, cell counts within in the SGZ/GCL and hilus were combined and not analysed separately. We calculated the density of Ki67+ cells within SGZ/GCL/hilus on each slide (Ki67+ cells/mm2) and averaged this across three slides/case. Images of each slide were taken at 200× magnification using StereoInvestigator. Nuclear width measurements were taken using ImageJ, and average nuclear size was calculated for each case. To compensate for the potential influence of cell size, the Abercrombie correction was applied to Ki67 cell counts (Abercrombie, 1946).
NeuN density measurements
Images of each slide were taken at 40× magnification using StereoInvestigator. All images were taken using the same brightness and contrast settings. Cell density measurements were performed with ImageJ (National Institutes of Health, Bethesda, MD). All images underwent standardised parameter setting of illumination to hold the brightness and contrast constant, and then an automatic threshold was applied to identify immunopositive cells. A box of 250 × 250 µm was placed in the approximate centre of the hilus, and a random number table was used to move the box left/right and up/down (from 0 to 125 µm). An automatic count of NeuN positive cells within the box was performed. This count was converted to a density of NeuN+ cells/mm2.
Statistical analysis
Demographic data are presented as the mean ± standard deviation. A one-tailed independent sample t-test was used to determine whether reduced Ki67 cell density would be found in schizophrenia vs control for Ki67, based on a prior hypothesis that Ki67 cell density would be reduced in schizophrenia. A two-tailed independent sample t-test was used to determine group differences in Ki67 nuclear size, NeuN density and differences in Ki67 cell density between sexes and between antidepressant users and non-users. Pearson’s regression was used to determine the relationship between Ki67+ cell density and demographic/tissue quality factors. The criteria for significance was set at p < 0.05. All data were analysed with SPSS 22 (IBM), and all graphs were generated with GraphPad Prism 6 (GraphPad Software, La Jolla, CA).
Results
Cell proliferation in schizophrenia and controls
As expected, Ki67+ cells were found throughout the hilus (Figure 2[A] and [B]), GCL (Figure 2[B]) and SGZ. There was no significant difference in the mean nuclear size of Ki67+ cells (control = 5.27 µm, schizophrenia = 5.61 µm, t18 = 0.58, p = 0.57). When a correction for nuclear size was applied to Ki67+ counts, in schizophrenia cases, there was an average of 0.042 Ki67+ cells/mm2 SGZ/GCL/hilus. In controls, there was an average of 0.106 Ki67+/mm2 SGZ/GCL/hilus. The difference (60% reduction) in Ki67+ cell/mm2 compared to controls was statistically significant (t24 = 2.098, p = 0.023) (Figure 3). Non-corrected cell counts were also significantly different between schizophrenia cases and controls (schizophrenia = 0.059 Ki67+ cells/mm2 SGZ/GCL/hilus, control = 0.148 Ki67+ cells/mm2 SGZ/GCL/hilus, t24 = 2.0, p = 0.027).
Figure 2.
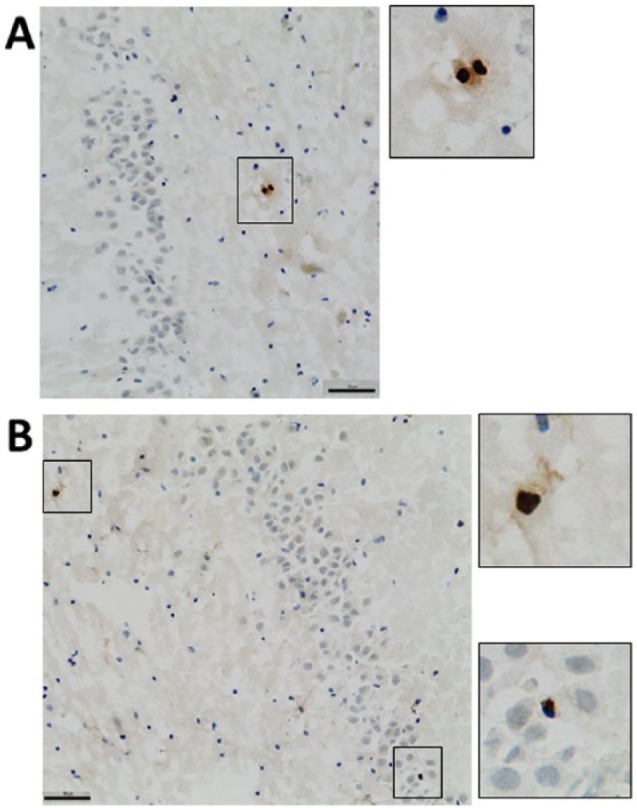
Representative photomicrographs of Ki67 expression in the in hippocampus. (A) A pair of Ki67+ cells (dark brown) in the hilus of the hippocampus. (B) Ki67+ cells in the hilus (upper inset) and granule cell layer (lower inset). Scale bar = 50 µm.
Figure 3.
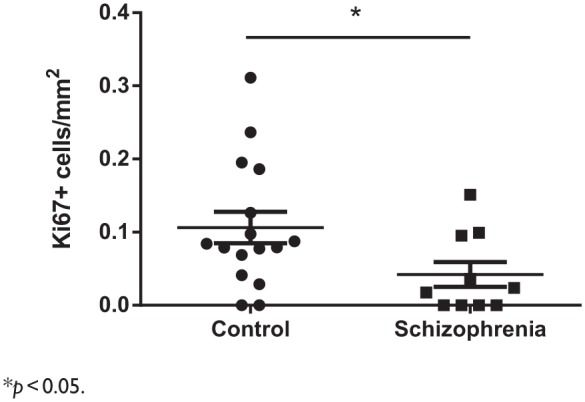
Hippocampal cell proliferation in schizophrenia and controls. Ki67+ cell density is reduced in the hippocampus schizophrenia cases compared to controls.
*p < 0.05.
NeuN density in schizophrenia and controls
A representative example of NeuN staining is shown in Figure 4. In the hilus, there was an average of 812.3 NeuN+ cells/mm2 in controls and 836.8 NeuN+ cells/mm2 in schizophrenia cases. There was no significant difference in NeuN+ cell density in the hilus between controls and schizophrenia (t21 = 0.18, p > 0.05) (data not shown).
Figure 4.
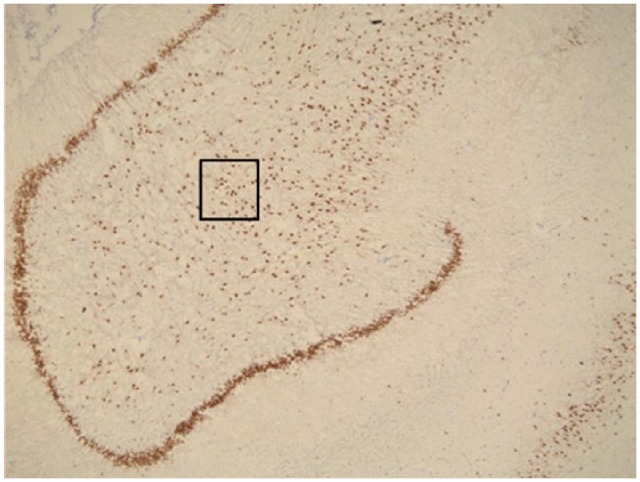
Representative photomicrograph of NeuN expression in the hippocampus. NeuN+ neurons (dark brown) in the granule cell layer of the dentate gyrus (thick band of cells), and in the hilus. The black box indicates the size of the counting box used, and the location of cell counting in the hilus. There was no significant difference in the density of NeuN+ cells in the hilus between schizophrenia cases and controls.
Cell proliferation and demographic factors
Within both schizophrenia and control cases combined, there was no significant association with average Ki67+ cells/mm2 and age (p > 0.05). There was no association with age and Ki67 expression in either controls or schizophrenia cases when assessed separately (both p > 0.05). Within schizophrenia cases, there was no significant association of average Ki67+ cells/mm2 and age of onset, duration of illness or daily chlorpromazine equivalent or lifetime chlorpromazine equivalent (all p > 0.05) (Table 2). There was no difference in average Ki67+ cells/mm2 between men and women, either in the cases and controls or just among the schizophrenia cases (both p > 0.05, data not shown). There was no significant difference in cell proliferation between schizophrenia cases that were reported to be taking antidepressant medication at the time of death (p > 0.05, data not shown).
Table 2.
Associations between cell proliferation and tissue quality and demographic factors.
| r-value | p-value | |
|---|---|---|
| Age (years) | 0.065 | 0.75 |
| pH (PFC) | 0.136 | 0.51 |
| PMI (hours) | 0.029 | 0.89 |
| Freezer storage time (days) | 0.31 | 0.12 |
| Age of onset (years) | 0.57 | 0.087 |
| Duration of illness (years) | 0.44 | 0.20 |
| Daily Chlorpromazine, mean (mg) | 0.12 | 0.74 |
| Lifetime chlorpromazine, mean (mg) | 0.20 | 0.58 |
PFC: pre-frontal cortex; PMI: post-mortem interval.
Cell proliferation and tissue quality factors
Within both schizophrenia and control cases combined, there was no significant association with average Ki67+ cells/mm2 and PMI or freezer storage time, or PMI (all p > 0.05) (Table 2).
Discussion
We find a decrease in cell proliferation in the anterior hippocampus of people with schizophrenia, confirming the results of previous studies that have suggested a deficit in hippocampal cell proliferation and of neurogenesis in schizophrenia (Barbeau et al., 1995; Reif et al., 2006) in an independent cohort. Our results are consistent with those of Reif; however, we found a slightly larger decrease in Ki67 expression (60% in the current study vs 50% in Reif et al. 2006). There is extensive evidence of a reduction in hippocampal volume in schizophrenia (Nelson et al., 1998; Shenton et al., 2001), suggesting that reductions in Ki67 cell density reported in the present study and by Reif et al. (2006) may, in fact, represent an underestimation of the total deficit in the number of cells undergoing cell proliferation in the hippocampus of people with schizophrenia. However, our findings were in contrast with a study that assessed an alternative proliferation marker, PCNA (Walton et al., 2012). In comparison to PCNA, Ki67 shows a better correlation to the gold standard marker of cell proliferation, bromodeoxyuridine (BrdU) (Muskhelishvili et al., 2003) and Ki67 appears restricted to dividing cells (Ohta and Ichimura, 2000; Scholzen and Gerdes, 2000), while PCNA can also be expressed in resting cells (Ohta and Ichimura, 2000). Thus, PCNA may be a less accurate marker of cell proliferation compared to Ki67. However, Ki67 expression appears to be more strongly influenced by ageing compared to PCNA (Knoth et al., 2010) and may be less reliable for use in brains from older people.
We did not find a relationship between cell proliferation and age, whether examining all samples together or cases and controls separately. There is strong evidence in humans that hippocampal neurogenesis is reduced across the lifespan (Knoth et al., 2010; Manganas et al., 2007; Spalding et al., 2013). Our final cohort did not have a large age span, with all schizophrenia cases and the majority of controls at least 50 years old or older, and detecting a relationship with age may have been difficult with such a limited age range. There is some evidence that reductions in hippocampal volume become slightly worse over the course of the schizophrenia (Chakos et al., 2005; Velakoulis et al., 2006). Overall, we did not find a relationship with duration of illness and our proliferation marker in schizophrenia cases. However, our cohort largely consisted of chronic patients, with the majority (9/10) having experienced the illness for more than 20 years. Larger post-mortem cohorts with a more extensive age range will be required to address questions of timing and progression of decreased proliferation and possible decreased neurogenesis in schizophrenia.
We did not find a relationship between antipsychotic treatment (measured as either daily mean dose, dose at death or total lifetime exposure) and cell proliferation, consistent with a previous study that also did not find a relationship between PCNA expression and lifetime exposure to antipsychotics (Walton et al., 2012). Together, these results suggest that decreased neurogenesis in schizophrenia may not be a direct result of antipsychotic treatment. Studies in animals suggest that antipsychotics can alter aspects of neurogenesis, but that it may depend on the type of antipsychotic and the experimental paradigms. The typical antipsychotic haloperidol generally does not influence cell proliferation in the rat (Halim et al., 2004; Schmitt et al., 2004; Wakade et al., 2002). Some studies have found atypical antipsychotics olanzapine and clozapine increase hippocampal cell proliferation and new neuronal survival in rats (Halim et al., 2004; Kodama et al., 2004); however, other studies find no effect of antipsychotic treatment (Schmitt et al., 2004; Wakade et al., 2002). However, the effect of antipsychotic medication on hippocampal neurogenesis can differ under conditions that model of schizophrenia risk factors, such as stress (reviewed in Keilhoff et al., 2012), so results in normal rats may not accurately reflect how antipsychotics may modulate cell proliferation in schizophrenia. We standardised doses in our study to chlorpromazine equivalent; however, the subjects in our study were mixed between typical and atypical antipsychotic use. If these have a heterogeneous effect on cell proliferation as has been found in animals, and due to our small sample size, it may be difficult to determine an antipsychotic effect.
There are important limitations to this study that need to be considered when interpreting our findings. Our final cohort was not balanced with respect to freezer storage time; as schizophrenia cases display a significantly longer storage period, future studies would need to match more carefully on this factor. In addition, Ki67+ cells were completely absent in four schizophrenia cases and two controls. This may reflect a complete failure to detect the antigen due to tissue quality factors, rather than an absence of any proliferation in these brains. However, NeuN+ cell density did not differ between cases and controls, and was not related to freezer storage time, suggesting that our ability to detect protein in general was not influenced by diagnosis or freezer storage time and that there may indeed be a specific deficit in Ki67+ cells in schizophrenia. An absence of Ki67+ cells does not suggest that cell proliferation is completely absent from these cases, as it is likely that there exists dividing cells outside our surveyed area. In our study, tissue availability was limited to a discrete region of anterior hippocampus. A definitive measure of the absolute number of proliferating cells by stereological assessment would require access to the entire hippocampus, which may not be easily achieved due to high demand for human post-mortem hippocampus.
While Ki67 is not a specific neuronal marker, in non-human primates, the majority (~60–80%) of adult generated cells in the hippocampus express neuronal markers (Allen et al., 2014; Jabes et al., 2010; Kohler et al., 2011). Reduced Ki67 labelling most likely represents decreased neurogenesis (Reif et al., 2006), and the immature neuronal marker PSA-NCAM also shows reductions (Barbeau et al., 1995). Decreased hippocampal neurogenesis may lead to specific cognitive deficits in people with schizophrenia (Das et al., 2014). A smaller but significant proportion of postnatally generated hippocampal cells express astrocytic markers (Jabes et al., 2010). Adult generated astrocytes are known to play a supportive role in postnatal hippocampal neurogenesis (Shapiro et al., 2005; Song et al., 2002), and a reduction in astrogenesis in schizophrenia could also contribute to neuropathological changes within the hippocampus. Future studies ideally should assess multiple proliferation and immature neuronal markers in the same samples in order to confirm whether reduced cell proliferation in neurogenic regions results in deficits in hippocampal neurogenesis. Measurement of neurogenesis in living patients has the potential to be a future biomarker for schizophrenia (Ho et al., 2013), and increasing adult hippocampal neurogenesis may represent a target for treatment (DeCarolis and Eisch, 2010; Jun et al., 2012). Effective and safe treatments will rely on the identification factors that regulate neurogenesis, and how these influence aspects of neurogenesis across the course of the illness.
Acknowledgments
We thank Debora Rothmond, Michelle Hill and Roxanne Cadiz for technical assistance. We express our gratitude to the individuals who donated post-mortem tissues used in this study, and their families.
Footnotes
Declaration of interest: The authors report no conflicts of interest. The authors alone are responsible for the content and writing of the paper.
Funding: This work was supported by Schizophrenia Research Institute (utilising infrastructure funding from the NSW Ministry of Health and the Macquarie Group Foundation), the University of New South Wales and Neuroscience Research Australia. The New South Wales Tissue Resource Centre at the University of Sydney is supported by the National Health and Medical Research Council of Australia, Schizophrenia Research Institute and National Institute of Alcohol Abuse and Alcoholism (grant number R24AA012725). C Shannon Weickert is a recipient of a National Health and Medical Research Council (Australia) Senior Research Fellowship (#1021970).
References
- Abercrombie M. (1946) Estimation of nuclear population from microtome sections. Anatomical Record 94: 239–247. [DOI] [PubMed] [Google Scholar]
- Aizawa K, Ageyama N, Yokoyama C, et al. (2009) Age-dependent alteration in hippocampal neurogenesis correlates with learning performance of macaque monkeys. Experimental Animals 58: 403–407. [DOI] [PubMed] [Google Scholar]
- Allen KM, Fung SJ, Rothmond DA, et al. (2014) Gonadectomy increases neurogenesis in the male adolescent rhesus macaque hippocampus. Hippocampus 24: 225–238. [DOI] [PubMed] [Google Scholar]
- Barbeau D, Liang JJ, Robitalille Y, et al. (1995) Decreased expression of the embryonic form of the neural cell adhesion molecule in schizophrenic brains. Proceedings of the National Academy of Sciences of the United States of America 92: 2785–2789. [DOI] [PMC free article] [PubMed] [Google Scholar]
- Buehlmann E, Berger GE, Aston J, et al. (2010) Hippocampus abnormalities in at risk mental states for psychosis? A cross-sectional high resolution region of interest magnetic resonance imaging study. Journal of Psychiatric Research 44: 447–453. [DOI] [PubMed] [Google Scholar]
- Chakos MH, Schobel SA, Gu H, et al. (2005) Duration of illness and treatment effects on hippocampal volume in male patients with schizophrenia. British Journal of Psychiatry 186: 26–31. [DOI] [PubMed] [Google Scholar]
- Das T, Ivleva EI, Wagner AD, et al. (2014) Loss of pattern separation performance in schizophrenia suggests dentate gyrus dysfunction. Schizophrenia Research 159: 193–197. [DOI] [PMC free article] [PubMed] [Google Scholar]
- DeCarolis NA, Eisch AJ. (2010) Hippocampal neurogenesis as a target for the treatment of mental illness: A critical evaluation. Neuropharmacology 58: 884–893. [DOI] [PMC free article] [PubMed] [Google Scholar]
- Gerdes J, Lemke H, Baisch H, et al. (1984) Cell cycle analysis of a cell proliferation-associated human nuclear antigen defined by the monoclonal antibody Ki-67. Journal of Immunology 133: 1710–1715. [PubMed] [Google Scholar]
- Gittins R, Harrison PJ. (2004) Neuronal density, size and shape in the human anterior cingulate cortex: A comparison of Nissl and NeuN staining. Brain Research Bulletin 63: 155–160. [DOI] [PubMed] [Google Scholar]
- Gur RE, Gur RE, Turetsky BI, et al. (2000) Temporolimbic volume reductions in schizophrenia. Archives of General Psychiatry 57: 769–775. [DOI] [PubMed] [Google Scholar]
- Halim ND, Shannon Weickert C, McClintock BW, et al. (2004) Effects of chronic haloperidol and clozapine treatment on neurogenesis in the adult rat hippocampus. Neuropsychopharmacology 29: 1063–1069. [DOI] [PubMed] [Google Scholar]
- Heckers S, Heinsen H, Geiger B, et al. (1991) Hippocampal neuron number in schizophrenia. A stereological study. Archives of General Psychiatry 48: 1002–1008. [DOI] [PubMed] [Google Scholar]
- Heckers S, Rauch SL, Goff D, et al. (1998) Impaired recruitment of the hippocampus during conscious recollection in schizophrenia. Nature Neuroscience 1: 318–323. [DOI] [PubMed] [Google Scholar]
- Ho NF, Hooker JM, Sahay A, et al. (2013) In vivo imaging of adult human hippocampal neurogenesis: Progress, pitfalls and promise. Molecular Psychiatry 18: 404–416. [DOI] [PMC free article] [PubMed] [Google Scholar]
- Jabes A, Lavenex PB, Amaral DG, et al. (2010) Quantitative analysis of postnatal neurogenesis and neuron number in the macaque monkey dentate gyrus. European Journal of Neuroscience 31: 273–285. [DOI] [PMC free article] [PubMed] [Google Scholar]
- Jun H, Mohammed Qasim Hussaini S, Rigby MJ, et al. (2012) Functional role of adult hippocampal neurogenesis as a therapeutic strategy for mental disorders. Neural Plasticity 2012: 854285. [DOI] [PMC free article] [PubMed] [Google Scholar]
- Keilhoff G, Fusar-Poli P, Becker A. (2012) Effects of antipsychotics on dentate gyrus stem cell proliferation and survival in animal models: A critical update. Neural Plasticity 2012: 832757. [DOI] [PMC free article] [PubMed] [Google Scholar]
- Kempermann G, Krebs J, Fabel K. (2008) The contribution of failing adult hippocampal neurogenesis to psychiatric disorders. Current Opinion in Psychiatry 21: 290–295. [DOI] [PubMed] [Google Scholar]
- Knoth R, Singec I, Ditter M, et al. (2010) Murine features of neurogenesis in the human hippocampus across the lifespan from 0 to 100 years. PLoS ONE 5: e8809. [DOI] [PMC free article] [PubMed] [Google Scholar]
- Kodama M, Fujioka T, Duman RS. (2004) Chronic olanzapine or fluoxetine administration increases cell proliferation in hippocampus and prefrontal cortex of adult rat. Biological Psychiatry 56: 570–580. [DOI] [PubMed] [Google Scholar]
- Kohler SJ, Williams NI, Stanton GB, et al. (2011) Maturation time of new granule cells in the dentate gyrus of adult macaque monkeys exceeds six months. Proceedings of the National Academy of Sciences of the United States of America 108: 10326–10331. [DOI] [PMC free article] [PubMed] [Google Scholar]
- Mai J, Paxinos G, Voss T. (2007) Atlas of the Human Brain, 3rd Edition. San Diego, CA: Academic Press. [Google Scholar]
- Manganas LN, Zhang X, Li Y, et al. (2007) Magnetic resonance spectroscopy identifies neural progenitor cells in the live human brain. Science 318: 980–985. [DOI] [PMC free article] [PubMed] [Google Scholar]
- Muskhelishvili L, Latendresse JR, Kodell RL, et al. (2003) Evaluation of cell proliferation in rat tissues with BrdU, PCNA, Ki-67(MIB-5) immunohistochemistry and in situ hybridization for histone mRNA. Journal of Histochemistry and Cytochemistry 51: 1681–1688. [DOI] [PubMed] [Google Scholar]
- Nelson MD, Saykin AJ, Flashman LA, et al. (1998) Hippocampal volume reduction in schizophrenia as assessed by magnetic resonance imaging: A meta-analytic study. Archives of General Psychiatry 55: 433–440. [DOI] [PubMed] [Google Scholar]
- Ohta Y, Ichimura K. (2000) Proliferation markers, proliferating cell nuclear antigen, Ki67, 5-bromo-2′-deoxyuridine, and cyclin D1 in mouse olfactory epithelium. Annals of Otology, Rhinology, and Laryngology 109: 1046–1048. [DOI] [PubMed] [Google Scholar]
- Reif A, Fritzen S, Finger M, et al. (2006) Neural stem cell proliferation is decreased in schizophrenia, but not in depression. Molecular Psychiatry 11: 514–522. [DOI] [PubMed] [Google Scholar]
- Reif A, Schmitt A, Fritzen S, et al. (2007) Neurogenesis and schizophrenia: Dividing neurons in a divided mind? European Archives of Psychiatry and Clinical Neuroscience 257: 290–299. [DOI] [PubMed] [Google Scholar]
- Sanfilipo M, Lafargue T, Rusinek H, et al. (2002) Cognitive performance in schizophrenia: Relationship to regional brain volumes and psychiatric symptoms. Psychiatry Research 116: 1–23. [DOI] [PubMed] [Google Scholar]
- Schmitt A, Weber S, Jatzko A, et al. (2004) Hippocampal volume and cell proliferation after acute and chronic clozapine or haloperidol treatment. Journal of Neural Transmission 111: 91–100. [DOI] [PubMed] [Google Scholar]
- Scholzen T, Gerdes J. (2000) The Ki-67 protein: From the known and the unknown. Journal of Cellular Physiology 182: 311–322. [DOI] [PubMed] [Google Scholar]
- Shapiro LA, Korn MJ, Shan Z, et al. (2005) GFAP-expressing radial glia-like cell bodies are involved in a one-to-one relationship with doublecortin-immunolabeled newborn neurons in the adult dentate gyrus. Brain Research 1040: 81–91. [DOI] [PubMed] [Google Scholar]
- Shenton M, Dickey C, Frumin M, et al. (2001) A review of MRI findings in schizophrenia. Schizophrenia Research 49: 1–52. [DOI] [PMC free article] [PubMed] [Google Scholar]
- Silbersweig DA, Stern E, Frith C, et al. (1995) A functional neuroanatomy of hallucinations in schizophrenia. Nature 378: 176–179. [DOI] [PubMed] [Google Scholar]
- Snyder JS, Hong NS, McDonald RJ, et al. (2005) A role for adult neurogenesis in spatial long-term memory. Neuroscience 130: 843–852. [DOI] [PubMed] [Google Scholar]
- Song H, Stevens CF, Gage FH. (2002) Astroglia induce neurogenesis from adult neural stem cells. Nature 417: 39–44. [DOI] [PubMed] [Google Scholar]
- Spalding KL, Bergmann O, Alkass K, et al. (2013) Dynamics of hippocampal neurogenesis in adult humans. Cell 153: 1219–1227. [DOI] [PMC free article] [PubMed] [Google Scholar]
- Titone D, Ditman T, Holzman PS, et al. (2004) Transitive inference in schizophrenia: Impairments in relational memory organization. Schizophrenia Research 68: 235–247. [DOI] [PubMed] [Google Scholar]
- Toni N, Laplagne DA, Zhao C, et al. (2008) Neurons born in the adult dentate gyrus form functional synapses with target cells. Nature Neuroscience 11: 901–907. [DOI] [PMC free article] [PubMed] [Google Scholar]
- Van Praag H, Schinder AF, Christie BR, et al. (2002) Functional neurogenesis in the adult hippocampus. Nature 415: 1030–1034. [DOI] [PMC free article] [PubMed] [Google Scholar]
- Velakoulis D, Wood SJ, Wong MT, et al. (2006) Hippocampal and amygdala volumes according to psychosis stage and diagnosis: A magnetic resonance imaging study of chronic schizophrenia, first-episode psychosis, and ultra-high-risk individuals. Archives of General Psychiatry 63: 139–149. [DOI] [PubMed] [Google Scholar]
- Vita A, De Peri L, Silenzi C, et al. (2006) Brain morphology in first-episode schizophrenia: A meta-analysis of quantitative magnetic resonance imaging studies. Schizophrenia Research 82: 75–88. [DOI] [PubMed] [Google Scholar]
- Wakade CG, Mahadik SP, Waller JL, et al. (2002) Atypical neuroleptics stimulate neurogenesis in adult rat brain. Journal of Neuroscience Research 69: 72–79. [DOI] [PubMed] [Google Scholar]
- Walker MA, Highley JR, Esiri MM, et al. (2002) Estimated neuronal populations and volumes of the hippocampus and its subfields in schizophrenia. American Journal of Psychiatry 159: 821–828. [DOI] [PubMed] [Google Scholar]
- Walton NM, Zhou Y, Kogan JH, et al. (2012) Detection of an immature dentate gyrus feature in human schizophrenia/bipolar patients. Translational Psychiatry 2: e135. [DOI] [PMC free article] [PubMed] [Google Scholar]
- Weiss AP, Heckers S. (2001) Neuroimaging of declarative memory in schizophrenia. Scandinavian Journal of Psychology 42: 239–250. [DOI] [PubMed] [Google Scholar]
- Weiss AP, Schacter DL, Goff DC, et al. (2003) Impaired hippocampal recruitment during normal modulation of memory performance in schizophrenia. Biological Psychiatry 53: 48–55. [DOI] [PubMed] [Google Scholar]
- Winocur G, Wojtowicz JM, Sekeres M, et al. (2006) Inhibition of neurogenesis interferes with hippocampus-dependent memory function. Hippocampus 16: 296–304. [DOI] [PubMed] [Google Scholar]