Abstract
The aim of this study was to characterize cervical disc deformation in asymptomatic subjects and single-level arthrodesis patients during in vivo functional motion. A validated model-based tracking technique determined vertebral motion from biplane radiographs collected during dynamic flexion–extension. Level-dependent differences in disc compression–distraction and shear deformation were identified within the anterior and posterior annulus (PA) and the nucleus of 20 asymptomatic subjects and 15 arthrodesis patients using a mixed-model statistical analysis. In asymptomatic subjects, disc compression and shear deformation per degree of flexion–extension progressively decreased from C23 to C67. The anterior and PA experienced compression–distraction deformation of up to 20%, while the nucleus region was compressed between 0% (C67) and 12% (C23). Peak shear deformation ranged from 16% (at C67) to 33% (at C45). In the C5–C6 arthrodesis group, C45 discs were significantly less compressed than in the control group in all disc regions (all p ≤ 0.026). In the C6–C7 arthrodesis group, C56 discs were significantly less compressed than the control group in the nucleus (p = 0.023) and PA (p = 0.014), but not the anterior annulus (AA; p = 0.137). These results indicate in vivo disc deformation is level-dependent, and single-level anterior arthrodesis alters the compression–distraction deformation in the disc immediately superior to the arthrodesis.
Keywords: disc degeneration, kinematics, arthrokinematics, cervical spine, disc strain
Degenerative changes adjacent to fused cervical vertebrae are well documented,1–7 and lead to recurrent pain3 and ultimately adjacent level surgery in 6–16% of patients.2,3,8–11 The etiology of adjacent segment disease following cervical arthrodesis remains controversial. The disease may progress due to the underlying spondylosis,4,12,13 the arthrodesis may lead to increased motion in adjacent vertebrae, resulting in overload and instability,1,14–16 or adjacent segment degeneration may result from a combination of these two factors.2,5
Previous kinematic studies investigating adjacent segment disease have focused on vertebral range of motion (most often flexion–extension and anterior translation) when assessing spine mechanics in asymptomatic subjects and arthrodesis patients.17,18 One limitation of these kinematic studies is that they only take into account bone position at the end of the range of motion, typically under static loading conditions. Relative motion between adjacent vertebrae in the middle range of motion (which is most often encountered in activities of daily living19,20) and during dynamic, functional loading is not assessed. A second limitation is that kinematic reports that focus solely on bone range of motion fail to reveal how the coupled translation and rotation between adjacent vertebrae combine to deform the intervertebral disc throughout the movement. These are critical limitations because intervertebral disc deformation during dynamic, functional movement can reflect the magnitude and direction of the loads applied to the disc and the material properties of the disc. Therefore, disc deformation patterns may be beneficial in identifying altered mechanical loading and modified disc material properties following cervical arthrodesis.
Techniques to evaluate in vitro disc strain have progressed from adhering optical targets to the disc surface21 to using high-resolution MRI images and image correlation techniques.22 In vitro testing, however, has limitations in replicating subject-specific in vivo dynamic loading and kinematics. In vivo disc deformation during functional loading remains poorly defined due to limitations of previous studies, including the large error associated with manual identification of vertebral edges on radiographs23,24 and data collection restricted to static postures.24
The primary aim of this study was to characterize cervical disc deformation in asymptomatic control subjects during in vivo dynamic flexion–extension. It was hypothesized that each disc level would exhibit a unique shear and compression/distraction deformation pattern during dynamic loading. A secondary aim was to assess disc deformation in single-level arthrodesis subjects. It was hypothesized that discs adjacent to the arthrodesis would undergo increased shear and compressive deformation when compared to corresponding discs in asymptomatic control subjects.
MATERIALS AND METHODS
Subjects
Twenty asymptomatic control subjects (46 ± 9 years; 7 M, 13 F) and 15 single-level anterior arthrodesis patients (10 C5–C6 arthrodesis: 45 ± 6 years; 2 M, 8 F; 7 ± 1 month post-surgery; 5 C6–C7 arthrodesis: 2 M, 3 F, average age 43 ± 8 years; 7 ± 1 months post-surgery) provided informed consent to participate in this Institutional Review Board-approved study. Asymptomatic controls that reported no previous neck disability were recruited to approximately match the age and gender distribution of the arthrodesis patients. Control subject recruitment was accomplished through an advertisement in an employee newsletter and word of mouth. Arthrodesis subjects who were at least 18 years of age and scheduled to undergo (or recently received) single-level anterior cervical discectomy and fusion (ACDF) surgery were identified during clinic visits. Pregnant women, subjects diagnosed with osteoporosis, and subjects with any other injury or disease that interferes with spine function were excluded.
Data Collection
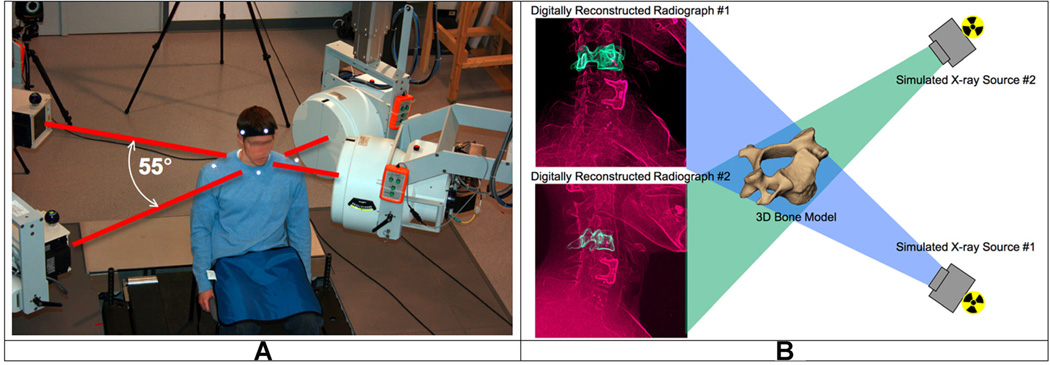
Subjects were seated within a biplane X-ray system (Fig. 1A) and, for each trial, directed to continuously move their head and neck through their entire range of flexion–extension. A metronome set at 40–44 beats/min was used to ensure the participants moved at a continuous, steady pace to complete each full movement cycle in approximately 3 s. Radiographs were collected at 30 frames per second for 3 s for each trial of flexion–extension (X-ray parameters: 70 KV, 160 mA, 2.5 ms X-ray pulses, source-to-subject distance 140 cm). Radiographs were recorded for 2 or 3 separate trials for each subject (allowing for a rest period between trials). A total of 92 dynamic flexion–extension trials were included in this analysis, however, multiple trials for each subject were averaged to obtain a single trial for each participant for statistical analysis. An additional 0.1 s static trial was collected for each subject with the head in the neutral position. The effective radiation dose for each 3-sec dynamic flexion–extension motion trial was estimated to be 0.16 mSv (determined using PCXMC simulation software, STUK, Helsinki, Finland).
Figure 1.
The biplane radiography system and bone-model-based tracking technique. (A) The biplane radiography system was configured with an angle of approximately 55° between X-ray tube/image intensifier pairs. Each cardiac cine-angiography generator produced short duration (2.5 ms), high powered (70 kVp, 160 mA), X-ray pulses at a rate of 30 pulses per second. (B) The virtual X-ray system for model based tracking. A 3D CT reconstruction of the bone was placed in a computer-generated reproduction of the X-ray system. Simulated X-rays were then passed through the 3D CT reconstruction to generate digitally reconstructed radiographs (DRRs). Bone position and orientation was determined by a computer algorithm that optimized the correlation between the DRRs (green in image) and the edge-enhanced radiographs (red in figure).
High-resolution CT scans (0.29 mm × 0.29 mm × 1.25 mm voxels) of the cervical spine (C2–C7) were acquired on each participant (GE Lightspeed 16). The effective dose of a cervical spine CT scan has been reported to be between 3.0 and 4.36 mSv.25,26 Bone tissue was segmented from the CT volume using a combination of commercial software (Mimics software, Materialise, Leuven, Belgium) and manual segmentation.27 A three-dimensional (3D) model of each vertebra was generated from the segmented bone tissue. Eight markers were placed on the 3D bone models to define bone-specific anatomic coordinate systems (4 on each endplate: most anterior, most posterior, left edge and right edge).
Data Processing
A previously validated bone-model-based tracking process was used to determine three-dimensional vertebral motion with sub-millimeter accuracy for all static and dynamic trials.28 The bone-model-based tracking algorithm involved recreating the geometry of the biplane imaging system within the computer and passing simulated X-rays through the three-dimensional subject-specific bone models to create digitally reconstructed radiographs (DRRs; Fig. 1B). A computer algorithm translated and rotated the 3D bone model in lab-based 3D space until the DRRs were matched to edge-enhanced versions of the original radiographs. Details describing the volumetric model-based tracking process, including hardware and software specifications, calibration and distortion correction procedures, and computational algorithms have been extensively described.28–31 Tracked bone movement data were filtered at 1.0 Hz using a fourth-order, low-pass Butterworth filter with the filter frequency determined using residual analysis.32 The tracked data were used to determine intervertebral flexion–extension using the bone-specific anatomic coordinate systems.
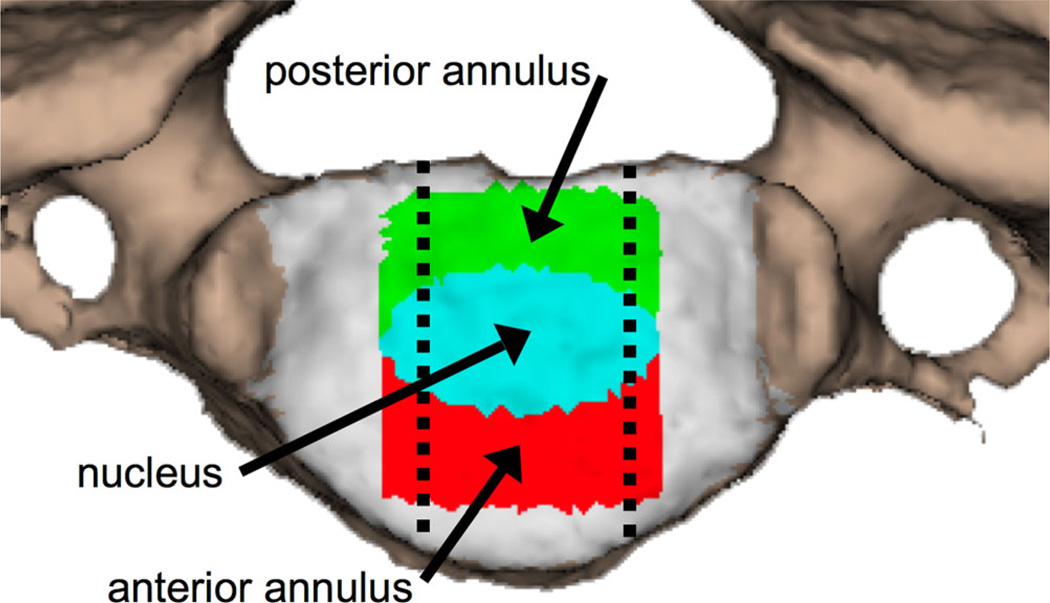
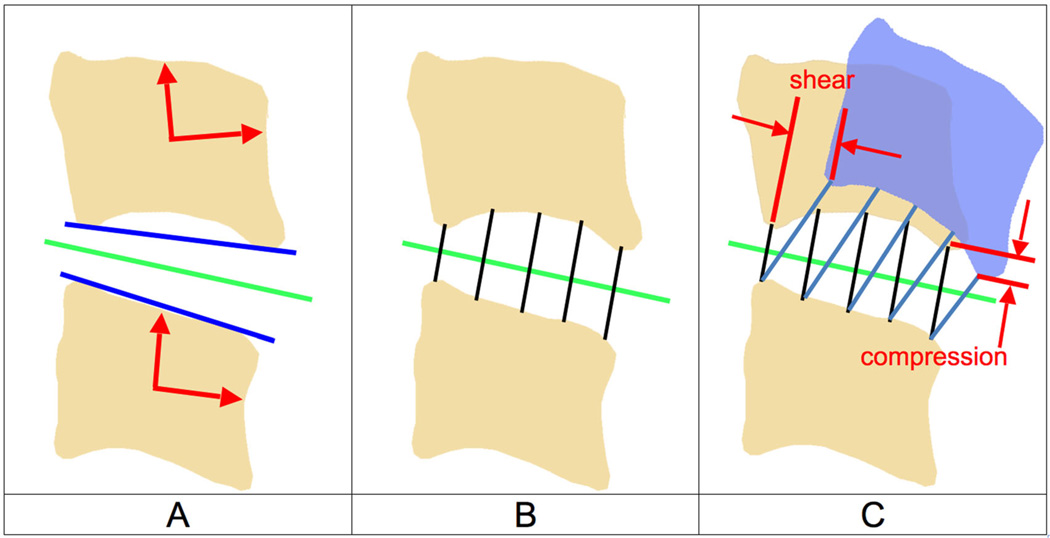
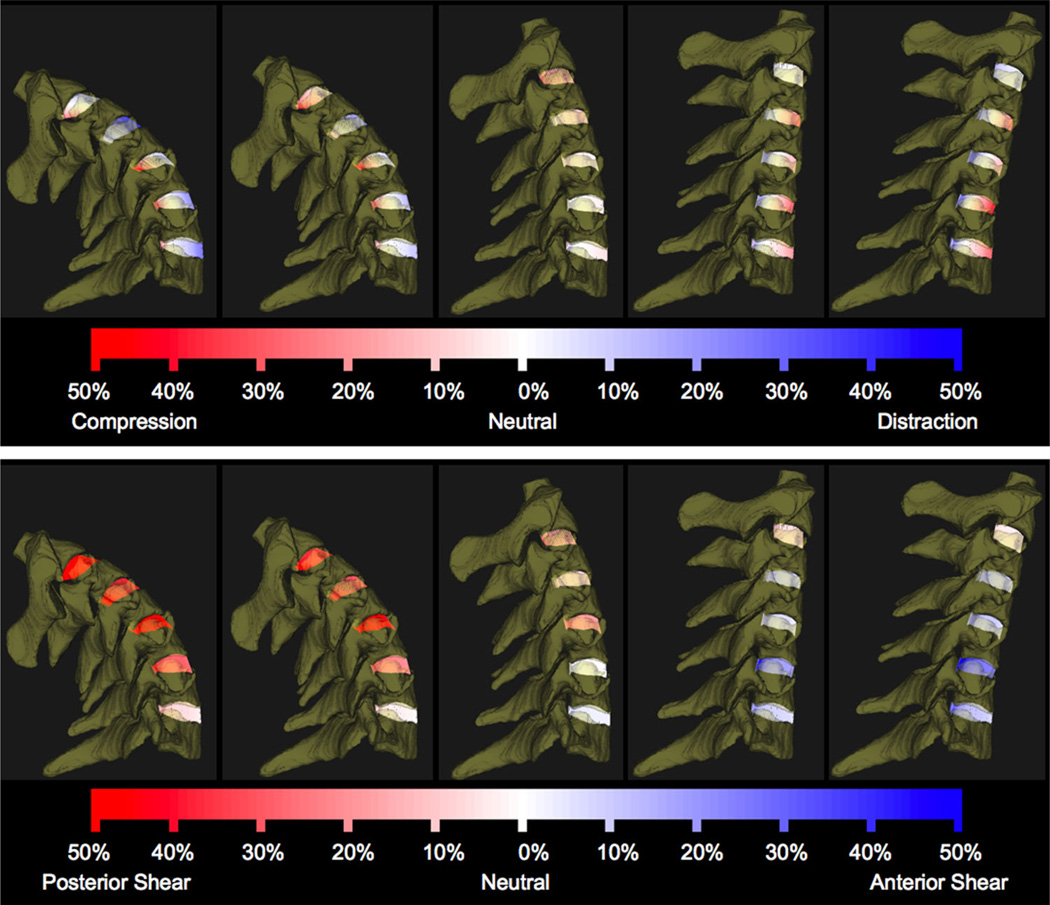
Nucleus and annulus regions were defined on the vertebral endplate surfaces according to previous reports,33,34 and all disc height and dynamic disc deformation measurements were acquired within the central 1/3rd of the disc width (Fig. 2). Average disc height within the nucleus (N), anterior annulus (AA), and PA regions was determined from the static trial using an automated computer algorithm that measured disc height over the entire central 1/3rd of the disc width (Fig. 3A and B). Average disc deformation was calculated every frame of dynamic movement within each disc region to determine shear and compression–distraction deformation (Fig. 3C). Disc deformations were normalized to disc height in the static neutral position to determine the average percent deformation within each anatomic region of the disc (Fig. 4). The disc deformation versus intervertebral flexion–extension curves generated from the continuous motion data were interpolated at 1° increments of flexion–extension to facilitate statistical analysis.
Figure 2.
The superior endplate of a vertebral body with color-coded regions of interest. Green: posterior annulus, teal: nucleus, red: anterior annulus. Dashed lines indicate the central 1/3rd of the disc region included in the analysis.
Figure 3.
Calculating disc height and disc deformation. (A) Anatomical coordinate systems were created in each bone and used to calculate the flexion–extension angle for each motion segment (red arrows). A line in the direction of the inferior endplate of the superior bone and a line in the direction of the superior endplate of the inferior bone in the sagittal plane were created (blue lines). The average direction of these two lines defined the average anterior–posterior (AP) axis of the disc in the static neutral position (green line). (B) Using the static neutral data, line segments connecting the endplates and perpendicular to the average disc AP axis were constructed (over 100 per disc; only five are shown for clarity). The average disc height within each region was determined from this static neutral data. (C) The endpoints of each line segment remained connected to each bone during the dynamic motion (blue bone). Disc deformation parallel to the disc static AP axis (shear) and perpendicular to the static disc AP axis (compression–distraction) was determined for each line segment. All measurements were performed in three-dimensions, but only the sagittal plane is shown for clarity.
Figure 4.
C23–C67 disc compression–distraction deformation (above) and shear deformation (below) during dynamic flexion–extension for a representative participant. A series of five instants from the flexion portion of the dynamic trial are shown for demonstration purposes. Line segments connecting bone endplates are color-coded according to percent compression–distraction (above) and shear (below) deformation relative to the static neutral position.
The average disc height across all three disc regions of all discs between C2 and C735 and the precision of the tracking system in measuring flexion–extension rotation and anterior–posterior translation28 were used to estimate that the tracking system can determine disc deformation (shear and compression–distraction) with a precision of 3.6% or better. A power calculation was performed to estimate the number of subjects necessary to identify differences between groups that were in excess of our tracking system variability (i.e., >3.6%). This power analysis indicated that 17 subjects would be necessary per group, with power set at 0.80 and alpha equal to 0.05.36
Data Analysis
Within-subject differences in disc deformation during the flexion and extension movement directions were assessed within each disc region (PA, N, and AA) and disc level (C23 through C67) in control subjects. These flexion versus extension differences were used to determine if disc deformation was dependent upon movement direction. The within-subject trial-to-trial variability in disc deformation was also determined within each disc region and disc level in control subjects in order to assess within-subject repeatability in disc deformation during functional loading.
A linear mixed-model analysis was performed to identify differences in disc compression–distraction and shear deformation curves at each disc level (C23 through C67) for each of the three disc regions (PA, N, and AA) in control subjects. Arthrodesis and control subject comparisons were also performed using linear mixed model analysis to identify differences in compression–distraction deformation curves at discs adjacent to the arthrodesis (C45 and C67 for the C5–C6 arthrodesis group, and C56 for the C6–C7 arthrodesis group) for each of the three disc regions (PA, N, and AA). In order to statistically compare shear deformation in control and arthrodesis groups, the slope of the line formed by the shear deformation versus flexion–extension angle plot was determined (i.e., the rate of shear deformation). T-tests were used to identify differences between arthrodesis and control subjects in terms of the rate of shear deformation (calculated by the slope of the shear deformation vs. flexion–extension angle for each motion segment). Significance was set at p < .05 for all tests, with the Bonferroni correction applied in cases of multiple comparisons.
RESULTS
Flexion Versus Extension Differences
The average difference in disc deformation between the flexion motion and the extension motion at identical angles of intervertebral flexion–extension was 0.9% and 0.1% for disc compression–distraction and disc shear, respectively, across all disc levels (C23 through C67) and all disc regions (AA, N, and PA) in the control subject group. Therefore, disc deformation values during flexion were averaged with deformation values during extension at each corresponding intervertebral angle for all subsequent analysis.
Repeatability
Within-subject trial-to-trial variability (i.e., standard deviation) in compression–distraction deformation at identical angles of intervertebral flexion–extension averaged 2.4% across all disc levels, with greatest variability in the C23 disc (3.8%) and smallest variability in the C56 disc (1.4%) in control subjects. Within-subject trial-to-trial variability in shear deformation at identical angles of intervertebral flexion–extension was consistent across disc levels and averaged 1.1%.
Control Subject Disc Deformation
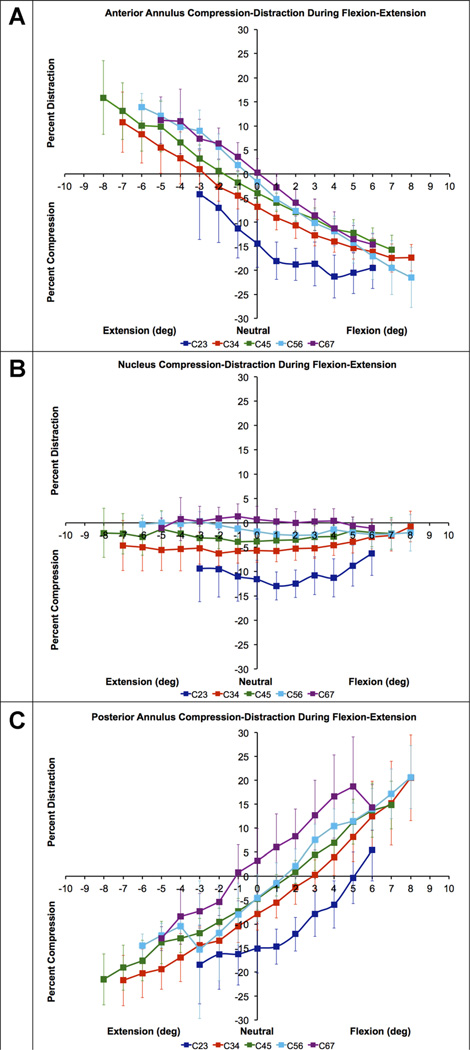
A consistent pattern in control subject disc compression–distraction was evident across disc levels in each disc region. Disc compression was greatest in the C23 disc, and compression decreased with each successive inferior disc (Fig. 5). In the control group in the AA region, the C23 disc was significantly more compressed than all other discs (all p < 0.001). Similarly, the C34 AA was significantly more compressed than the C45, C56, and C67 AA regions (all p ≤ 0.002; Fig. 5A). C45, C56, and C67 compression–distraction patterns in the AA were not significantly different (all p = 1.000; Fig. 5A). In the nucleus region, the C23 disc was significantly more compressed than all other discs (all p < 0.001; Fig. 5B). The C34 nucleus region was more compressed than the C56 and C67 nucleus regions (p < 0.001). The C45 nucleus was more compressed than the C56 (p = 0.029) and C67 nucleus regions (p < 0.001). Compression in the C56 and C67 nucleus was not significantly different (p = 0.193; Fig. 5B). In the PA region, the C23 disc was significantly more compressed than all other discs (all p ≤ 0.002; Fig. 5C). No significant differences were identified among the C34, C45, and C56 PA regions (all p ≥ 0.514); however, the C67 PA was significantly less compressed than all other disc levels (all p < 0.001; Fig. 5C).
Figure 5.
Mean disc compression–distraction deformation in the anterior annulus (A), nucleus (B) and posterior annulus (C) during flexion–extension in asymptomatic control subjects (n = 20). Disc compression-distraction, expressed as a percentage of disc height in the static neutral position, is plotted on the vertical axis. Intervertebral flexion–extension angle, normalized to the static neutral position, is plotted on the horizontal axis. Error bars indicate inter-subject variability (i.e., 95% confidence interval at each disc level) and averaged 3.9% across all disc levels, disc regions and intervertebral flexion–extension angles. Note that statistical tests for differences among disc levels were performed using within-subject analysis.
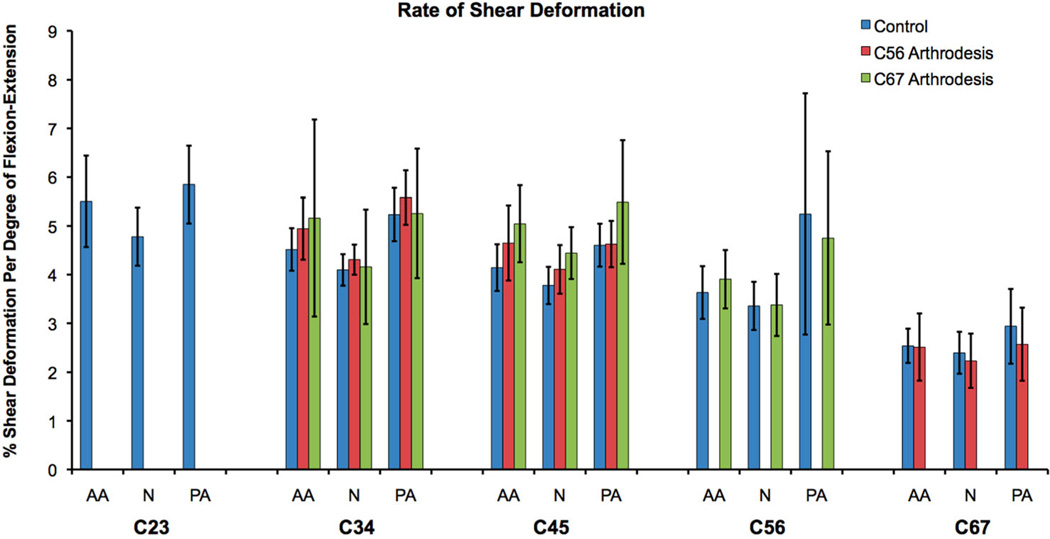
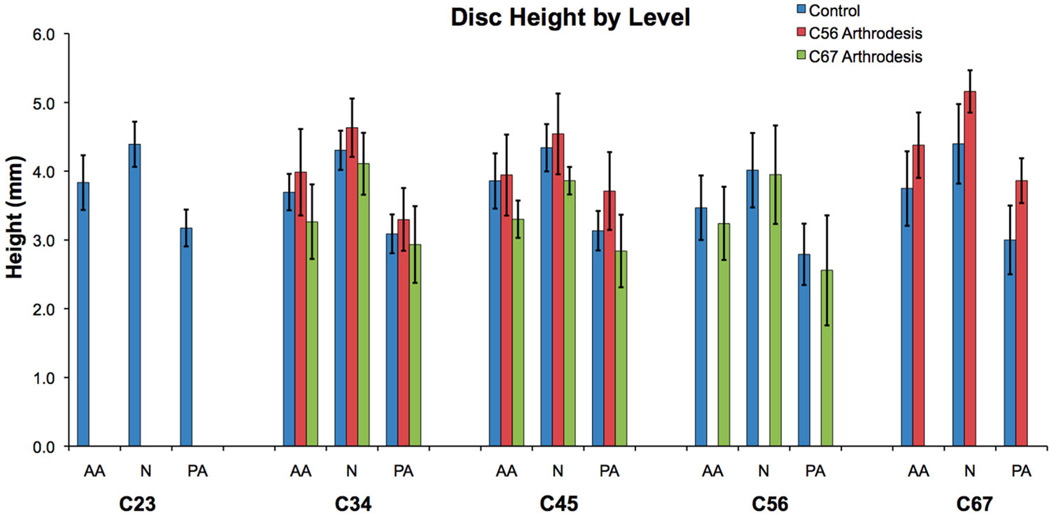
The rate of disc shear deformation progressively decreased from the C23 disc to the C67 disc (Fig. 6). The only significant difference in the rate of shear deformation occurred between the C67 level and the C23, C34, C45 levels (all p < 0.001). Static disc height within each disc region was not significantly different among disc levels (Fig. 7).
Figure 6.
Average rate of disc shear deformation in the anterior annulus (AA), nucleus (N), and posterior annulus (PA) for each cervical disc. Error bars indicate upper and lower 95% confidence intervals for the mean of each group. C23 disc data were not available for the arthrodesis groups. For the control group, the rate of C67 shear deformation in each disc region was significantly less than corresponding regions of all other discs. Control and arthrodesis groups were not significantly different at any disc region.
Figure 7.
Mean disc height in the anterior annulus (AA), nucleus (N), and posterior annulus (PA) for each cervical disc when in the static neutral position. Error bars indicate upper and lower 95% confidence intervals for the mean of each group. C23 disc data were not available for the arthrodesis groups.
Control Versus Arthrodesis Adjacent Segment Deformation
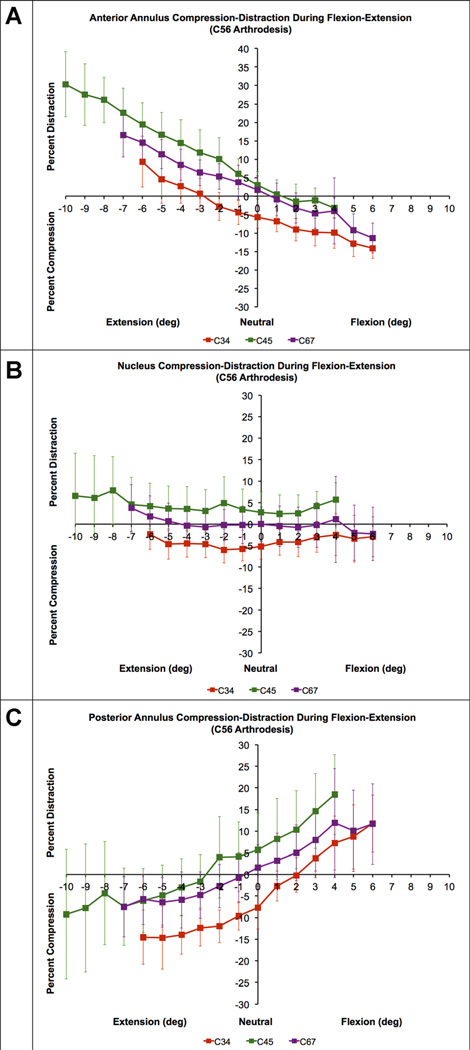
In the C5–C6 arthrodesis group, the C45 discs were significantly less compressed than in the control group in all disc regions (p = 0.003, p = 0.022, and p = 0.026 in the AA, N, and PA, respectively; Fig. 8). No significant differences between the C5–C6 arthrodesis group and the control group were identified in the C67 disc compression–distraction curves for any disc region (p = 0.759, p = 0.743, and p = 0.398 in the AA, N, and PA, respectively). In the C6–C7 arthrodesis group, the C56 discs were significantly less compressed than the control group in the nucleus (p = 0.023) and PA (p = 0.014) regions, but not the AA region (p = 0.137).
Figure 8.
Mean disc compression–distraction deformation in the anterior annulus (A), nucleus (B) and posterior annulus (C) during flexion–extension in C56 arthrodesis patients (n = 10). Disc compression-distraction, expressed as a percentage of disc height in the static neutral position, is plotted on the vertical axis. Intervertebral flexion–extension angle, normalized to the static neutral position, is plotted on the horizontal axis. Error bars indicate inter-subject variability (i.e., 95% confidence interval at each disc level). Note that only C45 disc curves are shifted toward distraction in comparison to asymptomatic controls (Fig. 5).
No significant differences in the rate of shear deformation were identified at any disc level adjacent to the arthrodesis region when comparing the control and arthrodesis groups (all p ≥ 0.264 and all p ≥ 0.105 for the C5–C6 and C6–C7 arthrodesis groups, respectively; Fig. 6).
DISCUSSION
The control subject data provide new insights into disc deformation during in vivo functional loading and provides a standard for comparison when evaluating the effects of surgery on adjacent cervical discs. The mean control subject compression–distraction curves were “shifted” toward compression during in vivo functional loading (with the exception being the C67 disc). As an example, during the dynamic movement trial, when the intervertebral angle was identical to the neutral position angle, all three disc regions (AA, N, and PA) were compressed (with the exception being the C67 disc). Similarly, at equivalent magnitudes of flexion or extension, the compression deformation was much greater than the distraction deformation (with the exception being the C67 disc; Fig. 5). This shift toward compression likely reflects the effects of increased muscular forces necessary to produce the dynamic flexion–extension.
Few reports of disc deformation are available to compare with the present results. In one study, preoperative flexion/extension radiographs of cervical fusion patients indicated that pre-operative shear strain averaged 5–7% in segments adjacent to the surgical site.24 However, the magnitude of the pre-surgical adjacent segment range of motion was not provided, making it difficult to interpret this finding. Another study used cineradiography to estimate lumbar disc deformation during standing flexion and extension.23 This study estimated maximum compressive and shear strains of 35% and 60%, respectively, at full flexion.23 In vitro studies of lumbar motion segments have reported strains averaging between 5% and 8%.21,37
The disc deformation curves presented here may be used to improve in vitro organ level or explant mechanobiology dynamic loading regimens and in vivo controlled loading via external fixation devices.38–42 As previous studies have demonstrated, certain dynamic loading conditions are beneficial to maintaining matrix homeostasis43,44 and improving various biological therapies.45,46 However, the loads applied to the disc during in vivo physiologic loading are currently unknown, so it is not clear how well these in vitro tests replicate in vivo loading. The control subject disc deformation curves presented here provide valuable information regarding the in vivo deformation experienced by disc tissues during functional loading. For example, the current results indicate that during dynamic flexion–extension, the anterior and PA regions of cervical discs undergo compression–distraction deformation of up to 20%, while the nucleus region is continuously compressed between 0% and 15%, depending on disc level. Similarly, the results indicate that during in vivo flexion–extension, the peak shear deformation ranges from 16% (at C67) to 33% (at C45), given the average flexion–extension range of motion at each motion segment.35 This information may be used to guide in vitro and in vivo studies that investigate cell and tissue responses to stress and strain. As noted previously, reproducing in vivo conditions is important because the wrong type or magnitude of loading will lead to very different cell responses, and potentially misleading results.47
There are two potential explanations for the significant level-dependent differences in compression–distraction observed in this study. First, the results may be explained by variation in disc material properties from the C23 disc to the C67 disc. The present data indicate that the C23 disc compresses the most, and compression decreases with each successive inferior disc. This suggests the C23 disc is the most compliant, and compressive stiffness increases with each successive inferior disc. This idea is supported by in vitro material testing that demonstrated compressive stiffness progressively increases from the C23 disc (637.5 N/mm) to the C67 disc (829.7 N/mm).48 An alternative explanation for the observed level-dependent differences in disc compression–tension is that in the static neutral position, which was used as a reference to normalize all disc deformation measurements, compressive loading on the C23 disc was relatively small (compared to the load applied during functional motion) and the static compressive loading on the C67 disc was nearly equivalent to the load applied during functional motion.
The trend toward decreasing shear deformation per degree of flexion–extension, from the superior to inferior discs, indicates the translation between endplates decreases successively from C23 to C67 for a given amount of intervertebral flexion–extension. As a result, even though the flexion–extension range of motion in the C2–C3 motion segment is slightly less than in the C6–C7 motion segment,35 the C23 disc undergoes considerably more shear deformation. The significant decrease in C67 shear deformation, in comparison to superior discs, corresponds to a relatively fixed center of rotation in the C6–C7 motion segment in comparison to cranial levels during flexion– extension.49
This study provides evidence to suggest that single-level anterior arthrodesis alters the compression– distraction patterns in the disc immediately superior to the arthrodesis while not affecting compression–distraction inferior to the fused site. While it is not clear why this difference exists superior to the arthrodesis, potential explanations include a change in disc material properties, altered compression–distraction loads following arthrodesis, or there may be an iatrogenic cause. The current shear deformation results agree with a previous study that reported no increase in the shear strain in discs adjacent to fusion using measurements obtained from static full-flexion and full-extension radiographs.24
The relatively short time between surgery and testing for arthrodesis subjects is one limitation of this study. Fusion may not have occurred in the arthrodesis group at 7 months post-surgery. Fusion status was evaluated using total flexion–extension ROM during dynamic movement in a subgroup of 8 C5–C6 arthrodesis patients who have returned for follow-up testing 2-years post surgery. In this sample of 8, total ROM at the operated site decreased from 3.6° at 7 months post-surgery to 2.4° at 24 months post-surgery. Differences in disc deformation adjacent to the arthrodesis may be amplified as motion decreases in the operated segment. Therefore, 2-year follow-up testing is being completed for the remainder of the arthrodesis group. Another limitation is that the results are specific to single-level anterior arthrodesis and it would be inappropriate to extrapolate the results to different single-level or multiple-level anterior surgeries. The asymptomatic control subjects, who were selected to approximately match the age of the arthrodesis patients, exhibited varying amounts of age-related spondylosis. Considering the well-known changes that occur in the spine with age,50–53 the disc deformation patterns presented for the control group are likely representative only of subjects within their age-range. We are currently collecting data on a cohort of young (20–35 years) asymptomatic subjects to assess the effect of age on spine kinematics. Finally, the deformation values reported in this study were obtained using bone-to-bone measurements that represent in vivo tissue-level deformation. The reported deformations do not necessarily represent localized or cell-level deformation.
Acknowledgments
Grant sponsor: NIH/NIAMS; Grant number: R03-AR056265; Grant sponsor: Cervical Spine Research Society 21st Century Development.
W.D., J.L., and J.K. have received institutional research support from Stryker that is unrelated to this project.
REFERENCES
- 1.Baba H, Furusawa N, Imura S, et al. Late radiographic findings after anterior cervical fusion for spondylotic myeloradiculopathy. Spine. 1993;18:2167–2173. doi: 10.1097/00007632-199311000-00004. [DOI] [PubMed] [Google Scholar]
- 2.Goffin J, Geusens E, Vantomme N, et al. Long-term follow-up after interbody fusion of the cervical spine. J Spinal Disord Tech. 2004;17:79–85. doi: 10.1097/00024720-200404000-00001. [DOI] [PubMed] [Google Scholar]
- 3.Gore DR, Sepic SB. Anterior discectomy and fusion for painful cervical disc disease. A report of 50 patients with an average follow-up of 21 years. Spine (Phila Pa 1976) 1998;23:2047–2051. doi: 10.1097/00007632-199810010-00002. [DOI] [PubMed] [Google Scholar]
- 4.Hilibrand AS, Carlson GD, Palumbo MA, et al. Radiculopathy and myelopathy at segments adjacent to the site of a previous anterior cervical arthrodesis. J Bone Joint Surg Am. 1999;81:519–528. doi: 10.2106/00004623-199904000-00009. [DOI] [PubMed] [Google Scholar]
- 5.Hunter LY, Braunstein EM, Bailey RW. Radiographic changes following anterior cervical fusion. Spine (Phila Pa 1976) 1980;5:399–401. doi: 10.1097/00007632-198009000-00002. [DOI] [PubMed] [Google Scholar]
- 6.Ishihara H, Kanamori M, Kawaguchi Y, et al. Adjacent segment disease after anterior cervical interbody fusion. Spine J. 2004;4:624–628. doi: 10.1016/j.spinee.2004.04.011. [DOI] [PubMed] [Google Scholar]
- 7.Kulkarni V, Rajshekhar V, Raghuram L. Accelerated spondylotic changes adjacent to the fused segment following central cervical corpectomy: magnetic resonance imaging study evidence. J Neurosurg. 2004;100:2–6. doi: 10.3171/spi.2004.100.1.0002. [DOI] [PubMed] [Google Scholar]
- 8.Bohlman HH, Emery SE, Goodfellow DB, et al. Robinson anterior cervical discectomy and arthrodesis for cervical radiculopathy. Long-term follow-up of one hundred and twenty-two patients. J Bone Joint Surg Am. 1993;75:1298–1307. doi: 10.2106/00004623-199309000-00005. [DOI] [PubMed] [Google Scholar]
- 9.Gore DR, Sepic SB. Anterior cervical fusion for degenerated or protruded discs. A review of one hundred forty-six patients. Spine (Phila Pa 1976) 1984;9:667–671. doi: 10.1097/00007632-198410000-00002. [DOI] [PubMed] [Google Scholar]
- 10.Hilibrand AS, Yoo JU, Carlson GD, et al. The success of anterior cervical arthrodesis adjacent to a previous fusion. Spine (Phila Pa 1976) 1997;22:1574–1579. doi: 10.1097/00007632-199707150-00009. [DOI] [PubMed] [Google Scholar]
- 11.Watters WC, III, Levinthal R. Anterior cervical discectomy with and without fusion. Results, complications, and long-term follow-up. Spine (Phila Pa 1976) 1994;19:2343–2347. doi: 10.1097/00007632-199410150-00016. [DOI] [PubMed] [Google Scholar]
- 12.Fuller DA, Kirkpatrick JS, Emery SE, et al. A kinematic study of the cervical spine before and after segmental arthrodesis. Spine. 1998;23:1649–1656. doi: 10.1097/00007632-199808010-00006. [DOI] [PubMed] [Google Scholar]
- 13.Song KJ, Choi BW, Jeon TS, et al. Adjacent segment degenerative disease: is it due to disease progression or a fusion-associated phenomenon? Comparison between segments adjacent to the fused and non-fused segments. Eur Spine J. 2011;20:1940–1945. doi: 10.1007/s00586-011-1864-9. [DOI] [PMC free article] [PubMed] [Google Scholar]
- 14.Fielding JW. Normal and selected abnormal motion of the cervical spine from the second cervical vertebra to the seventh cervical vertebra based on cineroentgenography. J Bone Joint Surg Am. 1964;46:1779–1781. [PubMed] [Google Scholar]
- 15.Dunsker SB, Colley DP, Mayfield FH. Kinematics of the cervical spine. Clin Neurosurg. 1978;25:174–183. doi: 10.1093/neurosurgery/25.cn_suppl_1.174. [DOI] [PubMed] [Google Scholar]
- 16.Schwab JS, Diangelo DJ, Foley KT. Motion compensation associated with single-level cervical fusion: where does the lost motion go? Spine. 2006;31:2439–2448. doi: 10.1097/01.brs.0000239125.54761.23. [DOI] [PubMed] [Google Scholar]
- 17.Reitman CA, Hipp JA, Nguyen L, et al. Changes in segmental intervertebral motion adjacent to cervical arthrodesis: a prospective study. Spine. 2004;29:E221–E226. doi: 10.1097/00007632-200406010-00022. [DOI] [PubMed] [Google Scholar]
- 18.Liu F, Cheng J, Komistek RD, et al. In vivo evaluation of dynamic characteristics of the normal, fused, and disc replacement cervical spines. Spine (Phila Pa 1976) 2007;32:2578–2584. doi: 10.1097/BRS.0b013e318158cdf8. [DOI] [PubMed] [Google Scholar]
- 19.Bible JE, Biswas D, Miller CP, et al. Normal functional range of motion of the cervical spine during 15 activities of daily living. J Spinal Disord Tech. 2010;23:15–21. doi: 10.1097/BSD.0b013e3181981632. [DOI] [PubMed] [Google Scholar]
- 20.Cobian DG, Sterling AC, Anderson PA, et al. Task-specific frequencies of neck motion measured in healthy young adults over a five-day period. Spine (Phila Pa 1976) 2009;34:E202–E207. doi: 10.1097/BRS.0b013e3181908c7b. [DOI] [PMC free article] [PubMed] [Google Scholar]
- 21.Stokes IA. Surface strain on human intervertebral discs. J Orthop Res. 1987;5:348–355. doi: 10.1002/jor.1100050306. [DOI] [PubMed] [Google Scholar]
- 22.O’Connell GD, Johannessen W, Vresilovic EJ, et al. Human internal disc strains in axial compression measured noninvasively using magnetic resonance imaging. Spine (Phila Pa 1976) 2007;32:2860–2868. doi: 10.1097/BRS.0b013e31815b75fb. [DOI] [PubMed] [Google Scholar]
- 23.Kanayama M, Tadano S, Kaneda K, et al. A cineradiographic study on the lumbar disc deformation during flexion and extension of the trunk. Clin Biomech (Bristol, Avon) 1995;10:193–199. doi: 10.1016/0268-0033(95)91397-w. [DOI] [PubMed] [Google Scholar]
- 24.Matsunaga S, Kabayama S, Yamamoto T, et al. Strain on intervertebral discs after anterior cervical decompression and fusion. Spine. 1999;24:670–675. doi: 10.1097/00007632-199904010-00011. [DOI] [PubMed] [Google Scholar]
- 25.Biswas D, Bible JE, Bohan M, et al. Radiation exposure from musculoskeletal computerized tomographic scans. J Bone Joint Surg Am. 2009;91:1882–1889. doi: 10.2106/JBJS.H.01199. [DOI] [PubMed] [Google Scholar]
- 26.Fazel R, Krumholz HM, Wang Y, et al. Exposure to low-dose ionizing radiation from medical imaging procedures. N Engl J Med. 2009;361:849–857. doi: 10.1056/NEJMoa0901249. [DOI] [PMC free article] [PubMed] [Google Scholar]
- 27.Thorhauer E, Miyawaki M, Illingworth K, et al. Accuracy of bone and cartilage models obtained from CT and MRI. Providence, RI: American Society of Biomechanics; 2010. [Google Scholar]
- 28.Anderst WJ, Baillargeon E, Donaldson WF, III, et al. Validation of a noninvasive technique to precisely measure in vivo three-dimensional cervical spine movement. Spine (Phila Pa 1976) 2011;36:E393–E400. doi: 10.1097/BRS.0b013e31820b7e2f. [DOI] [PMC free article] [PubMed] [Google Scholar]
- 29.Bey MJ, Zauel R, Brock SK, et al. Validation of a new model-based tracking technique for measuring three-dimensional, in vivo glenohumeral joint kinematics. J Biomech Eng. 2006;128:604–609. doi: 10.1115/1.2206199. [DOI] [PMC free article] [PubMed] [Google Scholar]
- 30.Martin DE, Greco NJ, Klatt BA, et al. Model-based tracking of the hip: implications for novel analyses of hip pathology. J Arthroplasty. 2011;26:88–97. doi: 10.1016/j.arth.2009.12.004. [DOI] [PubMed] [Google Scholar]
- 31.Anderst W, Zauel R, Bishop J, et al. Validation of three-dimensional model-based tibio-femoral tracking during running. Med Eng Phys. 2009;31:10–16. doi: 10.1016/j.medengphy.2008.03.003. [DOI] [PMC free article] [PubMed] [Google Scholar]
- 32.Winter DA. Biomechanics and motor control of human movement. 4th. Hoboken, New Jersey: Wiley; 2009. [Google Scholar]
- 33.Skrzypiec DM, Pollintine P, Przybyla A, et al. The internal mechanical properties of cervical intervertebral discs as revealed by stress profilometry. Eur Spine J. 2007;16:1701–1709. doi: 10.1007/s00586-007-0458-z. [DOI] [PMC free article] [PubMed] [Google Scholar]
- 34.Pooni JS, Hukins DW, Harris PF, et al. Comparison of the structure of human intervertebral discs in the cervical, thoracic and lumbar regions of the spine. Surg Radiol Anat. 1986;8:175–182. doi: 10.1007/BF02427846. [DOI] [PubMed] [Google Scholar]
- 35.Anderst W, Donaldson W, Lee J, et al. Six-degrees-of-freedom cervical spine range of motion during dynamic flexion–extension after single-level anterior arthrodesis: comparison with asymptomatic control subjects. J Bone Joint Surg. 2013;95:497–506. doi: 10.2106/JBJS.K.01733. [DOI] [PMC free article] [PubMed] [Google Scholar]
- 36.Erdfelder E, Faul F, Buchner A. G*Power: a general power analysis program. Behav Res Methods Instrum Comput. 1996;28:1–11. [Google Scholar]
- 37.O’Connell GD, Vresilovic EJ, Elliott DM. Human intervertebral disc internal strain in compression: the effect of disc region, loading position, and degeneration. J Orthop Res. 2011;29:547–555. doi: 10.1002/jor.21232. [DOI] [PMC free article] [PubMed] [Google Scholar]
- 38.Guehring T, Nerlich A, Kroeber M, et al. Sensitivity of notochordal disc cells to mechanical loading: an experimental animal study. Eur Spine J. 2010;19:113–121. doi: 10.1007/s00586-009-1217-0. [DOI] [PMC free article] [PubMed] [Google Scholar]
- 39.Iatridis JC, MaClean JJ, Ryan DA. Mechanical damage to the intervertebral disc annulus fibrosus subjected to tensile loading. J Biomech. 2005;38:557–565. doi: 10.1016/j.jbiomech.2004.03.038. [DOI] [PMC free article] [PubMed] [Google Scholar]
- 40.Maclean JJ, Lee CR, Alini M, et al. Anabolic and catabolic mRNA levels of the intervertebral disc vary with the magnitude and frequency of in vivo dynamic compression. J Orthop Res. 2004;22:1193–1200. doi: 10.1016/j.orthres.2004.04.004. [DOI] [PubMed] [Google Scholar]
- 41.MacLean JJ, Lee CR, Alini M, et al. The effects of short-term load duration on anabolic and catabolic gene expression in the rat tail intervertebral disc. J Orthop Res. 2005;23:1120–1127. doi: 10.1016/j.orthres.2005.01.020. [DOI] [PubMed] [Google Scholar]
- 42.MacLean JJ, Lee CR, Grad S, et al. Effects of immobilization and dynamic compression on intervertebral disc cell gene expression in vivo. Spine (Phila Pa 1976) 2003;28:973–981. doi: 10.1097/01.BRS.0000061985.15849.A9. [DOI] [PubMed] [Google Scholar]
- 43.Walsh AJ, Lotz JC. Biological response of the intervertebral disc to dynamic loading. J Biomech. 2004;37:329–337. doi: 10.1016/s0021-9290(03)00290-2. [DOI] [PubMed] [Google Scholar]
- 44.Wuertz K, Godburn K, MacLean JJ, et al. In vivo remodeling of intervertebral discs in response to short- and long-term dynamic compression. J Orthop Res. 2009;27:1235–1242. doi: 10.1002/jor.20867. [DOI] [PMC free article] [PubMed] [Google Scholar]
- 45.Campbell JJ, Lee DA, Bader DL. Dynamic compressive strain influences chondrogenic gene expression in human mesenchymal stem cells. Biorheology. 2006;43:455–470. [PubMed] [Google Scholar]
- 46.Kisiday JD, Frisbie DD, McIlwraith CW, et al. Dynamic compression stimulates proteoglycan synthesis by mesenchymal stem cells in the absence of chondrogenic cytokines. Tissue Eng Part A. 2009;15:2817–2824. doi: 10.1089/ten.tea.2008.0357. [DOI] [PMC free article] [PubMed] [Google Scholar]
- 47.Adams MA, Dolan P, McNally DS. The internal mechanical functioning of intervertebral discs and articular cartilage, and its relevance to matrix biology. Matrix Biol. 2009;28:384–389. doi: 10.1016/j.matbio.2009.06.004. [DOI] [PubMed] [Google Scholar]
- 48.Yoganandan N, Kumaresan S, Pintar FA. Biomechanics of the cervical spine Part 2. Cervical spine soft tissue responses and biomechanical modeling. Clin Biomech (Bristol, Avon) 2001;16:1–27. doi: 10.1016/s0268-0033(00)00074-7. [DOI] [PubMed] [Google Scholar]
- 49.Anderst W, Baillargeon E, Donaldson W, et al. Motion path of the instant center of rotation in the cervical spine during in vivo dynamic flexion–extension: implications for artificial disc design and evaluation of motion quality following arthrodesis. Spine (Phila Pa 1976) 2013;38:E594–E601. doi: 10.1097/BRS.0b013e31828ca5c7. [DOI] [PMC free article] [PubMed] [Google Scholar]
- 50.Benoist M. Natural history of the aging spine. Eur Spine J. 2003;12:S86–S89. doi: 10.1007/s00586-003-0593-0. [DOI] [PMC free article] [PubMed] [Google Scholar]
- 51.Boden SD, Davis DO, Dina TS, et al. Abnormal magnetic-resonance scans of the lumbar spine in asymptomatic subjects. A prospective investigation. J Bone Joint Surg Am. 1990;72:403–408. [PubMed] [Google Scholar]
- 52.Ferguson SJ, Steffen T. Biomechanics of the aging spine. Eur Spine J. 2003;12:S97–S103. doi: 10.1007/s00586-003-0621-0. [DOI] [PMC free article] [PubMed] [Google Scholar]
- 53.Matsumoto M, Okada E, Ichihara D, et al. Age-related changes of thoracic and cervical intervertebral discs in asymptomatic subjects. Spine (Phila Pa 1976) 2010;35:1359–1364. doi: 10.1097/BRS.0b013e3181c17067. [DOI] [PubMed] [Google Scholar]


