Abstract
Biofluorescence has recently been found to be widespread in marine fishes, including sharks. Catsharks, such as the Swell Shark (Cephaloscyllium ventriosum) from the eastern Pacific and the Chain Catshark (Scyliorhinus retifer) from the western Atlantic, are known to exhibit bright green fluorescence. We examined the spectral sensitivity and visual characteristics of these reclusive sharks, while also considering the fluorescent properties of their skin. Spectral absorbance of the photoreceptor cells in these sharks revealed the presence of a single visual pigment in each species. Cephaloscyllium ventriosum exhibited a maximum absorbance of 484 ± 3 nm and an absorbance range at half maximum (λ1/2max) of 440–540 nm, whereas for S. retifer maximum absorbance was 488 ± 3 nm with the same absorbance range. Using the photoreceptor properties derived here, a “shark eye” camera was designed and developed that yielded contrast information on areas where fluorescence is anatomically distributed on the shark, as seen from other sharks’ eyes of these two species. Phylogenetic investigations indicate that biofluorescence has evolved at least three times in cartilaginous fishes. The repeated evolution of biofluorescence in elasmobranchs, coupled with a visual adaptation to detect it; and evidence that biofluorescence creates greater luminosity contrast with the surrounding background, highlights the potential importance of biofluorescence in elasmobranch behavior and biology.
Although biofluorescence has been extensively examined in cnidarians, particularly corals1,2,3, the phenomenon has only recently been shown to be phylogenetically widespread and phenotypically variable in both cartilaginous and bony marine fishes4. Biofluorescence has even recently been observed in sea turtles5. This revelation leads to many new questions regarding the biological and ecological role of biofluorescence in the marine realm, because fishes and sea turtles, unlike cnidarians, possess advanced visual systems6,7,8,9.
Marine organisms biofluoresce by absorbing the dominant higher energy ambient blue light via fluorescent compounds, and reemit it at longer, lower energy wavelengths, visually resulting in green, orange, and red fluorescence to the human visual system. With increasing depth in the ocean, the spectral quality of sunlight becomes restricted to a narrow range of wavelengths of blue light and intensity decreases in an approximately exponential manner10. In clear ocean water the light spectrum bandwidth progressively narrows with increasing depth, reaching a wavelength peak of 465 nm and a narrow bandwidth of ~20 nm at the maximum depth of penetration11. Thus, biofluorescence adds photons in a spectral region (i.e., longer wavelengths of the visible spectrum) not otherwise represented at depth, which has been shown to drive evolutionary shifts in light absorbance across many taxa, such as the evolution of divinyl-chlorophyll a in marine micro algae12.
Green Fluorescent Protein (GFP) was discovered in a hydrozoan jellyfish, Aequorea victoria, coupled to the bioluminescent apparatus, where it converts blue bioluminescent light to green light13. The GFP family has since proven to be one of the most useful tools in biomedical science14. GFP orthologs have also been reported in non-bioluminescent anthozoans2,15,16, planktonic copepods17, and lancelets18. In fishes, a novel bilirubin-binding fluorescent protein (FP) was found in Anguilla japonica19,20, and it has been shown that bilirubin-binding FPs also occur in cryptic marine eels of the genus Kaupichthys21. This new family of eel FPs evolved as the sister group to brain fatty acid-binding proteins21.
Some fishes exhibit strong interspecific variation in fluorescent emission patterns (e.g., members of the lizardfish genus Synodus and the goby genus Eviota), which has led to the hypothesis that biofluorescence functions as a form of species recognition4, akin to the unique bioluminescent signals produced by both shallow water and deep-sea fish lineages22,23,24. There are also many fishes known to possess yellow intraocular (lenses or cornea) filters25, which potentially function as long-pass filters and enable enhanced perception of fluorescence. Biofluorescence has also been shown to play a role in the behavior of marine organisms: fluorescence at the tips of the tentacles in the hydromedusa Olindias formosa attracts juvenile rockfishes of the genus Sebastes26; the fairy wrasse, Cirrhilabrus solorensis, responds to red biofluorescence27; and fluorescence in the mantis shrimp, Lysiosquillina glabriuscula, enhances signaling 28.
Although recent work has demonstrated that biofluorescence is widespread in marine cartilaginous and ray-finned fishes4,21, very few studies have examined the fluorescent properties of these lineages. Further assessment of these spectral properties is critical to advancing our understanding of the evolution of biofluorescence in marine vertebrates and its potential impact on their evolution, behavior, diversification rate, and the composition of marine ecosystems in general. Here we focus on cartilaginous fishes and examine the photoreceptor cells in two species of catsharks (Scyliorhinidae: Cephaloscyllium ventriosum and Scyliorhinus retifer) that exhibit bright green fluorescence patterns resulting from the presence of fluorescent compounds in their skin. We performed hyperspectral imaging of their skin and investigated how the green-dominated fluorescence affected the appearance of these sharks to conspecifics given their spectral sensitivity and the blue ambient water background. We also assembled a “shark-eye” camera and imaged catsharks in their natural environment with filters closely matching the absorbance spectrum of the measured visual pigment, as well as with underwater fluorescence photography. Models for estimating the lightness perception of these monochromatic sharks do not exist, therefore, we used models developed for the human visual system to gain insight into how biofluorescence changes the appearance of the sharks in the eyes of their conspecifics, compared to the way they appear under white light.
Results
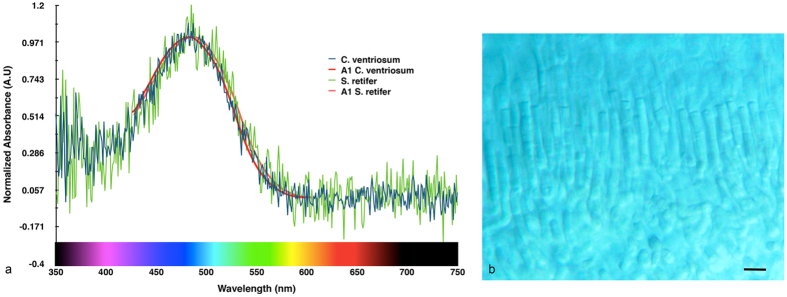
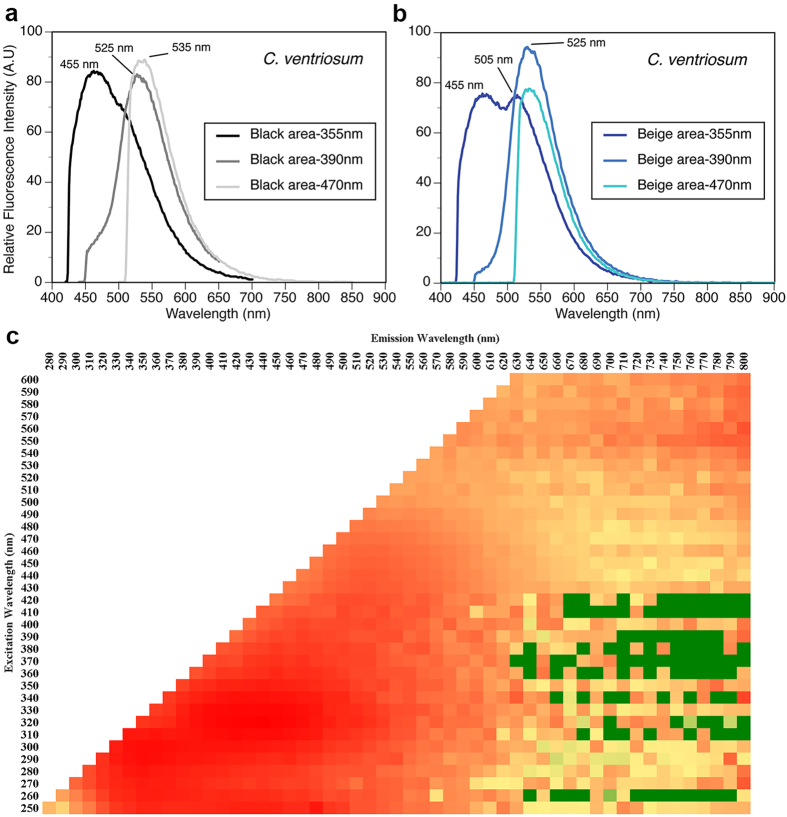
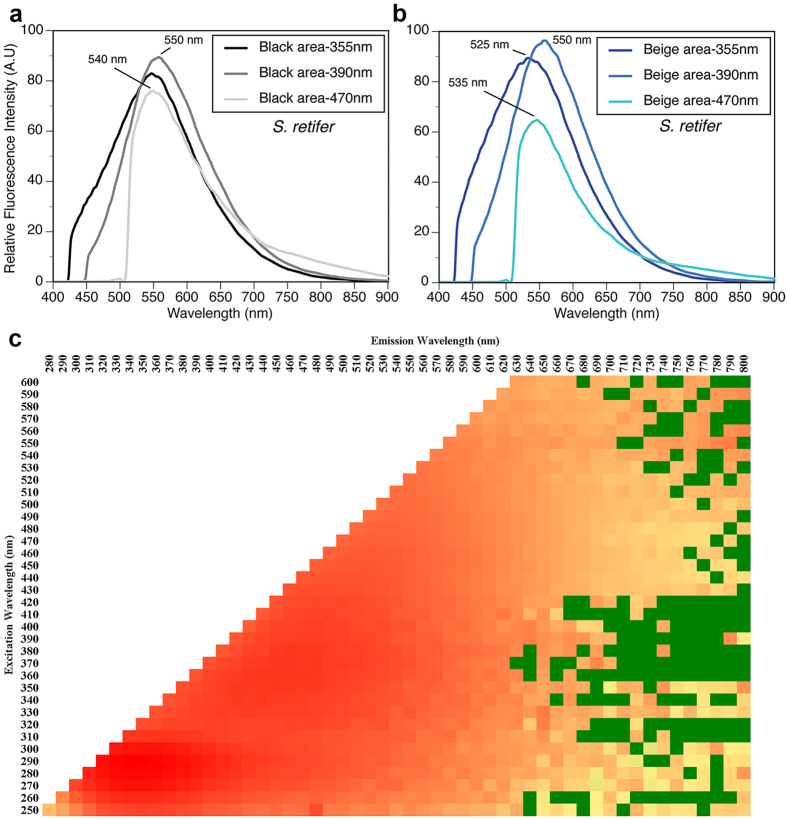
Microspectrophotometry (MSP) conducted on the retina of Cephaloscyllium ventriosum revealed a single visual pigment with an absorbance maximum (λmax) at 484 ± 3 nm and an absorbance range at half maximum (λ1/2max) of 440–540 nm. Scyliorhinus retifer was also found to possess a single visual pigment with a λmax of 488 ± 3 nm and a λ1/2max of 440–540 nm (Fig. 1). C. ventriosum and S. retifer were imaged and epidermal tissue from the flattened dorsal side of their head spectrally analyzed using a hyperspectral imager in fluorescence mode (Figs 2 and 3). The dermal patches of C. ventriosum and S. retifer that were imaged always included one of the darker/black reticulated patches (in bright field) and light beige areas, which is the typical repeating, reticulated pigmentation pattern characteristic of these catsharks (Figs 4 and 5). Fluorescence images clearly showed that at 355 nm excitation, bright blue fluorescence (455 nm emission [em.] with a shoulder towards 500 nm; Figs 2 and 3a) was associated with the darker areas of the skin, whereas some dim blue-green fluorescence (455–505 nm em.; Figs 2 and 3b) was observed in the lighter beige regions of the skin. When excited at 390 and 470 nm, the fluorescence images show that only intense green fluorescence (525–535 nm em.) was generated from both the darker and lighter pigmented areas of the skin. Green fluorescence was most intense from the lighter beige colored areas (Figs 4 and 5). When analyzed via hyperspectral mapping, the blue and green emission spectra from the shark skin were clearly spatially separated and mapped to the darker areas (blue emission spectrum) and beige areas (green emission spectrum), respectively.
Figure 1.
(a) Microspectrophotometry data from Celphaloscyllium ventriosum and Scyliorhinus retifer. Maximum absorbance of 484 and 488 nm, respectively. (b) Long rods of S. retifer (scale =10 μm).
Figure 2. Spectral characterization of C. ventriosum.
(a) Fluorescence spectra following excitation at 355, 390, and 470 nm from black areas of the skin, using hyperspectral imaging analysis. (b) Same analysis from beige areas of the skin. (C) Excitation emission matrix (log scale representation) after extraction of fluorescent compounds from skin in methanol solvent, which included both black and beige areas.
Figure 3. Spectral characterization of S. retifer.
(a) Fluorescence spectra following excitation at 355, 390, and 470 nm from black colored areas of the skin, using hyperspectral imaging analysis. (b) Same analysis from beige colored areas of the shark skin. (c) Excitation emission matrix (log scale representation) after extraction of fluorescent compounds from skin in methanol solvent, which included both black and beige areas.
Figure 4.
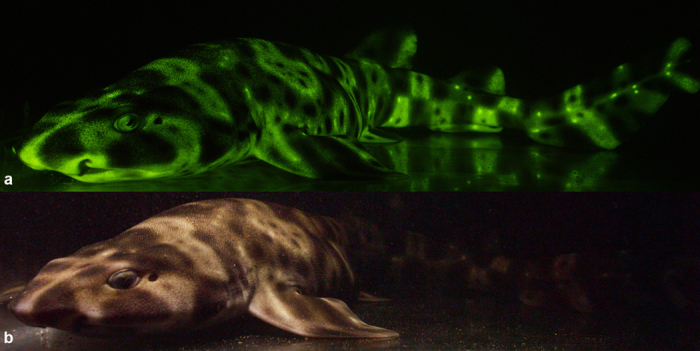
(a) Fluorescent (excitation 450–500 nm; emission 514 LP), and (b) white light image of a 54.0 cm female swell shark (Cephaloscyllium ventriosum).
Figure 5.
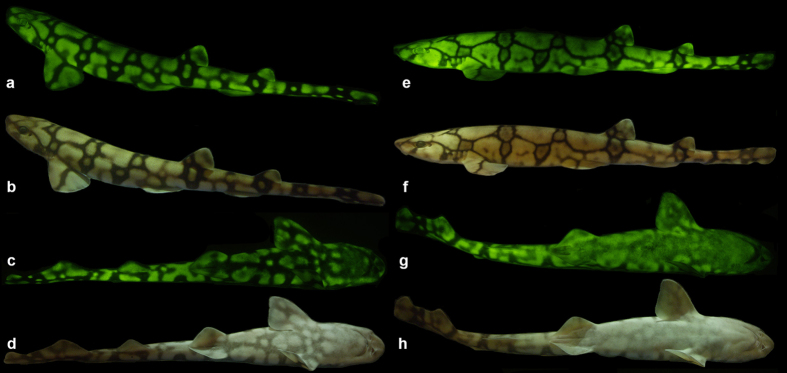
(a–d) Fluorescent and white light pigmentation pattern of a female chain catshark (Scyliorhinus retifer, 32.2 cm; and (e–h) of a male S. retifer (26.4 cm). Males have pelvic claspers that fluoresce, whereas the females lack claspers, and the reticulated pigmentation pattern is more pronounced in females (thicker dark black/brown lines), particularly ventrally, under both fluorescent and white lighting.
These analyses conducted directly on the skin were complemented by spectral analysis of skin extracts after immersion in different solvents (methanol, acetone, dichloromethane), which also showed fluorescence in the blue and green spectral range when excited at 355 nm and 390 nm, respectively. These results confirmed the occurrence of two biofluorescent compounds (or the same compound in two different chemical forms) in distinct areas of the skin corresponding to the darkly pigmented areas versus light beige regions when observed in bright field. The presence of patches of fluorescence suggests that the observed fluorescence does not result from a common cellular constituent (i.e. keratin). Cephaloscyllium ventriosum possesses bright beige spots (Figs 4b and 6a), which correspond to significantly higher (>100–150×) levels of green fluorescence intensity (data not shown), than the darker pigmented, reticulated portions of the body (Figs 4a and 6c). Whether these spots result from increased concentration of the particular green fluorescent protein/compound or from a decrease of skin pigment locally remains to be determined.
Figure 6.
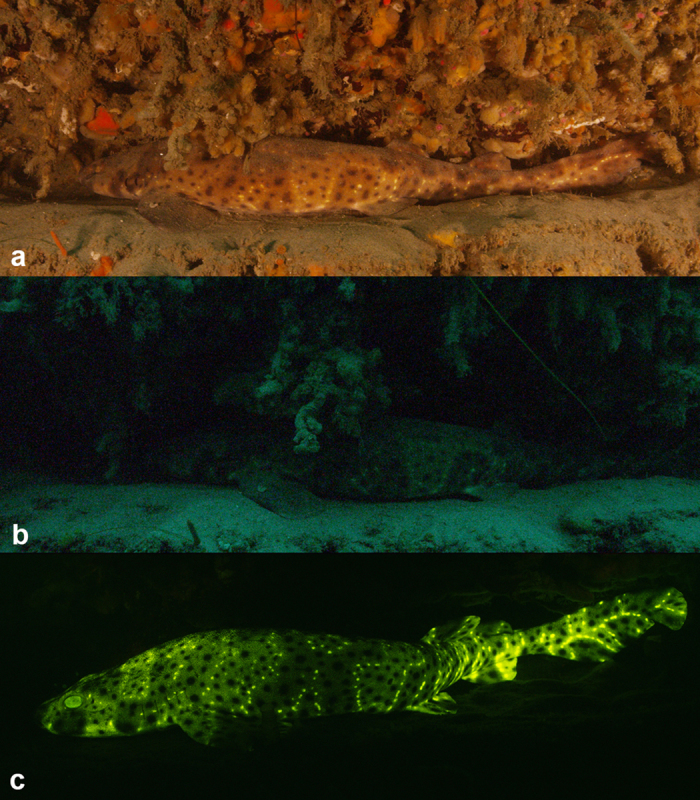
Cephaloscyllium ventriosum in its natural environment in Scripps Canyon (San Diego) under (a) white light; (b) natural light; (c) when excited with 450/70 nm calumniated lighting and imaged with a 514 nm long-pass emission filter.
The substance responsible for fluorescence was extracted in methanol (shown to be the best of the various solvents tested) before being analyzed for spectral excitation and emission characteristics, and depicted in an Excitation Emission Matrix (EEM). Skin tissues for extraction were obtained from the dorsal side of the head, where the skin can be more evenly and easily removed because of the hardness of the underlying skull. Darker patches did not show a clearly defined line separating them from the lighter beige patches, but instead showed a gradual increase in darkness moving toward the patch. In this gradual transition between beige and darker patches, fluorescence was still observed from under the dark pigments, as confirmed from the observation of fluorescence in cross-section (Figs S2 and S3). This suggests that the fluorescence is clearly muted by the pigments of the darker patches, whereas the same level of the fluorescent substance can be found throughout the epidermis (Figs S2 and S3). In C. ventriosum the fluorescent substance exhibited a wide range of excitation, ranging from 250–450 nm (yellow area in EEM; Fig. 2c) and peaking between 280–350 nm (dark orange/red area in EEM; Fig. 2c). Likewise, it had a broad emission peak ranging from 300–600 nm and peaking between 320–490 nm (Fig. 2c). Overall, the excitation spectrum was similar in S. retifer, ranging from 250–550 nm (yellow area in EEM; Fig. 3c) and peaking between 270–300 nm (dark orange/red area in EEM; Fig. 3c). Fluorescent emission in S. retifer ranged from 300–600 nm, peaking between 310–390 nm (Fig. 3c).
In-situ Imaging
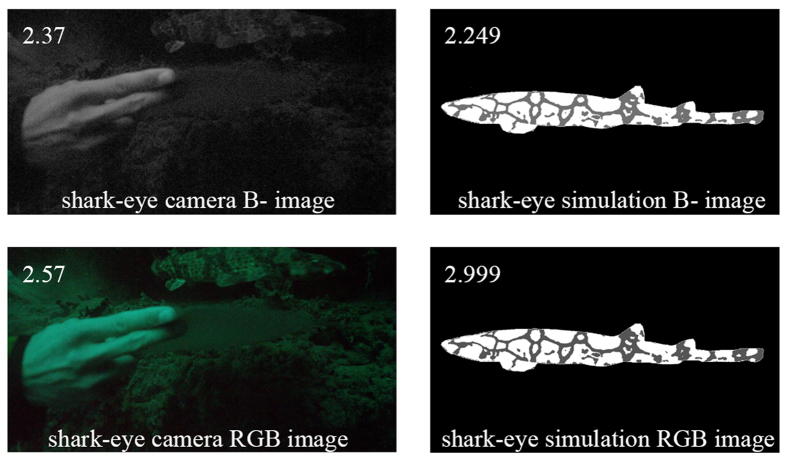
We imaged C. ventriosum in their natural environment using only ambient lighting; with a “shark-eye” camera that closely matched the absorbance spectrum of the visual pigments of C. ventriosum and S. retifer; and with a lighting and camera system equipped to excite fluorescence and only capture the emitted fluorescent spectral range produced by the animal (Fig. 7). Under normal ambient underwater lighting conditions and without the use of lights or filters, C. ventriosum was almost not visible against the canyon wall (Fig. 6b, Supp. Fig. 1). When imaged with a filter pack closely matching the absorbance spectrum of the visual pigment of C. ventriosum using only natural light (Fig. 8), luminosity contrast was created on areas where the most intense fluorescence is distributed on the shark (lighter skin areas) compared to the rest of the body (Fig. 9). This was also supported by our RGB simulations of both C. ventriosum (Fig. 10) and S. retifer (Fig. 11).
Figure 7. Scientific biofluorescent imaging camera and lighting system developed to obtain 4 K imagery shown underwater in Scripps Canyon, San Diego, CA. Image courtesy of Kyle McBurnie.
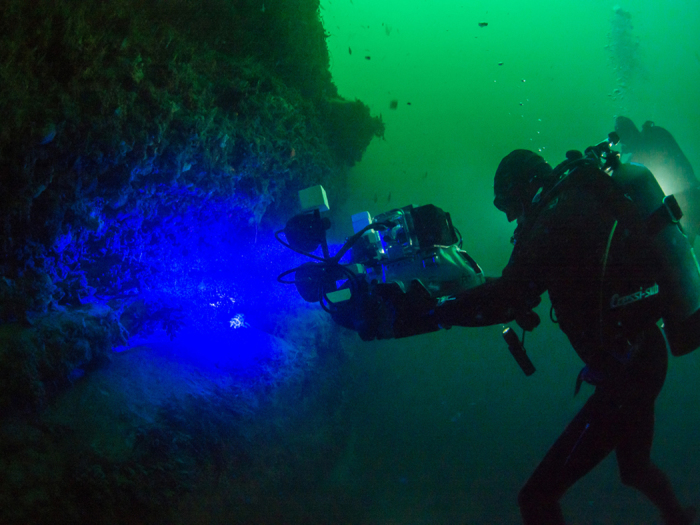
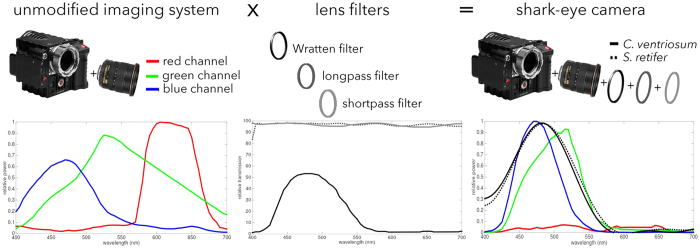
Figure 8. “Shark-eye” imaging was done by fitting three lens filters on the Red Epic camera, and keeping the blue channel response of the resulting system.
Camera sensor response after the placement of the lens filters closely matches the visual pigment of Cephaloscyllium ventriosum and Scyliorhinus retifer. The transmission through the lens was assumed to be 100% for practical purposes.
Figure 9. Beige/black patch intensity between the actual “shark-eye” camera, and our simulation.
Image taken while holding an underwater spectra paper.
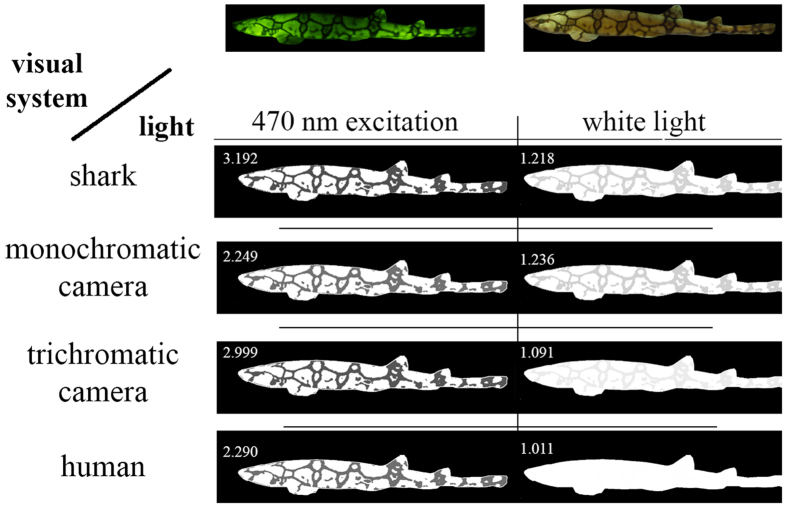
Figure 10. Cephaloscyllium ventriosum model of the shark eye as a monochromatic human with the  spectral sensitivity curves given in Fig. 1.
Reflectance spectra for darkly pigmented and beige skin components of each shark species from Fig. 2 taken under white light, and emitted after exposure to 470 nm monochromatic light. Radiance and fluorescence spectra for dark and beige skin components of each shark species were converted into XYZ tri-stimulus values and then to sRGB color space30.
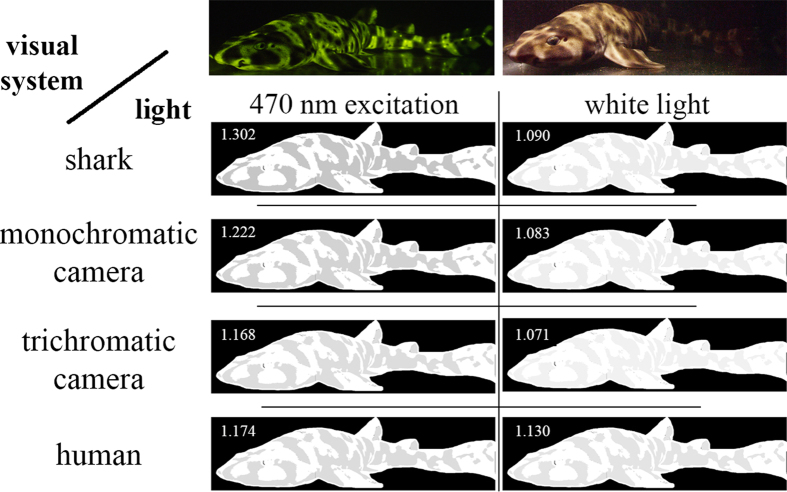
Figure 11. Scyliorhinus retifer model of the shark eye as a monochromatic human with the  spectral sensitivity curves given in Fig. 1.
Reflectance spectra for dark and beige skin components of each shark species from Fig. 2 taken under white light, and emitted after exposure to 470 nm monochromatic light. Radiance and fluorescence spectra for dark and beige skin components of each shark species were converted into XYZ tri-stimulus values and then to sRGB color space30.
Aquarium and Laboratory Imaging
Cross-sectional images of the two catshark species show the fluorescent material to be localized solely on the dermis and the lens of the eye (Supp. Figs 2 and 3). Fluorescence was also observed in the egg cases of both species (Supp. Fig. 4). Cephaloscyllium ventriosum has small intensely green fluorescent spots over much of the body, which appears light beige under white light. Females also have a unique “face mask” with light spots in the center on each side and more dense ventral spotting that extends further anteriorly than in males. Scyliorhinus retifer exhibits an alternating light and dark reticulated pigmentation pattern (Fig. 5), but it lacks the brightly fluorescent spots characteristic of C. ventriosum (Fig. 4). In S. retifer, females, the reticulated pigmentation pattern is more pronounced (i.e., thicker dark brown/black lines), particularly ventrally, under both fluorescent and white lighting (Fig. 5).
Modeling of visual pigments that best discriminate shark biofluorescence
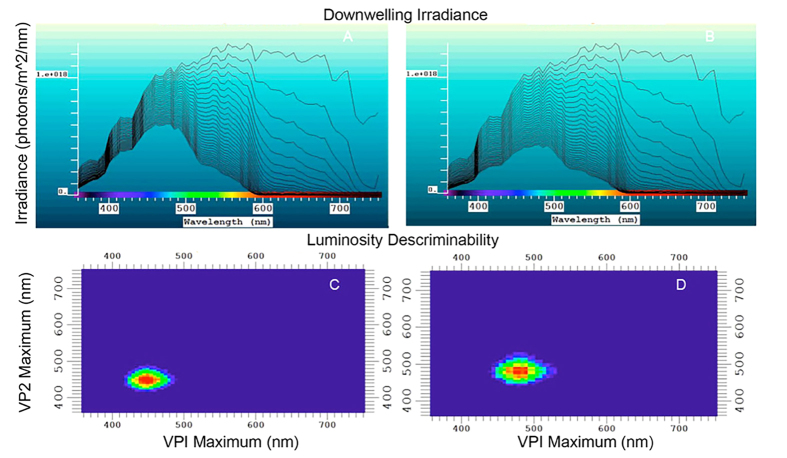
The model developed by Loew and Zhang29 was employed to calculate which visual pigment(s) would best discriminate between green fluorescence and gray targets based on luminosity contrast using the background spacelight estimated at increasing depths within Scripps Canyon (San Diego County, California), where several C. ventriosum were imaged (at ~30 m depth; Fig. 12). As with all such models, an iterative procedure was used to reduce irradiant intensity while varying the λmax of visual pigments, taking into account the properties of the water using a derived equation of radiative transfer. The model showed that even at the upper reaches of their habitat (e.g., 30 m where C. ventriosum was filmed in situ), it was possible for their visual apparatus to detect blue/green fluorescence.
Figure 12.
Calculated downwelling irradiance curves from 1 meter to 30 meters depth in (A) oligotrophic blue water, (B) more productive blue/green water that a visual pigment for 485 nm (such as in C. ventriosum) would have been best matched29. (C) Locus of the visual pigments best able to discriminate targets against the background based on luminosity at 30 meters depth in blue water, and (D) in blue/green water. In both cases, the locus is such that quantum catch in the given water type is matched as expected from the “contrast hypothesis.” Red loci are the optimal with those of other colors showing decreasing optimization.
An analysis was conducted to determine what water color was optimal for the 484 nm (and 488 nm of S. retifer) visual pigment, along with the best-tuned pigments for discriminating gray targets in clear, blue oceanic water (i.e., no chlorophyll or dissolved organic matter). The 484 nm and 488 nm pigments are better matched for bluer, deeper water. However, the visual pigment of S. retifer is still able to discriminate green biofluorescence in all oceanic or in-shore waters, as long as the target is close enough and there are sufficient photons to stimulate fluorescence above background noise in that part of the spectrum.
Another analysis was conducted where radiance and fluorescence spectra for dark and beige skin components of each shark species were converted into XYZ tri-stimulus values and then to sRGB color space30. Under these conditions we find that fluorescence creates greater luminosity contrast for both C. ventriosum (Fig. 10) and S. retifer (Fig. 11), a result also confirmed in situ with the “shark-eye” camera (Fig. 9).
Phylogenetic Reconstruction
We conducted a molecular phylogenetic analysis using both mitochondrial and nuclear gene sequences to determine the distribution of biofluorescence in Elasmobranchii, as well as to determine the number of times the phenomenon has evolved in this diverse lineage. Our results show that biofluorescence has evolved at least three times in Elasmobranchii, in the distantly related families Urotrygonidae (American round stingrays), Orectolobidae (wobbegongs), and Scyliorhinidae (catsharks) (Fig. 13).
Figure 13. Family-level maximum likelihood phylogeny of elasmobranchs (species level phylogeny presented in Supp. Fig. 5).
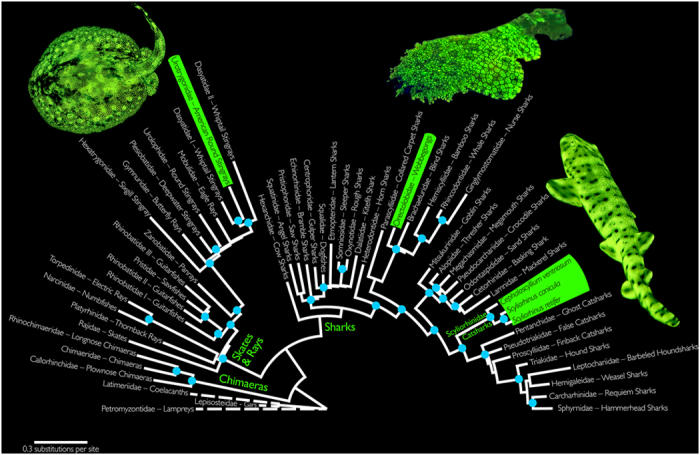
Blue circles on nodes indicate bootstrap support values ≥70%. Representatives of the three known biofluorescent elasmobranch clades are highlighted in green. Outgroups are marked with dashed lines. Image of biofluorescent orectolobid © BioPixel.
Discussion
Light from the sun is quickly absorbed in the ocean, resulting in a stable narrowband blue spectral setting. This is an ideal environment for marine organisms to evolve biofluorescent compounds that absorb abundant blue, high-energy, short wavelength photons, which they emit back at longer, lesser energy wavelengths21. Following the recent report of biofluorescence in two species of catsharks, C. ventriosum and S. retifer4, we addressed the possibility that this spectral property plays a role in the biology and ecology of these small reclusive sharks.
With reference to the human visual system, biofluorescence had the effect of increasing color and brightness contrast (ratio of the perceived intensity of light), and therefore increasing the visibility of the sharks. There is often a tendency to describe animal coloration and pigmentation pattern from the perspective of the human visual system31,32. This is problematic because not only is color a sensation defined relative to the human visual system, but also the number of photoreceptors in the human eye and their spectral sensitivities differ greatly from most animals, especially those that live in aquatic habitats33. Thus, we first investigated whether these sharks could even detect the green fluorescent light being emitted by their conspecifics and found that both species could see well in this region of the visual spectrum. As would be expected for animals adapted for visual tasks in deep blue oceanic waters34, the individual visual pigment (i.e., each species has only one) in the eyes of C. ventriosum and S. retifer peaks at 484 ± 3 nm and 488 ± 5 nm (Fig. 1), respectively. These two species have pure rod retinas based on outer segment appearance. This condition has been found for several other elasmobranchs35,36,37,38; however, most other elasmobranchs have duplex retinas with both rods and cones similar to the vast majority of diurnal aquatic animals39.
The two species of catshark studied here possess essentially monochromatic vision typical of nocturnal or deep-dwelling species, which is intriguing as their visual pigment is slightly green-shifted compared to the 465 nm spectral average of deep ocean water11. Cephaloscyllium ventriosum occurs from relatively shallow habitats, down to over 360 m40, and S. retifer is found between ~70–550 m41. The deeper environments where these catsharks occur are dominated by the higher-energy, blue photons. Cephaloscyllium ventriosum is considered nocturnal and generally solitary, feeding at night by ambushing prey in a “lie and wait” fashion42. In this study, we observed C. ventriosum during the day and at night resting in groups of 2–5 individuals in crevices on the walls of Scripps Canyon and among rocks and kelp, as well as over sandy areas in the vicinity of Santa Barbara.
As a result, we wanted to determine whether biofluorescence provided these sharks an advantage in terms of visibility to conspecifics in their respective habitats. This led us to also perform hyperspectral analysis of the sharks’ skin to determine the precise wavelengths emitted by the fluorescent material in the dermis. Both sharks produced primarily green fluorescence (525–550 nm), although some blue fluorescence was also observed, especially for C. ventriosum when excited at 355 nm in the UV portion of the spectrum, which is thought to be a wavelength that has little ecological relevance given its poor penetration of the water column., The green spectral range of color produced by fluorescence of the shark’s skin corresponds to the dominant ambient light color calculated by the downwelling irradiance at shallow depths.
Biofluorescence Enhances Luminosity Contrast with the Surrounding Marine Environment
To quantify how much contrast changes with biofluorescence, we modeled the shark skin appearance under white light when it did not fluoresce and under narrowband light that excited fluorescence. How colors are perceived by the organisms observing them depends upon the spectrum of the ambient light in their habitat, the optical properties of the environment in which relevant visual tasks are performed, and their visual systems43. This is the first study to investigate the spectral sensitivities of the eyes of these sharks, revealing that they are monochromats most sensitive to light around 480 nm. No data on how these sharks perceive light exists. Thus, we used color perception tools developed for the human visual system and modeled sharks as monochromatic humans. We found that fluorescence increased the contrast between the gray and beige patches of the shark skin for both species. This trend was also captured by the “shark-eye” camera for C. ventriosum in its natural habitat. In essence, the luminosity contrast created by the shark’s biofluorescence can result in a conspecific being more apparent than a non-fluorescent shark (Fig. 14). The bright fluorescent “spots” on C. ventriosum would also correspond to anatomical areas of enhanced luminosity contrast (Fig. 4).
Figure 14. Heuristic illustration of the effect of fluorescence on the appearance of the swell shark, simulated from the perspective of other swell sharks.
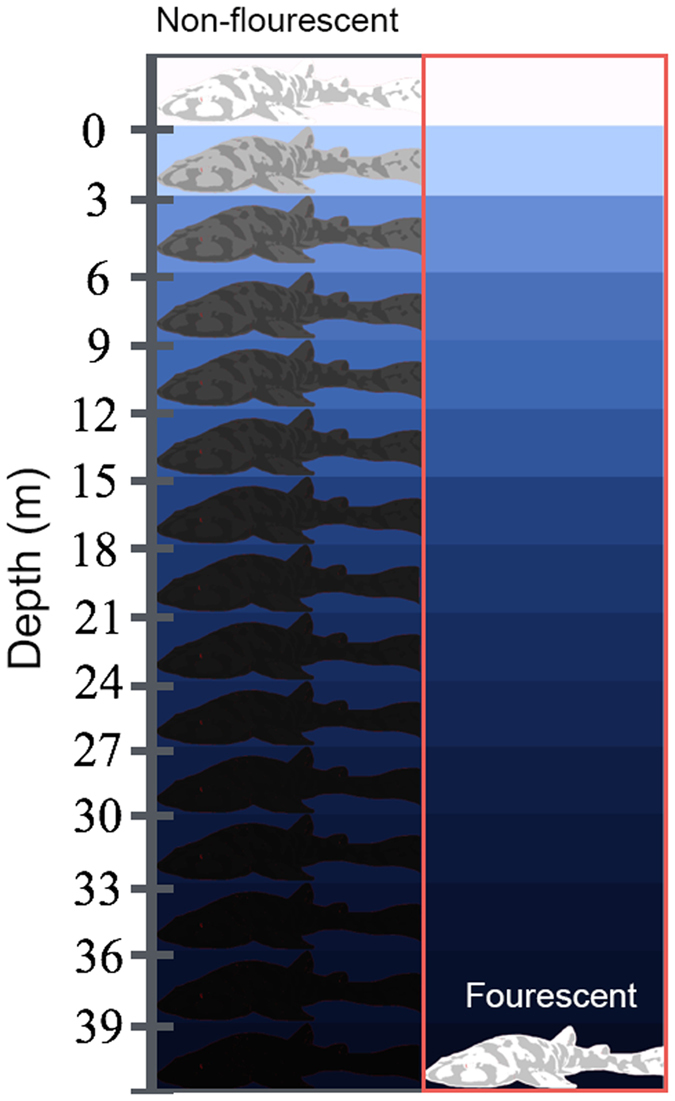
The left column shows the appearance of the shark based on the reflectance spectra of the skin and ambient light; the right column shows how the appearance changes when fluorescence is emitted due to excitation by narrowband light. The blue colors in each box are the RGB renderings of ambient light at that depth simulated using in situ irradiance measurements65 from Eilat, Israel (the most comprehensive published depth-gradient spectral data currently available). The white and gray patches in each shark drawing are scaled to show relative contrast rather than absolute colors. This illustration demonstrates that if the patches of the shark skin did not fluoresce, the contrast between the light and dark patches diminish with depth and the shark would match the background at depth. Fluorescence increases contrast between the dark/light patches of the shark by providing light spectra not naturally present in the blue ocean environment.
According to the “sensitivity hypothesis” for maximal discrimination of targets against a background based on brightness (luminance), a visual pigment matching the background spacelight is optimal44. Since the area under the absorbance spectrum of the visual pigment is the capture area, selection would place the visual pigment λmax such that the absorbance envelope maximizes the overlap with the water spectral radiance in the direction of view. For clear blue water, as depth increases the spectral irradiance narrows with a peak in the blue, while overall brightness also decreases. For horizontal visual tasks, the sharks would be able to operate at great depth and still be above the signal-to-noise limit (see calculations of45). The 484 nm and 488 nm visual pigments found in C. ventriosum and S. retifer, respectively, are generally referred to as “deep-sea” visual pigments. They are spectrally situated to maximize quantum catch in clear blue oceanic water and are suited for carrying out visual tasks at depth. With only a single visual pigment and no pre-retinal filters, the task of detecting the fluorescent pattern against the background (non-fluorescing areas of skin or the background spacelight) can only utilize brightness (luminosity) differences. While the sharks 484 nm and 488 nm visual pigments are not spectrally situated to maximize contrast between the green fluorescence and the blue background spacelight, their visual pigment absorbance still overlaps the spectral bandwidth of the fluorescence which means that the dark and light reticulated patterns can still be detected.
These two fluorescent species of catshark live in deeper marine habitats subject to mainly blue light, and for which their visual pigments are adapted. Cephaloscyllium ventriosum was chosen for examination in situ, as opposed to S. retifer, as the latter species has a considerably deeper distribution (>73 m) and has not yet been observed directly via SCUBA41. The depth of ~30 m at which C. ventriosum was imaged in situ is the upper range of its habitat. Yet, at that depth, the shark is also able to see and identify conspecifics given that its λ1/2max extends up to 540 nm.
Phylogenetic Investigations Indicate that Biofluorescence Has Evolved at Least Three Times in Cartilaginous Fishes
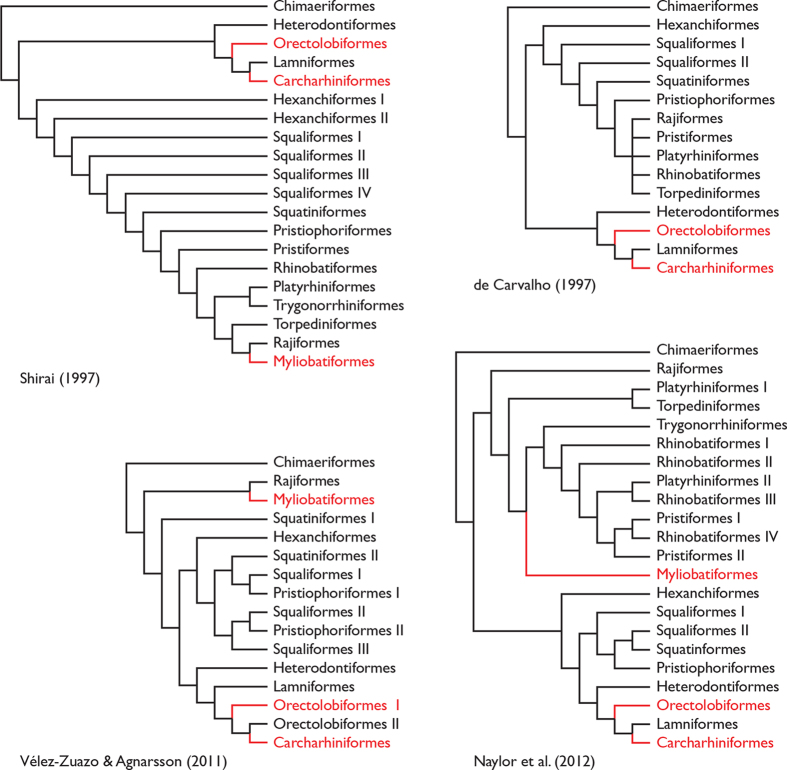
At present, there are currently five known elasmobranch species that exhibit green fluorescence. To lay the foundation and produce a predictive framework for understanding the evolution of biofluorescence in elasmobranchs, we generated a new phylogenetic hypothesis of the assemblage because previous studies (Fig. 15) either did not explicitly analyze all biofluorescent families46,47,48, or did not utilize more than a single mitochondrial gene for its phylogenetic reconstruction49. Further, these prior studies exhibit conflicting hypotheses of relationships among elasmobranchs, particularly with regard to the placement of batoids. Our novel phylogenetic hypothesis with more balanced sampling is more consistent with recent classifications (Supp. Table 1); only the Rhinobatiformes were recovered as polyphyletic. Beyond its utility in exploring our current understanding of the evolution of biofluorescence in elasmobranchs, the resulting phylogenetic hypothesis presents a multi-gene hypothesis of relationships for elasmobranchs that researchers can use as a predictive framework for exploring the evolution of this largely unexplored phenomenon4,50. Further, this novel phylogenetic framework will aid researchers exploring the evolution of the compounds involved in elasmobranch fluorescence.
Figure 15. Previous phylogenetic hypotheses of elasmobranchs based on morphological data46,47 or DNA-sequence data48,49 highlighting the evolution of biofluorescence (red).
In many cases the relevant biofluorescent families or genera were not included in these analyses, so optimizations are based on ordinal level presence only.
The five known fluorescent elasmobranch species belong to three distantly related families, Urotrygonidae (American round stingrays), Orectolobidae (wobbegongs), and Scyliorhinidae (catsharks), indicating that biofluorescence has evolved at least three times in elasmobranchs (Fig. 13). For bony fishes, we reported that biofluorescence was most common and interspecifically distinct in cryptically patterned, reclusive coral reef species4. Interestingly, these three elasmobranch families also comprise reclusive and cryptically patterned species that are difficult to spot in their natural environment; and perhaps for these reasons, the predators of these sharks are not known. We caution that our sampling of biofluorescence in lineages within Elasmobranchii has not been exhaustive, and it is likely that biofluorescence has evolved in additional families and will be even more widespread in sharks and rays than we currently know (Fig. 13). We have been been able to scan only a few holocephalans (chimaeras) to date; however, fluorescence has not yet been detected in this lineage. Our recognition that biofluorescence is most prevalent in cryptic reef fishes, combined with the predictive phylogenetic hypothesis, identifies the families that should be explored in more detail or that require even an initial investigation of this feature.
Although biofluorescence is herein shown to be phylogenetically widespread in elasmobranch fishes, occurring in three distantly related lineages, our current investigation suggests that this characteristic has not evolved nearly as many times as we observe in the considerably more diverse bony fishes. In contrast to the biofluorescent representatives in Orectolobidae, Scyliorhinidae, and Urotrygonidae, the examined representatives from Carcharhiniformes (Carcharhinidae, Sphyrnidae, Triakidae), Heterodontiformes (Heterodontidae), Lamniformes (Odontaspididae), Myliobatiformes (Dasyatidae, Myliobatidae), Orectolobiformes (Ginglymostomatidae), Squaliformes (Squalidae), and Torpediniformes (Torpedinidae) were not observed to be biofluorescent.
Scyliorhinids are enigmatic elasmobranch species that live in shallow to deep environments. Scyliorhinidae is a moderately large family that comprises nine genera and 66 species51. Cephaloscyllium ventriosum is one of 18 currently recognized species of Cephaloscyllium52 and is endemic to the eastern Pacific53. In this study, we examined the two known fluorescent species of catsharks (Scyliorhinidae), although it is quite likely that with further study, several additional (or all) members of this family will be shown to exhibit green fluorescence. In both species, fluorescent materials arranged in distinct patterns are located solely on the dermis. In C. ventriosum these patterns appear to be sexually dimorphic with females having a unique “face mask” and more dense ventral spotting that extends further anteriorly than in males. In addition, the pelvic claspers of males, which are lacking in females, are strongly fluorescent in both C. ventriosum and S. retifer (Fig. 5). Sexual dimorphism in the dermal denticles has also previously been reported for the Lesser-Spotted Catshark (Scyliorhinus canicula)54.
Given the widespread, but not ubiquitous, presence of biofluorescence in elasmobranchs, coupled with a visual apparatus to detect the phenomenon and the potential for fluorescent skin to create greater contrast at depth, leads to questions regarding the distribution and evolution of biofluorescence in cartilaginous fishes in general and the role fluorescence plays in shark and ray behavior, biology, and diversification. The fact that these cryptically patterned biofluorescent sharks and rays are capable of visualizing their own fluorescent emissions, coupled with sexually dimorphic fluorescent patterns and the fact that they would be difficult to spot by predators lacking similar visual capabilities, is suggestive of a communication/species recognition role for fluorescence. Biofluorescence could also potentially help camouflage catsharks against potential predators who do have color vision55, although very little is known regarding the predators of catsharks and the visual systems of only a few marine organisms have been studied in detail. Round stingrays (e.g., Urobatis jamaicensis) that emit green fluorescence4 possess three cone visual pigments (475 nm, 533 nm, and 562 nm) and two rod pigments (500 nm and 499 nm)6, which indicates sensitivity to wavelengths in their biofluorescent emission range. Biofluorescent footage of the wobbegong or carpet sharks (Orectolobidae) has also been documented by Richard Fitzpatrick of Biopixel (unpublished).
Historically, the visual sense of elasmobranchs has been a topic of investigation for over a century56, although considered of minor importance compared with their other senses, particularly olfaction. It is now known that many elasmobranchs possess well-developed eyes36, as well a large sensory brain dedicated to processing visual information36. Yet, the visual system of just a few of the nearly 1,235 elasmobranch species has been investigated in detail (see9, for review). Catsharks possess the ability to detect the green biofluorescence that is emitted by their conspecifics and this fluorescence creates greater contrast with the surrounding habitat in deeper blue-shifted waters (under solar or lunar illumination).
Methods
Microspectrophotometry
Cephaloscyllium ventriosum was obtained from Marinus Scientific, LLC, and S. retifer was obtained from the Riverhead Aquarium (NY). This study was approved and carried out in strict accordance with the recommendations in the Guidelines for the Use of Fishes in Research of the American Fisheries Society and Cornell University’s Institutional Animal Care and Use Committee (IACUC). Specimens were examined within 4 hr of their arrival at Cornell University. Specimens were dark adapted for at least 2 hr at 50 °C to facilitate handling prior to sacrifice by pharmaceutical-grade MS-222 (IACUC protocol # 2014-0112). Enucleations were performed under dim red light (Kodak safelight No. 2, 15 W bulb), with all further preparations done under infrared (IR) lighting using LEDs and appropriate image converters. Eyes were hemisected and placed in cold phosphate buffer, pH 7.4, supplemented with 6% sucrose. A small piece of the isolated retina was transferred to a cover slip where it was macerated with razor blades and sealed with an overlying cover slip edged with silicone grease.
Microspectrophotometry (MSP) was conducted using a computer-controlled, single-beam instrument, previously described57, that classifies visual pigments based on their distinct spectral absorbance characteristics and measures spectral sensitivities, and hence determines the performance and spectral limits of vision. To enable measurement into the UV, a Zeiss 32× 0.4 NA Ultrafluar was used as the condenser and a 100× 1.0 NA LOMO UV lens was used as the objective. With a 100 W tungsten-halogen lamp, it was possible to measure down to 350 nm with excellent signal to noise ratio and minimal visual pigment bleaching. All spectra ultimately saved and analyzed consisted of the even nanometer data from the down-scan interleaved with the odd nanometer data from the return scan. A Labview (National Instruments, Austin, TX) program was developed to handle all scanning, baseline correction, data acquisition, and file storage. A separate Labview program was used for data analysis. A Gaussian function was fit to the top 40 raw data points on either side of the estimated peak and an xmax determined by differentiation. The data were then normalized. Both vitamin A1- and A2-based visual pigment template curves using the calculated xmax were constructed based on58. The λmax was found by ‘sliding’ the templates along the wavelength axis and obtaining the best fit to the raw data as determined by ‘least squares’ fitting. The λmax obtained was verified by visual examination.
Hyperspectral Imaging
Cephaloscyllium ventriosum was assessed under a hyperspectral imager in fluorescence mode (using the PARISS® technology; LightForm Inc., Asheville, NC). Areas of skin (0.5 × 0.5 cm; 10× objective) obtained from the flat dorsal part of the head anterior to the dorsal fin, were mapped directly from the specimen. Using hyperspectral mapping analysis, each spectrum is acquired in full instantaneously, with <2 nm resolution (best between 380–950 nm). The technique thus provides a spatial dimension to spectra and allows for the assessment of morphological or ultra-structural distribution of spectra. Similar skin areas were also photographed in fluorescence under a Nikon 80i microscope using a monochrome Retiga 2000DC, CCD camera (QImaging, BC, Canada). Skin areas always included one of the darker/black spots (in bright field) separated by light beige areas, typical for these sharks. Wavelength calibrations are performed with a MIDL Hg+/Ar+ emission lamp (LightForm, Inc.). For relative comparison of spectra intensity, all acquisition parameters were kept the same, except for exposure time, which can be corrected for afterwards. All spectra are expressed relative to the lowest exposure time used across samples. Spectra from one individual sample showing >99% closeness of fit are identified as a single representative spectrum.
In-situ Imaging
Individuals of C. ventriosum were observed and imaged along the walls of Scripps Canyon, San Diego County, between 90–150 feet depth, in October 2014 and January 2015. A Red Epic-M 4K camera (Red Digital Cinema, Irvine, CA) mounted in an Aquatica Rouge underwater housing was used for three different kinds of imaging: white light, fluorescent, and “shark-eye”.
White light imaging
A Nikon NF-S Nikkor 24 mm 1:1.4G ED lens was used to image the sharks during the day under natural light using the setup described above.
Fluorescence imaging
To excite a fluorescence response, the Aquatica Rouge housing was fitted with custom designed blue excitation lighting. The LED light (Royal Blue) was collimated to ensure its perpendicular incidence on the scientific grade 450/70 nm interference filter surface (Semrock, Inc., Lake Forest, IL), minimizing the transmission of out-of-band energy. The ultra-bright LEDs, collimating lenses, filters, and exit diffusers were contained in custom-made water- and pressure-proof housings and powered by NiMH Battery Packs (Ikelite Underwater Systems, Indianapolis, IN). To image and record biofluorescence, a scientific-grade 514 nm long-pass emission filter (Semrock, Inc.) was embedded in front of the sensor of the camera. Cross-sections of both sharks were taken on an AxioZoom v16 stereo fluorescent microscope using a PlanNeoFluar Z 2.3×/0.57 objective and 38 HE GFP filter set.
Shark-eye imaging
To simulate the spectral response of the eye of C. ventriosum we devised a “shark-eye” camera that comprises a Red Epic camera, a pack consisting of a Wratten 44 A gelatin filter (Eastman Kodak, Rochester, NY), a 575 nm shortpass filter, and a 400 nm longpass filter (Edmund Optics, Inc., Barrington, NJ) placed over the Nikon NF-S Nikkor 24 mm 1:1.4G ED lens (Fig. 8). Imaging was conducted under natural light conditions. Camera spectral response specifications were obtained from59, and filter specifications were extracted from www.edmundoptics.com using the Data Thief software60. Since the spectral responses of the two catshark species examined are similar, and S. retifer is found in deep waters beyond the range of SCUBA, “shark-eye” imaging was only simulated for C. ventriosum.
RGB simulation of shark appearance
Given that this is the first study that presents the photoreceptor sensitivities of S. retifer and C. ventriosum, psychophysics-based models of their lightness perception do not exist. Therefore, to gain some insight regarding the appearance of these sharks to conspecifics when emitting fluorescence, as opposed to their appearance under broadband daylight, we employed the CIE 1931 XYZ color space61 that was developed to represent color perception for a human with trichromatic vision. Using this color space and the CIE 1931 2° Standard Observer Curves, we modeled the shark eye as a monochromatic human with the  spectral sensitivity curves given in Fig. 1. We use the reflectance spectra for dark and beige skin components of each shark species from Fig. 2 taken under white light and emitted after exposure to 470 nm monochromatic light, respectively, and for simplicity assume an ambient light profile of uniform white light. Radiance and fluorescence spectra for dark and beige skin components of each shark species were converted into XYZ tri-stimulus values and then to sRGB color space30. For simplicity of viewing and visual comparison, the intensity of the beige patches in an image of C. ventriosum (Fig. 10) and S. retifer (Fig. 11) has been adjusted to be white (RGB = [255,255,255]), and the ratio of the intensity of the beige patch to the dark patches are inscribed in the top left corner of each image. The appearance of the sharks to the “shark-eye” camera was also modeled using the trichromatic response of the camera sensor from Fig. 9, and its monochromatic version by only taking the blue-channel response.
Modeling of Visual Pigments
A model29 was employed to calculate what visual pigment(s) would be best at discriminating green fluorescence and some gray targets based on luminosity contrast using the background spacelight estimated for increasing depths in Scripps Canyon (San Diego County, California). A second analysis was conducted to determine what water color is a best match for the 484 nm (C. ventriosum) and 488 nm (S. retifer) visual pigments, along with the best pigments for discriminating gray targets in clear, blue oceanic water (i.e., no chlorophyll or dissolved organic matter). At some point, the contrast between the ‘target’ and the background, or other targets, reaches a limit set by the signal-to-noise ratio of the photoreceptors that contain a particular visual pigment. Although the model can deal with chromatic contrast situations, the fact that only a single visual pigment was found limited our use of the model to luminosity contrast alone. The model was also used to calculate the water color that would maximize the contrast for a visual system with a single visual pigment (484 nm for C. ventriosum and 488 nm of S. retifer) when observing gray targets, or a target with a spectral radiance like that of the fluorescent patches.
Phylogeny Reconstruction
To explore the evolution of biofluorescence in elasmobranchs, 77 taxa were analyzed in the current study, including 74 chondrichthyans representing 51 cartilaginous families. The GenBank sequences for the analyzed species can be found in Supp. Table 1. Alignments were generated using MUSCLE62, with the default parameters and a maximum number of iterations of ten. For the phylogenetic analysis, a total of 4,169 nucleotides from three genes, ND2 (1,047 base pairs), COI (647 base pairs), and RAG 1 (2,475 base pairs), were included. The dataset was partitioned by both individual gene fragments and codon position within each gene fragment for a total of nine partitions. A model of molecular evolution was chosen by the program jMODELTEST v.2.163, with the best fitting model under the Akaike information criteria (AIC) for each individual gene partition assigned, including: ND2 (1st position: GTR+I+G, 2nd position: GTR+I+G, 3rd position: TVM+I+G), COI (1st position: GTR+I+G, 2nd position: JC, 3rd position: HKY+G), and RAG1 (1st position: GTR+I+G, 2nd position: GTR+I+G, 3rd position: SYM+G). The maximum likelihood analysis was conducted in GARLI v2.0164, and the tree with the best likelihood score from 100 independent analyses was selected as the preferred hypothesis. A nonparametric maximum-likelihood bootstrap analysis was conducted for 200 random pseudoreplicates to assess nodal support. The tree with the optimal likelihood score is presented here (Fig. 13 and Supp. Fig. 5) to evaluate the evolutionary relationships of cartilaginous fishes and explore the distribution and diversity of biofluorescence.
Additional Information
How to cite this article: Gruber, D. F. et al. Biofluorescence in Catsharks (Scyliorhinidae): Fundamental Description and Relevance for Elasmobranch Visual Ecology. Sci. Rep. 6, 24751; doi: 10.1038/srep24751 (2016).
Supplementary Material
Acknowledgments
The study was funded by Air Force Office of Scientific Research (AFOSR) grant #FA9550-14-1-0008 and #MURI BIOPAINTS FA9550-10-1-0555 to DDD for the hyperspectral imager, National Science Foundation grants DEB #1257555 to JSS, #1258141 to WLS and MPD, and MRI# 1040321 to DFG, National Geographic Society grants (W101-10 to D.F.G. and W114-12 to J.S.S.), and The Ray and Barbara Dalio Family Foundation Explore 21 expedition grant to JSS, DFG, and VAP. The funders had no role in study design, data collection and analysis, decision to publish, or preparation of the manuscript. We thank the John B. Pierce Laboratory Machine Shop for building underwater lights; the Maurice Hatter Foundation for post-doctoral fellowship support to DA; Rick Elkus, Patty Elkus, Kyle McBurnie, and Nicholas Lebeouf for assistance and support in filming C. ventriosum in Scripps Canyon; the BBC Natural History Unit and Christoph Pierre for assistance in Santa Barbara; Joe Yaiullo of the Long Island Aquarium, Todd Gardner of Suffolk County Community College, Donnie Harrington and Tracy Romano of Mystic Aquarium for assistance imaging S. retifer; and Fernando Nosratpour and Leslee Matsushige of the Birch Aquarium for assistance imaging C. ventriosum. We thank Biopixel for generously allowing use of their image of an orectolobid and Kathleen Smith for reading and commenting on the manuscript.
Footnotes
Author Contributions Planned the study: D.F.G., E.R.L., D.D.D. and J.S.S. Performed microspectrophotometry analysis: E.R.L. Performed hyperspectral imaging and analysis: D.D.D. Performed fluorescence imaging and analysis: D.F.G., V.A.P. and J.S.S. Performed phylogenetic analysis: W.L.S., M.P.D. and J.H.S. Performed underwater imaging and field analyses: D.F.G. and J.S.S. Performed chemical analysis and spectral EEMs: J.P.G. and D.D.D. Performed modeling analysis: E.R.L. and D.A. Performed morphological analyses: D.F.G. and J.S.S. Wrote the manuscript: D.F.G., E.R.L., D.D.D., D.A., J.P.G., W.L.S., V.A.P. and J.S.S.
References
- Gruber D. F., Kao H.-T., Janoschka S., Tsai J. & Pieribone V. a. Patterns of fluorescent protein expression in Scleractinian corals. Biol. Bull. 215, 143–154 (2008). [DOI] [PubMed] [Google Scholar]
- Alieva N. O. et al. Diversity and evolution of coral fluorescent proteins. Plos ONE 3, e2680 (2008). [DOI] [PMC free article] [PubMed] [Google Scholar]
- Roth M. S. & Deheyn D. D. Effects of cold stress and heat stress on coral fluorescence in reef-building corals. Sci. Rep. 3, 1421 (2013). [DOI] [PMC free article] [PubMed] [Google Scholar]
- Sparks J. S. et al. The Covert World of Fish Biofluorescence: A Phylogenetically Widespread and Phenotypically Variable Phenomenon. Plos ONE 9, e83259 (2014). [DOI] [PMC free article] [PubMed] [Google Scholar]
- Gruber D. F. & Sparks J. S. First Observation of Fluorescence in Marine Turtles. Am. Museum Novit. 3845, 1–8 (2015). [Google Scholar]
- Bedore C. N. et al. A physiological analysis of color vision in batoid elasmobranchs. J. Comp. Physiol. A Neuroethol. Sensory, Neural, Behav. Physiol. 199, 1129–1141 (2013). [DOI] [PubMed] [Google Scholar]
- Marshall J., Carleton K. L. & Cronin T. Colour vision in marine organisms. Curr. Opin. Neurobiol. 34, 86–94 (2015). [DOI] [PubMed] [Google Scholar]
- Levenson D. H., Eckert S. A., Crognale M. A., Deegan J. F. & Jacobs G. H. Photopic Spectral Sensitivity of Green and Loggerhead Sea Turtles. Copeia 2004, 908–914 (2004). [Google Scholar]
- Lisney T. J., Theiss S. M., Collin S. P. & Hart N. S. Vision in elasmobranchs and their relatives: 21st century advances. J. Fish Biol. 80, 2024–54 (2012). [DOI] [PubMed] [Google Scholar]
- Tyler J. E. & Smith R. C. Measurements of spectral irradiance underwater. (Gordon and Breach, 1970). [Google Scholar]
- Jerlov N. Optical Oceanography. (American Elsevier Publ. Co., 1968). [Google Scholar]
- Ito H. & Tanaka A. Evolution of a divinyl chlorophyll-based photosystem in Prochlorococcus. Proc. Natl. Acad. Sci. U.S.A. 108, 18014–9 (2011). [DOI] [PMC free article] [PubMed] [Google Scholar]
- Shimomura O., Johnson F. & Y. S. Extraction, purification and properties of aequorin, a bioluminescent protein from the luminous hydromedusan, Aequorea. J Cell Comp Physiol 59, 223–239 (1962). [DOI] [PubMed] [Google Scholar]
- Pieribone V. & Gruber D. F. Aglow in the Dark: The Revolutionary Science of Biofluorescence. (Belknap Press of Harvard University Press, 2006). [Google Scholar]
- Matz M. V. et al. Fluorescent proteins from nonbioluminescent Anthozoa species. Nat. Biotechnol. 17, 969–73 (1999). [DOI] [PubMed] [Google Scholar]
- Gruber D. F. et al. Novel internal regions of fluorescent proteins undergo divergent evolutionary patterns. Mol. Biol. Evol. 26, 2841–2848 (2009). [DOI] [PMC free article] [PubMed] [Google Scholar]
- Shagin D. A. et al. GFP-like proteins as ubiquitous metazoan superfamily: evolution of functional features and structural complexity. Mol. Biol. Evol. 21, 841–50 (2004). [DOI] [PubMed] [Google Scholar]
- Deheyn D. et al. Endogenous Green Fluorescent Protein (GFP) in Amphioxus. Biol. Bull. 213, 95–100 (2007). [DOI] [PubMed] [Google Scholar]
- Hayashi S. & Toda Y. A novel fluorescent protein purified from eel muscle. Fish. Sci. 75, 1461–1469 (2009). [Google Scholar]
- Kumagai A. et al. A bilirubin-inducible fluorescent protein from eel muscle. Cell 153, 1602–11 (2013). [DOI] [PubMed] [Google Scholar]
- Gruber D. F. et al. Adaptive evolution of eel fluorescent proteins from fatty acid binding proteins produces bright fluorescence in the marine environment. Plos One 10, e0140972 (2015). [DOI] [PMC free article] [PubMed] [Google Scholar]
- Sparks J. S., Dunlap P. V. & Smith W. L. Evolution and diversification of a sexually dimorphic luminescent system in ponyfishes (Teleostei: Leiognathidae), including diagnoses for two new genera. Cladistics 21, 305–327 (2005). [DOI] [PubMed] [Google Scholar]
- Chakrabarty P., Davis M. P., Smith W. L., Baldwin Z. H. & Sparks J. S. Is sexual selection driving diversification of the bioluminescent ponyfishes (Teleostei: Leiognathidae)? Mol. Ecol. 20, 2818–34 (2011). [DOI] [PubMed] [Google Scholar]
- Davis M. P., Holcroft N. I., Wiley E. O., Sparks J. S. & Leo Smith W. Species-specific bioluminescence facilitates speciation in the deep sea. Mar. Biol. 161, 1139–1148 (2014). [DOI] [PMC free article] [PubMed] [Google Scholar]
- Heinermann P. H. Yellow intraocular filters in fishes. Exp. Biol. 43, 127–47 (1984). [PubMed] [Google Scholar]
- Haddock S. H. D. & Dunn C. W. Fluorescent proteins function as a prey attractant: experimental evidence from the hydromedusa Olindias formosus and other marine organisms. Biol. Open 4, 1094–104 (2015). [DOI] [PMC free article] [PubMed] [Google Scholar]
- Gerlach T., Sprenger D. & Michiels N. K. Fairy wrasses perceive and respond to their deep red fluorescent coloration. Proc. Biol. Sci. 281, 20140787 (2014). [DOI] [PMC free article] [PubMed] [Google Scholar]
- Mazel C. H., Cronin T. W., Caldwell R. L. & Marshall N. J. Fluorescent enhancement of signaling in a mantis shrimp. Science 303, 51 (2004). [DOI] [PubMed] [Google Scholar]
- Loew E. R. & Zhang H. In Communication in Fishes (ed. Ladich F., Collin S. P., Moller P. & Kapoor B. G.) 281–302 (Science Publishers, Inc., 2006). [Google Scholar]
- Akkaynak D. et al. Use of commercial off-the-shelf digital cameras for scientific data acquisition and scene-specific color calibration. J. Opt. Soc. Am. A. Opt. Image Sci. Vis. 31, 312–21 (2014). [DOI] [PMC free article] [PubMed] [Google Scholar]
- Bennett A. T. D., Cuthill I. C. & Norris K. J. Sexual selection and the mismeasure of color. 144, 848–860 (1994). [Google Scholar]
- Barber I., Arnott S. A., Braithwaite V. A., Andrew J. & Huntingford F. A. Indirect fitness consequences of mate choice in sticklebacks: offspring of brighter males grow slowly but resist parasitic infections. Proc. Biol. Sci. 268, 71–6 (2001). [DOI] [PMC free article] [PubMed] [Google Scholar]
- Partridge J. & Cummings M. In Adaptive Mechanisms in the Ecology of Vision (eds. Archer S. N., Djamgoz M. B. A., Loew E. R., Partridge J. C. & Vallerga S.) 251–284 (Kluwer Academic Publishers, 1999). [Google Scholar]
- Crescitelli F. In Photochemistry of Vision: Handbook of Sensory Physiology (ed. Dartnall H. J. A.) 245–363 (Springer, 1972). [Google Scholar]
- Sillman A. J., Letsinger G. A., Patel S., Loew E. R. & Klimley A. P. Visual pigments and photoreceptors in two species of shark, Triakis semifasciata and Mustelus henlei. J. Exp. Zool. 276, 1–10 (1996). [Google Scholar]
- Hart N. S., Lisney T. J. & Collin S. P. In Communication in Fishes (eds. Ladich F., Collin S. P., Moller P. & Kapoor B. G.) 337–392 (Science Publishers, Inc., 2006). [Google Scholar]
- Hart N. S., Theiss S. M., Harahush B. K. & Collin S. P. Microspectrophotometric evidence for cone monochromacy in sharks. Naturwissenschaften 98, 193–201 (2011). [DOI] [PubMed] [Google Scholar]
- Schieber N. L., Collin S. P. & Hart N. S. Comparative retinal anatomy in four species of elasmobranch. J. Morphol. 273, 423–40 (2012). [DOI] [PubMed] [Google Scholar]
- Lythgoe J. N. In Sensory Biology of Aquatic Animals (eds. Atema J., Fay R. R., Popper A. N. & Tavolga W. N.) 57–82 (Springer New York, 1988). doi: 10.1007/978-1-4612-3714-3 [DOI] [Google Scholar]
- Grover C. A. Population differences in the swell shark Cephaloscyllium ventriosum. Calif. Dep. Fish Game 58, 191–197 (1972). [Google Scholar]
- Springer S. & Sadowsky V. Subspecies of the western Atlantic cat shark, Scyliorhinus retifer. Proc. Biol. Soc. Washingt. 83, 83–98 (1970). [Google Scholar]
- Nelson D. R. & Johnson R. H. Diel Activity Rhythms in the Nocturnal, Bottom-Dwelling Sharks, Heterodontus francisci and Cephaloscyllium ventriosum. Society 1970, 732–739 (1970). [Google Scholar]
- Vorobyev M., Marshall J., Osorio D., Hempel de Ibarra N. & Menzel R. Colourful objects through animal eyes. Color Res. Appl. 26, S214–S217 (2001). [Google Scholar]
- Lythgoe J. N. In Photochemistry of Vision (ed. Dartnall H. J. A.) 7/1, 604–624 (Springer Berlin Heidelberg, 1972). [Google Scholar]
- Loew E. R. & McFarland W. N.. In The Visual System of Fish (eds. Douglas R. & Djamgoz M.) 1–43 (Springer Netherlands, 1990). doi: 10.1007/978-94-009-0411-8 [DOI] [Google Scholar]
- De Carvalho M. R. In Interrelationships of Fishes (eds. Stiassny M. L. J., Parenti L. R. & Johnson G. D.) 35–62 (Academic Press, 1997). [Google Scholar]
- Shirai S. In Interrelationships of Fishes 9–34 (Academic Press, 1997). [Google Scholar]
- Vélez-Zuazo X. & Agnarsson I. Shark tales: A molecular species-level phylogeny of sharks (Selachimorpha, Chondrichthyes). Mol. Phylogenet. Evol. 58, 207–217 (2011). [DOI] [PubMed] [Google Scholar]
- Naylor G. J. P. et al. A DNA sequence–based approach to the identification of shark and ray species and its implications for global elasmobranch diversity and parasitology. Bull. Amer. Mus. Nat. Hist. 367, 1–262 (2012). [Google Scholar]
- Smith W. L. & Wheeler W. C. Venom evolution widespread in fishes: A phylogenetic road map for the bioprospecting of piscine venoms. J. Hered. 97, 206–217 (2006). [DOI] [PubMed] [Google Scholar]
- Eschmeyer W. N. & Fong J. D. Catalog of Fishes: Species by Family/Subfamily. (2016). at http://researcharchive.calacademy.org/research/ichthyology/catalog/SpeciesByFamily.asp, Date of access:01/04/2016.
- Eschmeyer W. N. & Fricke R. Catalog of Fishes: Genera, Species, References. (2016). at http://researcharchive.calacademy.org/research/ichthyology/catalog/fishcatmain.asp, Date of access:01/04/2016.
- Compagno L. FAO Species Catalogue. Vol. 4. Sharks of the world : an annotated and illustrated catalogue of shark species known to date. FAO Fish. Synop. 125, 251–655 (1984). [Google Scholar]
- Crooks N., Babey L., Haddon W. J., Love A. C. & Waring C. P. Sexual dimorphisms in the dermal denticles of the lesser-spotted catshark, Scyliorhinus canicula (Linnaeus, 1758). Plos One 8, e76887 (2013). [DOI] [PMC free article] [PubMed] [Google Scholar]
- Marshall N. J. Communication and camouflage with the same ‘bright’ colours in reef fishes. Philos. Trans. R. Soc. Lond. B. Biol. Sci. 355, 1243–8 (2000). [DOI] [PMC free article] [PubMed] [Google Scholar]
- Franz V. Zur Anatomie, Histology and funktionellen Gestaltung des Selachierauges. Jena Zeitschrift fur Naturwissenschaften 40, 697–840. [Google Scholar]
- Loew E. R. A third, ultraviolet-sensitive, visual pigment in the Tokay gecko (Gekko gekko). Vision Res. 34, 1427–1431 (1994). [DOI] [PubMed] [Google Scholar]
- Govardovskii V. I., Fyhrquist N., Reuter T., Kuzmin D. G. & Donner K. In search of the visual pigment template. Vis. Neurosci. 17, 509–528 (2000). [DOI] [PubMed] [Google Scholar]
- RED Epic Dragon Specifications. (2014). at www.dxomark.com/Reviews/RED-Epic-Dragon-review-First-camera-to-break-the-100-point-DxOMark-sensor-score-barrier/In-Depth-Analysis, Date of access:01/04/2016.
- .Tummers B.. DataThief III. (2006). at http://datathief.org, Date of access:01/04/2016.
- .Wyszecki G. & Stiles W. S. Color science: concepts and methods, quantitative data and formulae. (Wiley, 1982). [Google Scholar]
- Edgar R. C. MUSCLE: multiple sequence alignment with high accuracy and high throughput. Nucleic Acids Res. 32, 1792–7 (2004). [DOI] [PMC free article] [PubMed] [Google Scholar]
- Posada D. jModelTest: phylogenetic model averaging. Mol. Biol. Evol. 25, 1253–6 (2008). [DOI] [PubMed] [Google Scholar]
- Zwickl D. J. Genetic algorithm approaches for the phylogenetic analysis of large biological sequence datasets under the maximum likelihood criterion. (The University of Texas, Austin, 2006). [Google Scholar]
- Dishon G., Dubinsky Z., Fine M. & Iluz D. Underwater light field patterns in subtropical coastal waters: A case study from the Gulf of Eilat (Aqaba). Isr. J. Plant Sci. 60, 265-275 (2013). [Google Scholar]
Associated Data
This section collects any data citations, data availability statements, or supplementary materials included in this article.


