

Abstract
Prior tumor cell studies have shown that the drugs sorafenib (Nexavar) and regorafenib (Stivarga) reduce expression of the chaperone GRP78. Sorafenib/regorafenib and the multi‐kinase inhibitor pazopanib (Votrient) interacted with sildenafil (Viagra) to further rapidly reduce GRP78 levels in eukaryotes and as single agents to reduce Dna K levels in prokaryotes. Similar data were obtained in tumor cells in vitro and in drug‐treated mice for: HSP70, mitochondrial HSP70, HSP60, HSP56, HSP40, HSP10, and cyclophilin A. Prolonged ‘rafenib/sildenafil treatment killed tumor cells and also rapidly decreased the expression of: the drug efflux pumps ABCB1 and ABCG2; and NPC1 and NTCP, receptors for Ebola/Hepatitis A and B viruses, respectively. Pre‐treatment with the ‘Rafenib/sildenafil combination reduced expression of the Coxsackie and Adenovirus receptor in parallel with it also reducing the ability of a serotype 5 Adenovirus or Coxsackie virus B4 to infect and to reproduce. Sorafenib/pazopanib and sildenafil was much more potent than sorafenib/pazopanib as single agents at preventing Adenovirus, Mumps, Chikungunya, Dengue, Rabies, West Nile, Yellow Fever, and Enterovirus 71 infection and reproduction. ‘Rafenib drugs/pazopanib as single agents killed laboratory generated antibiotic resistant E. coli which was associated with reduced Dna K and Rec A expression. Marginally toxic doses of ‘Rafenib drugs/pazopanib restored antibiotic sensitivity in pan‐antibiotic resistant bacteria including multiple strains of bla kpc Klebsiella pneumoniae. Thus, Dna K is an antibiotic target for sorafenib, and inhibition of GRP78/Dna K has therapeutic utility for cancer and for bacterial and viral infections. J. Cell. Physiol. 230: 2552–2578, 2015. © 2015 The Authors. Journal of Cellular Physiology published by Wiley Periodicals, Inc.
Abbreviations
- CAR
Coxsackie and Adenovirus receptor
- CD
cluster of differentiation
- SOR
sorafenib also called Nexavar
- REGO
regorafenib also called Stivarga
- PAZ
pazopanib also called Votrient
- CEL
celecoxib also called Celebrex
- SIL
sildenafil also called Viagra
- TAD
tadalafil also called Cialis
- OSU
OSU‐03012 also called AR‐12
- AMP
ampicillin
- GEN
gentamicin
- MERO
meropenem
- PTEN
phosphatase and tensin homolog
- R
receptor
- dn
dominant negative
- COX
cyclooxygenase
- P
phospho‐
- ca
constitutively active
- WT
wild type
- PERK
PKR like endoplasmic reticulum kinase
- HSP
heat shock protein
- GRP
glucose regulated protein
Sorafenib and regorafenib are multi‐kinase inhibitors approved for the treatment of liver and kidney, and colon cancers, respectively (Carr et al., 2013). Sorafenib was originally developed as an inhibitor of RAF‐1 in the ERK1/2 pathway. The steady state (7 day) Cmax for sorafenib is ∼21 μM in plasma, with ∼99% of the drug protein bound based on in vitro human serum binding assays; though it is known that the drug is also rapidly taken up into tissues (with an approximate threefold greater level of drug in tissues), and in addition patient data from clinical trials would argue that a significant amount of the drug has to be bioavailable, at least in the low micro‐molar range, in a tumor based on its single agent effects by decreasing both ERK1/2 phosphorylation and reducing MCL‐1 protein expression in tumor cells that are not specifically oncogene addicted (Hotte and Hirte, 2002; Elser et al., 2007). Indeed, it has been shown that some sorafenib metabolites such as M2, M4, and M5 can have up to 10‐fold greater activity than the parent drug (Li et al., 2010; Pratz et al., 2010; Inaba et al., 2011). Furthermore, in a very recent manuscript we noted that tumor cells grown in 100% human serum were killed by doses of sorafenib and regorafenib in combination with sildenafil (Viagra) at 25% of their respective C max values (Tavallai et al., 2015). Of note, for the studies in the present manuscript, the amount of bioavailable sorafenib in protein rich solid agar for bacterial growth or protein rich liquid bacterial nutrient broth is unknown. Our prior in vitro and in vivo data in tumor cells have tended to argue using several sorafenib + “drug” combinations that PDGFRβ is a major target of sorafenib for its interactions with other agents e.g., with histone deacetylase inhibitors (Park et al., 2010b,2010a).
A major biological effect of sorafenib is the induction of an endoplasmic stress (ER)/unfolded protein response (UPR), with reduced expression of proteins that have short half‐lives such as MCL‐1 and BCL‐XL (e.g., Rahmani et al., 2007; Martin et al., 2009). Reduced MCL‐1 levels due to sorafenib exposure have been linked in many tumor types to increased levels of apoptosis. Studies by our group have also linked high dose single agent sorafenib exposure to an increase in the levels of autophagic markers including increased numbers of LC3‐GFP vesicles and elevated expression of Beclin1 and ATG5; however, lower sorafenib concentrations only caused a modest transient alteration in autophagy flux (Park et al., 2010b,2010a). Other studies from our groups have shown that based on the sorafenib dose the induction of ER stress may be a “protective” or a “toxic” event in the cellular response to the drug (e.g., Rahmani et al., 2005). It is very probable that the sorafenib‐induced increase in PERK phosphorylation is due to our observation that sorafenib and regorafenib reduce expression of the chaperone GRP78/BiP/HSPA5 (Park et al., 2008; Booth et al., 2012a).
ER stress signaling is mediated by three proximal sensors, PERK, the IRE1 (inositol‐requiring protein 1α)/XBP1 (X‐box binding protein 1) system and ATF6 (activating transcription factor 6 Pavitt and Ron, 2012; Sano and Reed, 2013). GRP78 plays a key role in regulating the ER stress response; under resting conditions the majority of GRP78 is associated with PERK and IRE1 and keeps these proteins in an inactive state (Gorbatyuk and Gorbatyuk, 2013; Rao et al., 2012; Roller and Maddalo, 2013; Ni and Lee, 2007; Quinones et al, 2008). GRP78, as a chaperone, also plays an important role in the protein folding processes that occur in the ER including cancer, liver disease, and virus replication. The prokaryotic homologue of GRP78, Dna K, also plays an essential role in bacterial cell biology where it chaperones proteins such as Rec A which is essential for bacterial DNA replication and resistance where engulfed to the respiratory burst of macrophages (Noguchi et al, 2014; Roux, 1990; Earl et al., 1991; Anderson et al., 1992; Hogue and Nayak, 1992; Xu et al., 1997; Carleton and Brown, 1997; Xu et al., 1998; Bolt, 2001; Bredèche et al., 2001; Shen et al., 2002; Dimcheff et al., 2004; He, 2006; Spurgers et al., 2010; Moreno and Tiffany‐Castiglioni, 2014; Reid et al., 2014). When high levels of unfolded protein are present in the ER, in a tumor cell; in a virally infected cell; or in a rapidly dividing bacterial cell, GRP78 disassociates from PERK and IRE1 resulting in their activation, and GRP78 binds to the unfolded proteins in the ER as a chaperone (Lee, 2007; Luo and Lee, 2013; Chen et al., 2014, and references therein). Activation of PERK‐eIF2α signaling acts to prevent the majority of cellular proteins from being synthesized and IRE1 signaling enhances the expression of additional GRP78 protein. Virus infection can cause a profound ER stress response which could by cyto‐toxic or prevent virus protein synthesis. Hence, some viruses make targeting proteins, similar to mammalian GADD34 and Nck1, that relocate protein phosphatase 1 with eIF2α thereby preventing eIF2α phosphorylation and high levels of toxic ER stress signaling (Rathore et al., 2013; Yu et al, 2011; Zhang et al, 2014). As GRP78 chaperones the unfolded protein(s), free GRP78 eventually becomes available to re‐associate with PERK and IRE1 thereby shutting off the signaling system (Lee, 2007; Luo and Lee, 2013; Chen et al., 2014. Of note, however, is that prolonged ER stress signaling downstream of PERK and IRE1 can facilitate transformed cell killing, though primary cell killing was not observed in our laboratory (see above), arguing that a prolonged reduction of GRP78 in transformed cells reduces cell viability (Booth et al., 2014a,2014b).
GRP78/BiP/HSPA5 and evolutionary conserved homologues of GRP78 play essential roles in the biology and life cycles of viruses, bacteria, protosoal, and yeast cells as well as higher eukaryotic cells, in particular tumor cells that express high levels of many “activated” oncogenic signaling proteins (Roux, 1990; Earl et al., 1991; Anderson et al., 1992; Hogue and Nayak, 1992; Xu et al., 1997; Carleton and Brown, 1997; Xu et al., 1998; Bolt, 2001; Bredèche et al., 2001; Shen et al., 2002; Dimcheff et al., 2004; He, 2006; Spurgers et al., 2010; Moreno and Tiffany‐Castiglioni, 2014; Reid et al., 2014). And, the bacterial GRP78/BiP/HSPA5 homologue, called Dna K, is essential for bacterial growth and for bacterial mRNA/protein stability.
As sorafenib/regorafenib interact with PDE5 inhibitors to reduce GRP78 expression, the present studies determined whether these established cancer chemotherapy drugs could also alter/prevent viral reproduction and bacterial cell growth.
Materials and Methods
Materials
Phospho‐/total‐ antibodies were purchased from Cell Signaling Technologies (Danvers, MA) and Santa Cruz Biotech. (Santa Cruz, CA). All drugs were purchased from Selleckchem (Houston, TX) (Zhu et al, 2004). Of note all studies used the soluble tosylate form of sorafenib. The plasmid to express GRP78/BiP/HSPA5 was kindly provided to the Dent laboratory by Dr. A.S. Lee (University of Southern California, Los Angeles, CA). Other antibody reagents, other kinase inhibitors, cell culture reagents, have been previously described (Booth et al., 2015a,2015b; Booth et al., 2014a, b, c, d; Roberts et al., 2014; Tavallai et al., 2015). All cell lines were purchased and re‐purchased every 6 months from the ATCC and were not further validated in the Dent lab. Previously genetically characterized semi‐established GBM5/GBM6/GBM12/GBM14 glioblastoma cells were supplied by Dr. C.D. James (University of California, San Francisco) and Dr. J.N. Sarkaria (Mayo Clinic, Rochester, MN) and were not further genomically characterized by ourselves (Giannini et al., 2005).
Methods
Mammalian cell culture and in vitro exposure of cells to drugs
All fully established cancer lines were cultured at 37°C (5% (v/v CO2) in vitro using RPMI supplemented with 10% (v/v) fetal calf serum and 10% (v/v) Non‐essential amino acids. All primary human GBM cells were cultured at 37°C (5% (v/v) CO2) in vitro using RPMI supplemented with 2% (v/v) fetal calf serum and 10% (v/v) Non‐essential amino acids at 37°C (5% (v/v CO2). For short‐term cell killing assays, immuno‐fluorescence, and immunoblotting, cells were grown in 96 well plates with each well containing ∼10,000 cells in 200 μl of media and 24 h after plating were treated with various drugs, as indicated. In vitro small molecule inhibitor treatments were from a 100 mM stock solution of each drug and the maximal concentration of Vehicle (DMSO) in media was 0.02% (v/v). Cells were not cultured in growth factor free media during any study. Nota bene: DMSO can have profound inhibitory effects on bacterial cell liquid culture growth and care must be taken, i.e., titration of vehicle concentration, to avoid DMSO vehicle alone anti‐proliferative effects.
Bacterial strains
Escherichia coli bacteria were transformed with plasmids to confer ampicillin and kanamycin resistance and maintained on tryptic soy agar (TSA) plates/in broth supplemented with 2.5 μg/ml penicillin and 2.5 μg/ml kayamycin. Antibiotic resistant clinical isolate bacteria were initially cultured on sheep blood agar or in Figures 27 and 28 on TSA plates. Bacteria were inoculated onto TSA plates and incubated overnight. The following morning, a bacterial colony was picked and placed into 10 ml of TSB with mild shaking at 37°C, and 3 h later, when the bacterial protein level in the media had reached 0.05–0.100, we; (a) inoculated TSA plates with 20 μl of media serially diluting the number of bacteria through repetitive streaking; (b) equal portions of bacteria we aliquoted into 50 ml of fresh media containing the indicated drug and antibiotic combinations. Bacterial total protein levels in 1 ml of homogenious culture media were determined at the indicated time points from time = 0 up to time = 9 h. In parallel, in some studies, the absorbance (A 600 nm) was measured in a spectrophotometer to determine bacteria levels.
Cell treatments, SDS‐PAGE and Western blot/immuno‐fluorescence analysis
Cells were treated with various drug concentrations, as indicated in the Figure legends. Samples were isolated at the indicated times and generic universally established SDS PAGE and immunoblotting was performed as described in refs (Booth et al., 2014a, b, c, d; Roberts et al., 2014). Immunoblots were observed by using an Odyssey IR imaging system with a 5‐log intensity range (LI‐COR Biosciences, Lincoln, NE). For studies performed in 96 well plates to determine changes in protein expression by immuno‐fluorescence, at each indicated time point the culture media was removed and the cells fixed in place by addition of 2% (w/v) paraformaldehyde in PBS. After 60 min at room temperature the cells were washed free of paraformaldehyde and incubated for 30 min with PBS containing 0.02 (v/v) Triton‐X100. (n.b. some studies examining plasma membrane expression of proteins may not undergo the Triton‐X100 permeabilization). Cells were blocked using whole rat serum for 2 h, then PBS washed, and incubated with primary antibody (usually 1:200 dilution) overnight with rocking at 4°C. Cells were washed 3 × 30 min with PBS and then incubated with secondary antibody for 90 min. Cells were washed again 3 × 30 min with PBS. Cells were counter stained with DAPI. For each cell line, or groups of transfected/treated cells being examined at 10× magnification within each experiment, the intensity/brightness/contrast settings were initially established in the Hermes confocal microscope system by examination of control well immuno‐staining, and which then remained fixed for all subsequent studies. Images were taken using the red or green fluorescent channel as per each secondary antibody required, and a separate channel picture taken of DAPI staining. Each red/green fluorescent channel image was arranged with other images from the same experimental set in Microsoft Powerpoint, adjusting the size of the images to be approximately equal. The brightness/contrast of all images were simultaneously altered in Adobe Photoshop CS6 to generate images of the required intensity/contrast for publication. Hence, some presented images may appear “blown out” due to the simultaneous brightening of the images but reflect the true changes in protein expression, as would be observed on a Western blot following SDS denaturation, boiling and electrophoresis, transfer to nitrocellulose, and antibody probing. We believe that our approach in 96 well plates and immuno‐fluorescence on gently fixed cells in situ with minimal manipulation using the Hermes confocal microscope is less likely to produce artefacts, will produce more reliable protein expression data, and in essence permits us to “run” the equivalent of a “96 well immuno‐staining gel.”
Recombinant adenoviral and other virus vectors; infection in vitro
We purchased a previously described serotype 5 recombinant Adenovirus to express green fluorescent protein as per refs (Booth et al., 2015a; Booth et al., 2014a, b, c, d; Roberts et al., 2014). Ad‐GFP was purchased from Research BioLabs (Philadelphia, PA). Other viruses were purchased from ZeptoMetrix Corp. (ZeptoMetrix, Buffalo, NY). Approximate virus titers per ml were: Ad5‐GFP (105); Coxsackie virus B4 #0810075 (106); Chikungunya #311856 (106); Denge fever #308546 (106); Yellow fever #307141 (106), Enterovirus 71 #314024 (106); West Nile Virus #311775 (106); Rabies virus #310710 (106). Cells were infected with serotype 5 Ad.‐GFP Adenovirus/pathogenic viruses at an approximate number of particle formation units as indicated in the Figure/Legend.
Cell death measurements by live/dead assay
Cells were grown in 96 well plates with each well containing ∼10,000 cells in 200 μl of media. Cells were treated with the indicated concentrations of drugs for the indicated amounts of time in each panel. Plates were then centrifuged (500 rpm, 5 min) to re‐adhere floating dead cells to the base of each well, i.e., the equivalent of a cytospin onto a glass slide. The media was removed and live/dead assay reagent added and cells incubated for 10 min before the reagent was removed. Cells were imaged in a Hermes WiScan confocal microscope instrument under 10× magnification with the z plane locked. Green cells = viable; yellow/red cells = dieing / dead. The numbers of viable and dead cells were counted manually from several images taken from one well together with images from another two wells.
Plasmid transfection
Plasmids
Cells were plated in 96 well plates and 24 h after plating, transfected. Plasmids (0.05 μg) expressing a specific mRNA or appropriate vector control plasmid DNA was diluted in 50 μl serum‐free and antibiotic‐free medium (1 portion for each sample). Concurrently, 2 μl Lipofectamine 2000 (Invitrogen), was diluted into 50 μl of serum‐free and antibiotic‐free medium. Diluted DNA was added to the diluted Lipofectamine 2000 for each sample and incubated at room temperature for 30 min. This mixture was added to each well/dish of cells containing 200 μl serum‐free and antibiotic‐free medium for a total volume of 300 μl and the cells were incubated for 4 h at 37°C. An equal volume of 2× medium was then added to each well. Cells were incubated for 36 h, then treated with drugs. To assess transfection efficiency of plasmids we used a plasmid to express GFP and defined the percentage of cells being infected as the percentage of GFP + cells. For all cell lines the infection efficiency was >70%.
siRNA
Cells were plated in 96 well plates from a fresh culture growing in log phase as described above. Prior to transfection, the medium was aspirated and serum‐free medium was added to each well. For transfection, 0.2 nM of the annealed siRNA, the positive sense control doubled stranded siRNA targeting GAPDH or the negative control (a “scrambled” sequence with no significant homology to any known gene sequences from mouse, rat or human cell lines) were used (predominantly Qiagen, Valencia, CA; occasional alternate siRNA molecules were purchased from Ambion, Inc., Austin, TX). At least two different validated siRNA molecules were independently used to confirm the effects observed were not due to non‐specific effects. Hiperfect (Qiagen) was used for transfection. Thirty‐six hours after transfection cells were used for studies as described in the Methods and Figure Legends.
Data analysis
Comparison of the effects between various in vitro drug treatments was performed after two way analysis of variance using the Student's t test. Differences with a P‐value of <0.05 were considered statistically significant. Experiments shown are the means of multiple individual points from multiple studies (±SEM).
Results
Prolonged dosing of athymic mice with [regorafenib + sildenafil] or [sorafenib + sildenafil] or [OSU‐03012 + sildenafil] did not cause any obvious frank damage to normal tissues (Booth et al., 2015a, b; Tavallai et al., 2015). At lower drug concentrations than used for normal tissue toxicity analyses, we have previously shown that mammary, liver, colon, and brain tumor growth is arrested and tumor cells also killed by these drug combinations (data not shown) (Tavallai et al., 2015).
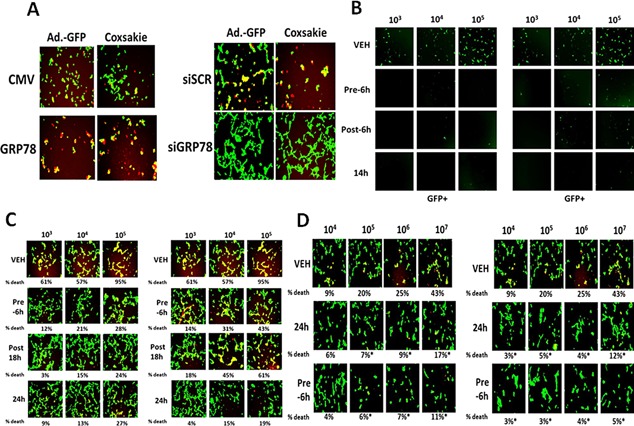
In prior studies, we have shown that various drugs can reduce the expression of GRP78 through protein destabilization/lower half‐life without significantly altering GRP78 promoter activity, and that PDE5 inhibitors further enhance the breakdown of GRP78 (Booth et al., 2014a; Booth et al., 2015a; Tavallai et al., 2015). Sorafenib or regorafenib reduced GRP78 expression in HEK293 cells over time, an effect that was enhanced by sildenafil (Fig. 2A). Treatment of HEK293 cells with these drug combinations also rapidly reduced expression of multiple other chaperone proteins (Fig. 2B). Data similar to that in HEK293 cells were collected in primary human glioblastoma cells (the PTEN deleted GBM14 isolate), and other tumor types (Fig. 1C, data not shown; see also Tavallai et al., 2015). Antibody specificity for detecting GRP78, ABCB1 and ABCG2 by immuno‐fluorescence was confirmed in GBM14 and HEK293 cells (Fig. 1D, not shown).
Figure 2.
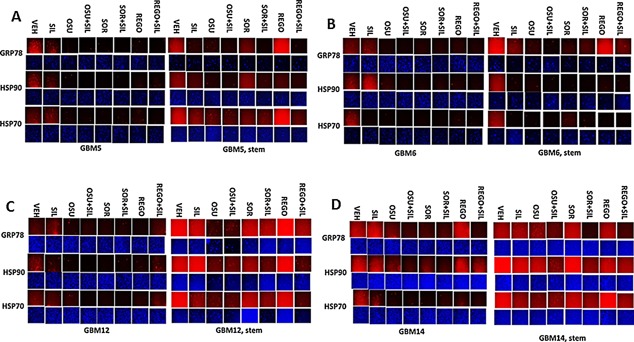
Drug combinations modulate chaperone expression in parental and stem cell like GBM variants. A–D: GBM tumor cells (parental and stem like derived) were treated with vehicle; OSU‐03012 (1 μM); sorafenib (1.5 μM); regorafenib (0.5 μM); sildenafil (2 μM) or the drugs combined for 6 h. Cells were fixed in place and permeabilized with Triton X100. Immuno‐fluorescence at 10× magnification was performed to determine the expression of HSP70, HSP90, and GRP78.
Figure 1.
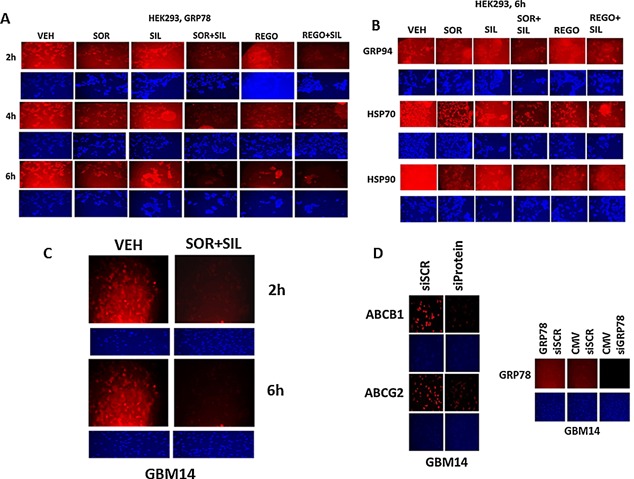
Regulation of chaperone expression and function by [sorafenib + sildenafil] or [regorafenib + sildenafil]. A: HEK293 cells were treated with vehicle; sorafenib (1.5 μM); regorafenib (0.5 μM); sildenafil (2 μM) or the drugs combined for the indicated amounts of time (2–6 h). At each time point cells were fixed in place and permeabilized with Triton X100. Immuno‐fluorescence at 10× magnification was performed to determine the expression of GRP78. B: HEK293 cells were treated with vehicle; sorafenib (1.5 μM); regorafenib (0.5 μM); sildenafil (2 μM) or the drugs combined for 6 h. At each time point cells were fixed in place and permeabilized with Triton X100. Immuno‐fluorescence at 10× magnification was performed to determine the expression of GRP94, HSP70 and HSP90. C: GBM14 glioblastoma cells were treated with vehicle; sorafenib (1.5 μM); sildenafil (2 μM) or the drugs combined for the indicated amounts of time (2–6 h). At each time point cells were fixed in place and permeabilized with Triton X100. Immuno‐fluorescence at 10× magnification was performed to determine the expression of GRP78. D: GBM14 and HEK293 cells were either transfected with a scrambled siRNA (siSCR) or were transfected with siRNA molecules to knock down the expression of GRP78, ABCB1, and ABCG2. In parallel studies, cells were transfected with either empty vector plasmid (CMV) or a plasmid to over‐express GRP78. Twenty‐four hours after transfection cells were fixed in place and permeabilized with Triton X100. Immuno‐fluorescence at 10× magnification was performed to determine the expression of GRP78, ABCB1, and ABCG2.
Tumor stem cells growing unattached in three dimensions are purported to express higher levels of chaperone proteins and drug efflux pumps than tumor cells grown in 2 dimensions. In four primary human glioblastoma cell lines the expression of GRP78, HSP70, and HSP90 was elevated in stem cells compared to parental cells, and in both parental and stem cells: OSU‐03012 and sildenafil; sorafenib and sildenafil; and regorafenib and sildenafil reduced the expression of GRP78, HSP90, and HSP70 (Fig. 2A–D). Similar data were obtained for the drug efflux pumps ABCB1 and ABCG2 (Fig 3A–D). In prior studies in liver and colon cancer cells treatment for only 12 h with combination of [sorafenib + sildenafil] has marginal toxicity, whereas treatment for 24 h caused large amounts of cell death (Tavallai et al., 2015). Treatment of parental and stem cell‐derived GBM5/6/12/14 cells for 12 h with [sorafenib + sildenafil] resulted in much greater levels of tumor cell death in GBM stem cells compared to parental GBM cells (Fig. 4). In addition to the data in Figures 1–3, the drug combinations also reduced expression of the mitochondria regulatory chaperones mtHSP70, HSP60, HSP40 and HSP10, and reduced expression of the iron‐sulphur regulatory protein Frataxin in glioblastoma tumor cells (Fig. 5). In GBM14 cells, changes in the global expression of the prolyl‐disulphide isomerase HSP56 as well as cyclophilin A and cyclophilin B at 10× magnification were also observed (data not shown).
Figure 3.
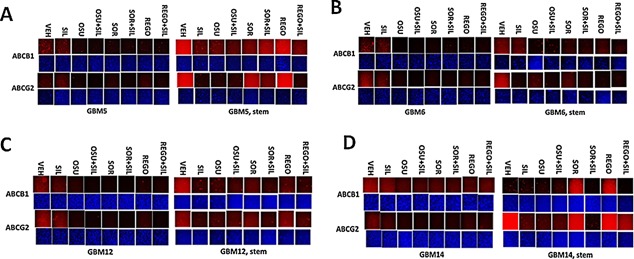
Drug combinations reduce ABCB1 and ABCG2 expression in GBM stem cells. GBM tumor cells (parental and stem like derived) were treated with vehicle; OSU‐03012 (1 μM); sorafenib (1.5 μM); regorafenib (0.5 μM); sildenafil (2 μM) or the drugs combined for 6 h. Cells were fixed in place and permeabilized with Triton X100. Immuno‐fluorescence at 10× magnification was performed to determine the expression of ABCB1 and ABCG2.
Figure 4.
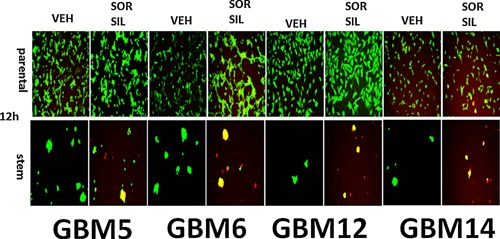
[Sorafenib + sildenafil] kills parental and stem cell‐like GBM cells. Parental and stem cell‐derived variants of GBM5/6/12/14 cells were treated with vehicle; sorafenib (1.5 μM); sildenafil (2 μM) or the drugs combined for 24 h. Cells were then visualized under the FITC and rhodamine filters to determine the numbers of viable (green) and dead (yellow + red) cells (n = 3 ± SEM). Stem cells are 95–100% dead whereas very little killing is observed in parental GBM cells.
Figure 5.
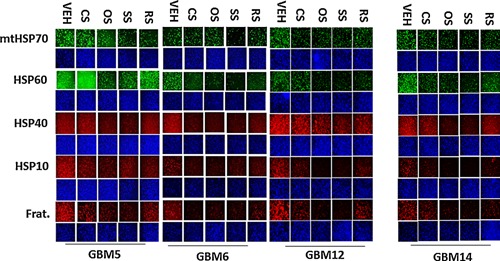
Drug combinations modulate the expression of mitochondrial chaperones and mitochondrial proteins. GBM tumor cells (parental) were treated with vehicle; OSU‐03012 (1 μM); sorafenib (1.5 μM); regorafenib (0.5 μM); sildenafil (2 μM) or the drugs combined for 6 h. Cells were fixed in place and permeabilized with Triton X100. Immuno‐fluorescence at 10× magnification was performed to determine the expression of mitochondrial HSP70 (mtHSP70), HSP60, HSP56, HSP10, Frataxin, CyPA, CyPB.
Based on our semi‐quantitative data using 10× magnification of bulk cell images from 96 well plates, all presented at the same image intensity setting as in Figures 3–5, we returned to the Hermes system and re‐imaged our IF data under 60× magnification to observe the pattern of protein staining in the cells, with image processing in Adobe Photoshop at 9999 dpi and with attempted normalization of image intensities so that altered morphology is not lost due to lower fluorescent signal, using PTEN null GBM14 cells as an exemplar.
In vehicle treated cells GRP78 exhibited a consistent overall background stain with areas of intense punctate staining (Fig. 6A). Treatment of cells with [sorafenib + sildenafil] profoundly reduced GRP78 levels (even with post hoc attempts to normalize image intensities to those in vehicle treated cells) and abolished the appearance of the intense punctate areas (Fig. 6A and B). Similar data were obtained examining intense punctate staining for HSP90 when treated with the drug combinations (Fig. 6C and D). It became obvious from these initial 60× images that the [sorafenib + sildenafil] 6 h drug combination treatment was rapidly altering the overall morphology of cells, with GBM14 cells gaining an appearance more similar in appearance to fibroblasts, with long “neurite‐like” projections. HSP70 had a similar overall consistent staining throughout the cell under all treatment conditions (Fig. 7A and B). In contrast to cytosolic HSP70, mitochondrial HSP70 localization was profoundly altered by drug combination treatments (Fig. 7C and D). Mitochondrial HSP70 staining projected into the long filaments after drug combination exposure. Near identical observations were also made for HSP60 (Fig. 8A and B). HSP40 appeared to be expressed in all parts of the cell, with punctate intense staining, an effect that was lost after drug combination treatment (Fig. 8C and D). In contrast, for HSP10, the protein appeared to be expressed in all parts of the cell, with some punctate staing that became more intense compared to background staining after drug combination exposure (Fig. 9A and B).
Figure 6.
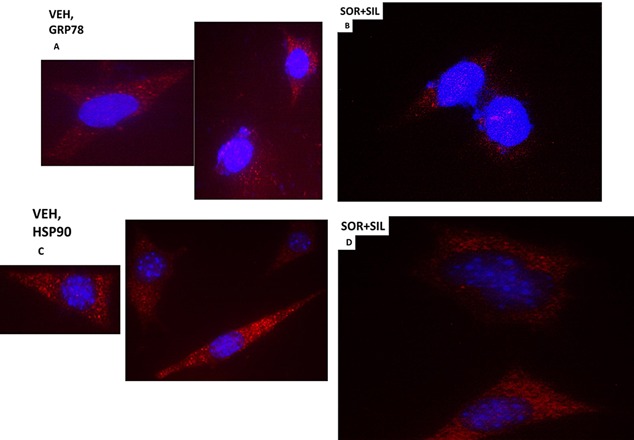
The cellular distribution of GRP78 and HSP90. A: GBM14 tumor cells (parental) were treated with vehicle for 6 h. Cells were fixed in place and permeabilized with Triton X100. Immuno‐fluorescence was performed to determine the distribution of GRP78 determined at 60X. B: GBM tumor cells (parental) were treated with vehicle; sorafenib (1.5 μM); sildenafil (2 μM) or the drugs combined for 6 h. Cells were fixed in place and permeabilized with Triton X100. Immuno‐fluorescence was performed to determine the distribution of GRP78 determined at 60×. C: GBM14 tumor cells (parental) were treated with vehicle for 6 h. Cells were fixed in place and permeabilized with Triton X100. Immuno‐fluorescence was performed to determine the distribution of HSP90 determined at 60×. D: GBM tumor cells (parental) were treated with vehicle; sorafenib (1.5 μM); sildenafil (2 μM) or the drugs combined for 6 h. Cells were fixed in place and permeabilized with Triton X100. Immuno‐fluorescence was performed to determine the distribution of HSP90 determined at 60×.
Figure 7.
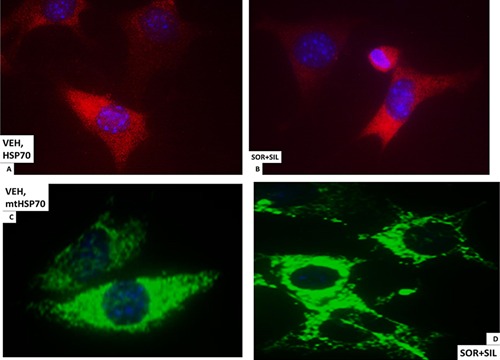
The cellular distribution of HSP70 and mitochondrial HSP70. A: GBM14 tumor cells (parental) were treated with vehicle for 6 h. Cells were fixed in place and permeabilized with Triton X100. Immuno‐fluorescence was performed to determine the distribution of HSP70 determined at 60×. B: GBM14 tumor cells (parental) were treated with vehicle; sorafenib (1.5 μM); sildenafil (2 μM) or the drugs combined for 6 h. Cells were fixed in place and permeabilized with Triton X100. Immuno‐fluorescence was performed to determine the distribution of HSP70 determined at 60×. C: GBM14 tumor cells (parental) were treated with vehicle for 6 h. Cells were fixed in place and permeabilized with Triton X100. Immuno‐fluorescence was performed to determine the distribution of mitochondrial HSP70 determined at 60×. D: GBM tumor cells (parental) were treated with vehicle; sorafenib (1.5 μM); sildenafil (2 μM) or the drugs combined for 6 h. Cells were fixed in place and permeabilized with Triton X100. Immuno‐fluorescence was performed to determine the distribution of mitochondrial HSP70 determined at 60×.
Figure 8.
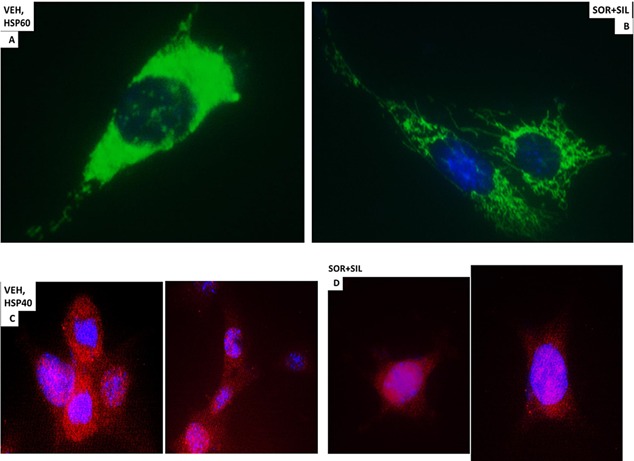
The cellular distribution of HSP60 and HSP40. A: GBM14 tumor cells (parental) were treated with vehicle for 6 h. Cells were fixed in place and permeabilized with Triton X100. Immuno‐fluorescence was performed to determine the distribution of HSP60 determined at 60×. B: GBM tumor cells (parental) were treated with vehicle; sorafenib (1.5 μM); sildenafil (2 μM) or the drugs combined for 6 h. Cells were fixed in place and permeabilized with Triton X100. Immuno‐fluorescence was performed to determine the distribution of HSP60 determined at 60×. C: GBM14 tumor cells (parental) were treated with vehicle for 6 h. Cells were fixed in place and permeabilized with Triton X100. Immuno‐fluorescence was performed to determine the distribution of HSP40 determined at 60×. D: GBM tumor cells (parental) were treated with vehicle; sorafenib (1.5 μM); sildenafil (2 μM) or the drugs combined for 6 h. Cells were fixed in place and permeabilized with Triton X100. Immuno‐fluorescence was performed to determine the distribution of HSP40 determined at 60×.
Figure 9.
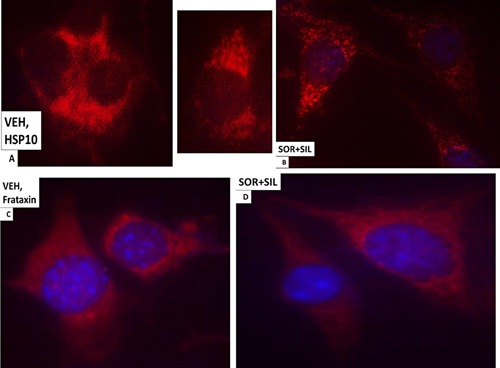
The cellular distribution of HSP10 and Frataxin. A: GBM14 tumor cells (parental) were treated with vehicle for 6 h. Cells were fixed in place and permeabilized with Triton X100. Immuno‐fluorescence was performed to determine the distribution of HSP10 determined at 60×. B: GBM tumor cells (parental) were treated with vehicle; sorafenib (1.5 μM); sildenafil (2 μM) or the drugs combined for 6 h. Cells were fixed in place and permeabilized with Triton X100. Immuno‐fluorescence was performed to determine the distribution of HSP10 determined at 60×. C: GBM14 tumor cells (parental) were treated with vehicle for 6 h. Cells were fixed in place and permeabilized with Triton X100. Immuno‐fluorescence was performed to determine the distribution of Frataxin determined at 60×. D: GBM tumor cells (parental) were treated with vehicle; sorafenib (1.5 μM); sildenafil (2 μM) or the drugs combined for 6 h. Cells were fixed in place and permeabilized with Triton X100. Immuno‐fluorescence was performed to determine the distribution of Frataxin determined at 60×.
Based on the morphology and staining changes observed in Figures 6–9, we next examined the expression and localization of the mitochondrial iron‐sulphur protein Frataxin. Frataxin expression did not appear to be punctate under basal conditions, as we would have expected for this iron‐sulphur regulatory protein based on the literature, and although frataxin did exhibit expression in the drug‐induced filament projections, the morphology/expression of the protein was not similar to that observed for mtHSP70 or HSP60 (Fig. 9C and D). In parallel with these changes in chaperone function, we also observed altered localization of the drug efflux pumps ABCB1 and ABCG2 after drug treatment (Fig. 10A–D). HSP56 is also an isomerase enzyme, essential for the activation of JAK1 and JAK2, and although total HSP56 expression was reduced after drug treatment, the localization of the protein judged at 60× magnification did not change (Fig. 11A and B). Staining data similar to that for HSP56 were also obtained probing for expression and localization of another protein whose functionality can regulate JAK1 and JAK2 function, cyclophilin A (Fig. 11C and D, upper red stained images). It has been reported that cyclophilin B is localized in the endoplasmic reticulum and in control cells the staing for cyclophilin B had a rippled “mackerel” ‐like appearance with particulate areas of intense staining. In drug treated cells the staining for cyclophilin B became more uniform and the intensity of the particulate areas of staining reduced.
Figure 10.
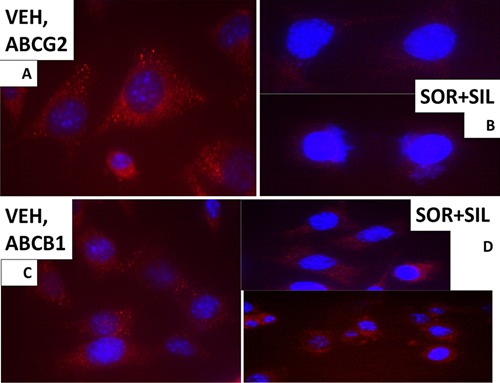
The cellular distribution of ABCB1 and ABCG2. A: GBM14 tumor cells (parental) were treated with vehicle for 6 h. Cells were fixed in place and permeabilized with Triton X100. Immuno‐fluorescence was performed to determine the distribution of ABCB1 determined at 60×. B: GBM tumor cells (parental) were treated with vehicle; sorafenib (1.5 μM); sildenafil (2 μM) or the drugs combined for 6 h. Cells were fixed in place and permeabilized with Triton X100. Immuno‐fluorescence was performed to determine the distribution of ABCB1 determined at 60×. C: GBM14 tumor cells (parental) were treated with vehicle for 6 h. Cells were fixed in place and permeabilized with Triton X100. Immuno‐fluorescence was performed to determine the distribution of ABCG2 determined at 60×. D: GBM tumor cells (parental) were treated with vehicle; sorafenib (1.5 μM); sildenafil (2 μM) or the drugs combined for 6 h. Cells were fixed in place and permeabilized with Triton X100. Immuno‐fluorescence was performed to determine the distribution of ABCG2 determined at 60×.
Figure 11.
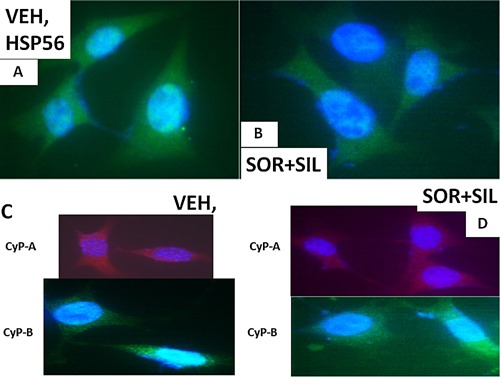
The cellular distribution of HSP56 and CyP‐A and CyP‐B. A: GBM14 tumor cells (parental) were treated with vehicle for 6 h. Cells were fixed in place and permeabilized with Triton X100. Immuno‐fluorescence was performed to determine the distribution of HSP56 determined at 60×. B: GBM tumor cells (parental) were treated with vehicle; sorafenib (1.5 μM); sildenafil (2 μM) or the drugs combined for 6 h. Cells were fixed in place and permeabilized with Triton X100. Immuno‐fluorescence was performed to determine the distribution of HSP56 determined at 60×. C: GBM14 tumor cells (parental) were treated with vehicle for 6 h. Cells were fixed in place and permeabilized with Triton X100. Immuno‐fluorescence was performed to determine the distribution of CyP‐A and CyP‐B determined at 60×. D: GBM tumor cells (parental) were treated with vehicle; sorafenib (1.5 μM); sildenafil (2 μM) or the drugs combined for 6 h. Cells were fixed in place and permeabilized with Triton X100. Immuno‐fluorescence was performed to determine the distribution of CyP‐A and CyP‐B determined at 60×.
In vivo, treatment of mice with sorafenib + sildenafil; and regorafenib + sildenafil reduced expression of multiple chaperone proteins and also reduced expression of the plasma membrane and blood‐brain‐barrier transporters ABCG2 and ABCB1 (Fig. 12A–D) (Black et al, 2008). Over‐expression of GRP78 was in a cell type dependent fashion able to prevent regorafenib + sildenafil treatment reducing ABCB1 and ABCG2 expression (data not shown; Tavallai et al., 2015). Based on prior studies we also determined whether [pazopanib + sildenafil] treatment reduced GRP78 and chaperone levels and those of ABCB1 and ABCG2. As observed for [OSU‐03012 + sildenafil] and [sorafenib + sildenafil], the [pazopanib + sildenafil] drug combination was also effective at reducing chaperone and pump levels (Fig. 13A–C).
Figure 12.
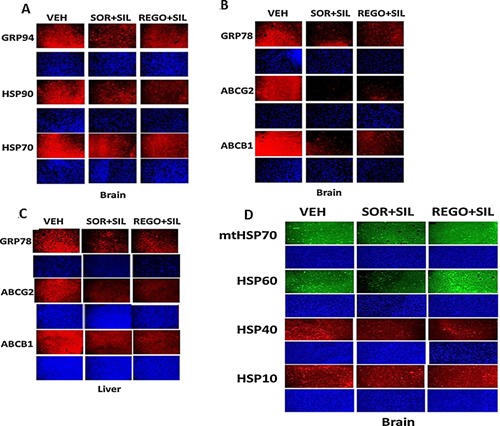
Sildenafil combined with sorafenib/regorafenib reduced expression of chaperones as well as ABCB1 and ABCG2 in vivo. A–D: Athymic mice were treated PO with vehicle diluent (cremophore) or sildenafil (5 mg/kg) and regorafenib (15 mg/kg) or sildenafil (5 mg/kg) and sorafenib (25 mg/kg), for 5 days after which animals were sacrificed, their brains and livers obtained and fixed and sealed in paraffin wax. Sections (10 μm) were taken and subjected to immuno‐histochemistry at 10× magnification using manufacturer validated antibodies to determine the expression of GRP78, GRP94, HSP70, HSP90, mtHSP70, HSP60, HSP40, HSP10, ABCB1, and ABCG2.
Figure 13.
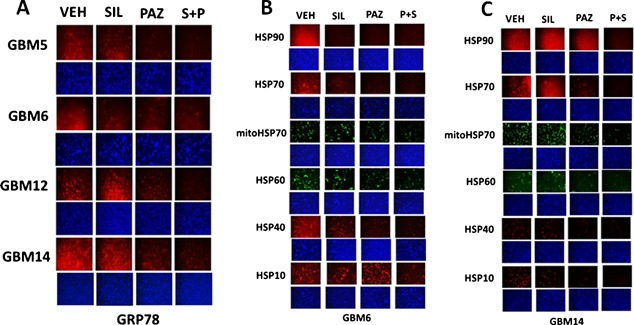
Pazopanib + sildenafil reduces GRP78 and other chaperone levels in GBM cells. A: GBM tumor cells (parental) were treated with vehicle; pazopanib (1 μM); sildenafil (2 μM) or the drugs combined for 6 h. Cells were fixed in place and permeabilized with Triton X100. Immuno‐fluorescence at 10× magnification was performed to determine the expression of GRP78. B and C: GBM tumor cells were treated with vehicle; pazopanib (1 μM); sildenafil (2 μM) or the drugs combined for 6 h. Cells were fixed in place and permeabilized with Triton X100. Immuno‐fluorescence at 10× magnification was performed to determine the expression of HSP70, mitochondrial HSP70, HSP90, HSP60, HSP40, and HSP10.
Prior studies have shown that treatment of cells with [sorafenib + sildenafil] or [OSU‐03012 + sildenafil] reduced expression of various plasma membrane virus and growth factor receptors (Booth et al., 2015a; Tavallai et al., 2015). Treatment of primary mouse hepatocytes with regorafenib did not significantly alter the expression of the Coxsackie and Adenovirus receptor (CAR) or Na+ taurocholate cotransporting polypeptide (NTCP) (Fig. 14A). However, combination exposure to [regorafenib + sildenafil] significantly reduced both CAR and NTCP levels. In HEK293 cells, sildenafil enhanced the ability of sorafenib/regorafenib to reduce CAR expression in a time dependent fashion (Fig. 14B). Over‐expression of GRP78 did not seem to significantly alter basal levels of CAR expression (Fig. 14C). Similar data were obtained for CAR and for the Ebola virus receptor NPC1 in primary human GBM cells (Fig. 15A–D). As was observed in prior studies using the chemical OSU‐03012, over‐expression of GRP78 was able to maintain virus receptor expression after [sorafenib + sildenafil] treatment (data not shown). In the brains and livers of drug treated animals both sorafenib/regorafenib and sildenafil treatment, reduced the levels of CAR and NTCP, as they also did for the Ebola/Marburg/Hepatitis A/C receptors (Fig. 16A and B). This is of particular note as a recent study demonstrated that sorafenib inhibits multiple steps of the Hepatitis C virus infectious cycle (Descamps et al., 2015).
Figure 14.
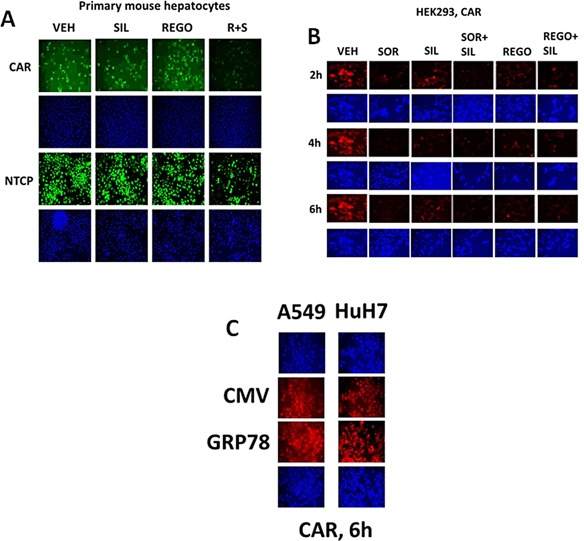
Regulation of virus receptor expression in vitro by sildenafil combined with sorafenib or regorafenib. A: Primary mouse hepatocytes were treated with vehicle; regorafenib (0.5 μM); sildenafil (2 μM) or the drugs in combination for 6 h. Cells were fixed in place and permeabilized with Triton X100. Immuno‐fluorescence at 10× magnification was performed to determine the expression of the Coxsackie and Adenovirus receptor (CAR) or the Hepatitis B virus receptor Na+‐taurocholate cotransporting polypeptide (NTCP). B: HEK293 cells were treated with vehicle; sorafenib (1.5 μM); regorafenib (0.5 μM); sildenafil (2 μM) or the drugs combined for 6 h. At each time point cells were fixed in place and permeabilized with Triton X100. Immuno‐fluorescence at 10× magnification was performed to determine the expression of CAR. C: A549, HuH7 cells were transfected with empty vector plasmid or a plasmid to express GRP78. Twenty‐four hours later cells were were fixed in place and permeabilized with Triton X100. Immuno‐fluorescence at 10× magnification was performed to determine the expression of CAR.
Figure 15.
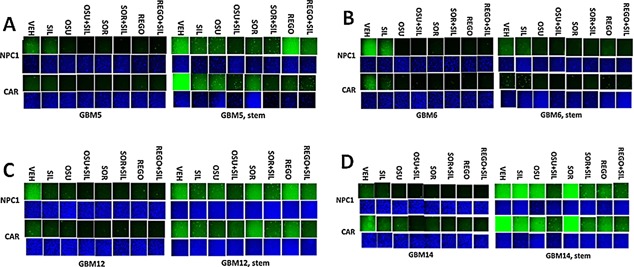
Drug combinations reduce the expression of virus receptors in GBM stem cells in vitro. A–D: GBM tumor cells (parental and stem like derived) were treated with vehicle; OSU‐03012 (1 μM); sorafenib (1.5 μM); regorafenib (0.5 μM); sildenafil (2 μM) or the drugs combined for 6 h. Cells were fixed in place and permeabilized with Triton X100. Immuno‐fluorescence at 10× magnification was performed to determine the expression of CAR and NPC1.
Figure 16.
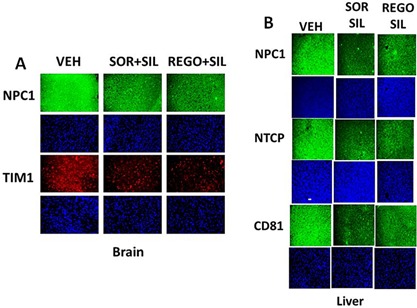
Drug combinations reduce the expression of virus receptors in animals. A and B: Athymic mice were treated PO with vehicle diluent (cremophore) or sildenafil (5 mg/kg) and regorafenib (15 mg/kg) or sildenafil (5 mg/kg) and sorafenib (25 mg/kg), for 5 days after which animals were sacrificed, their brains and livers obtained and fixed and sealed in paraffin wax. Sections (10 μm) were taken and subjected to immuno‐histochemistry at 10× magnification to determine the expression of: CAR; NTCP; and the Ebola/Hepatitis A/C virus receptor proteins CD81, NPC1, and TIM1.
Prior studies have shown that treatment of cells with the celecoxib derivative chemical OSU‐03012 combined with sildenafil reduced the ability of viruses to infect cells and to replicate in cells (Booth et al., 2015a). Over‐expression of GRP78 enhanced Adenovirus and Coxsackie virus ‐induced cell lysis whereas knock down of GRP78 expression suppressed virus lethality (Fig. 17A). Thus as GRP78 over‐expression did not alter CAR levels but did increase virus lethality we tentatively conclude that the pro‐viral effects of GRP78 over‐expression are intracellular, at least for a serotype 5 Adenovirus. This is in general agreement with a large number of studies identifying GRP78 as an essential facilitator of virus reproduction (Roux, 1990; Earl et al., 1991; Anderson et al., 1992; Hogue and Nayak, 1992; Xu et al., 1997; Carleton and Brown, 1997; Xu et al., 1998; Bolt, 2001; Bredeche et al., 2001; Shen et al., 2002; Dimcheff et al., 2004; He, 2006; Spurgers et al., 2010; Moreno and Tiffany‐Castiglioni, 2014; Reid et al., 2014).
Figure 17.
Regulation of viral gene expression and virus infectivity in vitro by sildenafil combined with sorafenib or regorafenib. A. Left parts: HEK293 cells were transfected with empty vector plasmid or a plasmid to express GRP78. After 24 h cells were infected with Ad5.GFP or Coxsackie virus B4. The percentage cell death was determined by live/dead assay determined after 18 h where green cells = alive and red/yellow cells = dead. Right parts: HEK293 cells were transfected with a scrambled siRNA (siSCR) or an siRNA to knock down GRP78 expression (siGRP78). Twenty‐four hours after transfection cells are infected with increasing amounts of Ad5.GFP or Coxsackie virus B4. The percentage cell death was determined by live/dead assay determined after 18 h where green cells = alive and red/yellow cells = dead. B: HEK293 cells were infected with increasing numbers of Ad.GFP virus particles (103–105) with sorafenib (0.75 μM) and sildenafil (2 μM) (LEFT block of 12 panels), regorafenib (0.3 μM) and sildenafil (2 μM) (RIGHT block of 12 panels). Cells were either: pre‐treated for 6 h only prior to viral infection; post‐treated after viral infection; or treated prior to infection and after infection for a total of 14 h. Cells were visualized under the FITC filter to determine the numbers of GFP+ cells. C: HEK293 cells were infected with increasing numbers of Ad.GFP virus particles (103–105) with sorafenib (0.75 μM) and sildenafil (2 μM) (LEFT block of 12 panels), regorafenib (0.3 μM) and sildenafil (2 μM) (RIGHT block of 12 panels). Cells were either: pre‐treated for 6 h only prior to viral infection; post‐treated after viral infection; or treated prior to infection and after infection for a total of 24 h. Cells were visualized under the FITC and rhodamine filters to determine the numbers of viable (green) and dead (yellow + red) cells. D: HEK293 cells were infected with increasing numbers of Coxsackie virus B4 particles (104–107) with sorafenib (0.75 μM) and sildenafil (2 μM) (LEFT block of 12 panels), regorafenib (0.3 μM) and sildenafil (2 μM) (RIGHT block of 12 panels). Cells were either: pre‐treated for 6 h only prior to viral infection or treated prior to infection and after infection for a total of 24 h. Cells were visualized under the FITC and rhodamine filters to determine the numbers of viable (green) and dead (yellow + red) cells.
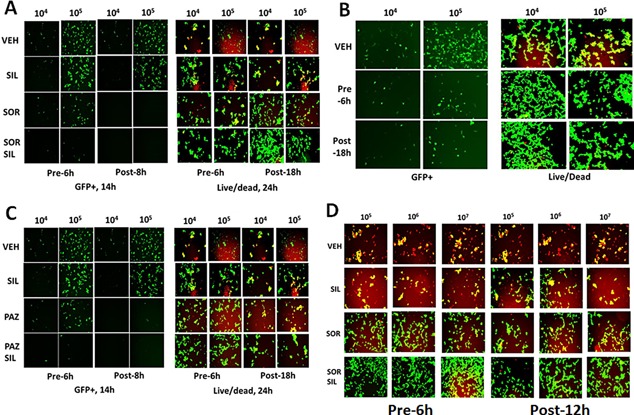
Using a serotype 5 recombinant Adenovirus to express green fluorescent protein (GFP) we then assessed the abilities of the well described FDA approved drugs sorafenib and sildenafil and of regorafenib and sildenafil to alter Adenovirus infectivity and Adenovirus reproduction. Pre‐treatment of HEK293 cells with the drug combinations considerably reduced Adenovirus infectivity with sorafenib or with regorafenib as judged by production of GFP in infected cells (Fig. 17B). Treatment of cells after viral infection with the drug combinations also reduced the production of GFP; pre‐ and post‐ infection treatment of cells abolished GFP production. HEK293 cells are permissive for Adenovirus replication which results in cell lysis. In vehicle control treated cells Adenovirus infection caused large amounts of cell death within 24 h (Fig. 17C). Pre‐treatment of HEK293 cells with the drug combinations considerably reduced Adenovirus infectivity with sorafenib or with regorafenib. Identical findings to that with the double stranded DNA serotype 5 Adenovirus were also observed for the RNA virus, Coxsackie virus B4, thought to be the virus responsible for triggering type I diabetes in children (Fig. 17D).
Similar data to that with sorafenib or regorafenib were obtained using [OSU‐03012 + sildenafil] in Adenovirus or Mumps virus infected cells (Fig. 18A and B). Of particular note, for the drug concentration of OSU‐03012 used (1.0 μM) and the times of incubation, OSU‐03012 as a single agent was not as effective at preventing virus infection and viral cell killing as OSU‐03012 combined with sildenafil to prevent virus infection/killing. Similar data to that obtained with Adenovirus and Coxsackie virus were also found with Chikungunya virus (Fig. 19A). We also determined that [sorafenib + sildenafil] treatment, to a much greater extent than sorafenib treatment alone which was most often only modestly effective as a single agent, inhibited virus reproduction when examining Yellow Fever virus, Denge Fever virus, Enterovirus 71, West Nile virus and Rabies virus (Figs. 19 and 20). Of striking note, however, and to our considerable surprise, was that sorafenib or pazopanib as single agents were both able to profoundly suppress both the infection of cells and viral‐mediated cell lysis caused by West Nile virus.
Figure 18.
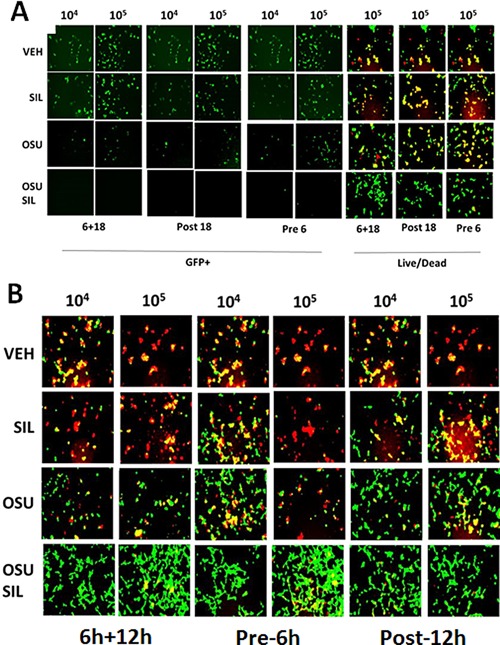
Drug combinations with Viagra are more potent at preventing viral gene expression and viral reproduction than use of single kinase inhibitory drugs. A: HEK293 cells were infected with increasing numbers of Ad.GFP virus particles (104, 105) with the indicated amounts of OSU‐03012 (0.75 μM) and/or sildenafil (2.0 μM). Cells were either: pre‐treated for 6 h only prior to viral infection; post‐treated after viral infection; or treated prior to infection and after infection for a total of 14 or 18 h, as indicated. In Part A. Left images: cells were visualized under the FITC filter to determine the numbers of GFP+ cells. In Part A. Right images: cells were visualized under the FITC and rhodamine filters to determine the numbers of viable (green) and dead (yellow + red) cells. B: VERO E6 cells were infected with increasing numbers of Mumps virus particles (104, 105) with the indicated amounts of OSU‐03012 (0.75 μM) and/or sildenafil (2.0 μM). Cells were either: pre‐ and post‐treated with drugs for 48 h total; pre‐treated for 6 h only prior to viral infection or treated prior to infection and after infection for a total 18 h. Cells were visualized under the FITC and rhodamine filters to determine the numbers of viable (green) and dead (yellow + red) cells.
Figure 19.
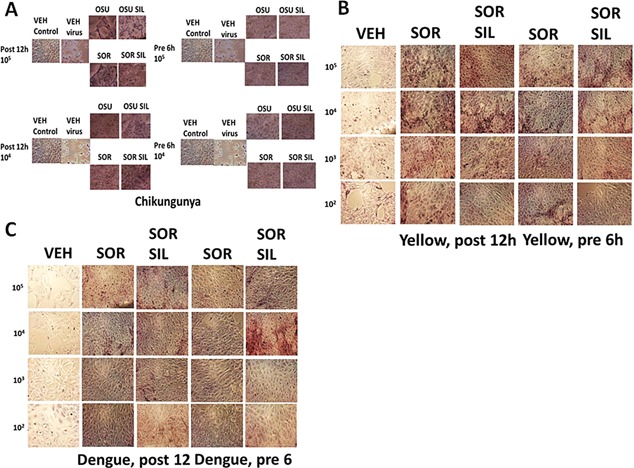
A: Treatment of cells before infection with Chikungunya virus with drug combinations prevents virus replication. VERO cells were pre‐treated with OSU‐03012 (2 μM) and/or sildenafil (2 μM); sorafenib (1 μM) and/or sildenafil (2 μM), as indicated. Drugs were removed and cells infected with increasing numbers of Chikungunya virus particles (104–105). Cells were fixed in situ and H&E stained 48 h after infection. B: Treatment of cells with drug combinations after infection with Yellow Fever virus prevents virus replication. VERO cells were infected with increasing numbers of Yellow Fever virus particles (102–105) followed by treatment with sorafenib (1 μM) and/or sildenafil (2 μM), as indicated either for 12 h after infection or for 6 h before infection. Fixed and H&E stained cells were assessed for their morphology 96 h after infection. C: Treatment of cells with drug combinations after infection with Dengue viruses prevents virus replication. VERO cells were infected with increasing numbers of Dengue virus particles (102–105) followed by treatment with sorafenib (1 μM) and/or sildenafil (2 μM), as indicated either for 12 h after infection or for 6 h before infection. Fixed and H&E stained cells were assessed for their morphology 96 h after infection.
Figure 20.
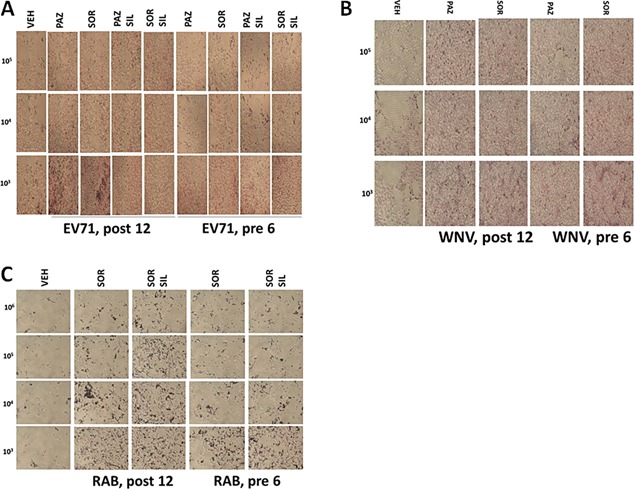
A: Treatment of cells with drug combinations after infection with Enterovirus 71 prevents virus replication. VERO cells were infected with increasing numbers of Enterovirus 71 particles (103–105) followed by treatment with sorafenib (1 μM) and/or sildenafil (2 μM), as indicated either for 12 h after infection or for 6 h before infection. Fixed and H&E stained cells were assessed for their morphology 96 h after infection. B: Treatment of cells with drug combinations after infection with West Nile virus prevents virus replication. VERO cells were infected with increasing numbers of West Nile virus particles (103–105) followed by treatment with sorafenib (1 μM) and/or sildenafil (2 μM), as indicated either for 12 h after infection or for 6 h before infection. Fixed and H&E stained cells were assessed for their morphology 72 h after infection. C: Treatment of cells with drug combinations after infection with Rabies virus prevents virus replication. BHK‐21 cells were infected with increasing numbers of Rabies virus particles (102–105) followed by treatment with sorafenib (1 μM) and/or sildenafil (2 μM), as indicated either for 12 h after infection or for 6 h before infection. Fixed and H&E stained cells were assessed for their morphology 72 h after infection.
Sorafenib as a single agent reduced serotype 5 Adenovirus infectivity and lethality that was enhanced by sildenafil (Fig. 21A). Celecoxib and sildenafil treatment, in a similar manner to sorafenib and sildenafil, suppressed the ability of a serotype 5 Adenovirus to increase expression of GFP protein in infected cells, though using only 104 particles (Fig. 21B, left parts). This correlated with cell viability data (Fig. 21B, right parts). Of note for those interested in clinical translation of these studies, it was obvious that celecoxib at 10 μM was less effective at suppressing virus biology than much lower concentrations of either OSU‐03012, sorafenib or regorafenib. We also noted that [pazopanib + sildenafil] treatment was able to inhibit serotype 5 Adenovirus reproduction (Fig. 21C). Sorafenib as a single agent, but to a much greater extent when combined with sildenafil, prevented Mumps virus replication (Fig. 21D).
Figure 21.
Multi‐kinase inhibitors as anti‐viral agents. A: HEK293 cells were infected with increasing numbers of Ad.GFP virus particles (104, 105) with the indicated amounts of sorafenib (0.75 μM) and/or sildenafil (2.0 μM). Cells were either: pre‐treated for 6 h only prior to viral infection; post‐treated after viral infection; or treated prior to infection and after infection for a total of 14 or 18 h, as indicated. In Part A. Left images: cells were visualized under the FITC filter to determine the numbers of GFP+ cells. In Part A. Right images: cells were visualized under the FITC and rhodamine filters to determine the numbers of viable (green) and dead (yellow + red) cells. B: HEK293 cells were infected with increasing numbers of Ad.GFP virus particles (104, 105) with celecoxib (10 μM) and sildenafil (2 μM). Cells were either: pre‐treated for 6 h only prior to viral infection; post‐treated after viral infection; or treated prior to infection and after infection for a total of 14 or 18 h, as indicated. Left images: cells were visualized under the FITC filter to determine the numbers of GFP+ cells. Right images: cells were visualized under the FITC and rhodamine filters to determine the numbers of viable (green) and dead (yellow + red) cells. C: HEK293 cells were infected with increasing numbers of Ad.GFP virus particles (104, 105) with the indicated amounts of pazopanib (1.0 μM) and/or sildenafil (2.0 μM). Cells were either: pre‐treated for 6 h only prior to viral infection; post‐treated after viral infection; or treated prior to infection and after infection for a total of 14 or 18 h, as indicated. In Part A. Left images: cells were visualized under the FITC filter to determine the numbers of GFP+ cells. In Part A. Right images: cells were visualized under the FITC and rhodamine filters to determine the numbers of viable (green) and dead (yellow + red) cells. D: VERO cells were infected with increasing numbers of Mumps virus particles (104, 105) with the indicated amounts of sorafenib (0.75 μM) and/or sildenafil (2.0 μM). Cells were either: pre‐ and post‐treated with drugs for 48 h total; pre‐treated for 6 h only prior to viral infection or treated prior to infection and after infection for a total 18 h. Cells were visualized under the FITC and rhodamine filters to determine the numbers of viable (green) and dead (yellow + red) cells.
Serotype 5 Adenoviruses are double stranded DNA viruses whereas the genetic material of Coxsackie B viruses is a single strand of positive sense RNA. Both viruses use CAR to infect cells. Unlike our data with a serotype 5 Adenovirus where sorafenib was more potent than regorafenib at preventing virus infection, data using Coxsackie virus B4 suggested a non‐significant trend where regorafenib was more effective at suppressing virus‐mediated cell lysis than sorafenib. The differences in the impact of sorafenib/regorafenib on Adenovirus/Coxsackie virus replication, presumably due to slight variations in their drug specificities and especially to the different molecular mechanisms of DNA and RNA virus replication are studies beyond the scope of the present manuscript.
Bacteria express a closely related homologue of the mammalian protein GRP78/BiP/HSPA5, in bacteria known as Dna K, and we recently demonstrated that [OSU‐03012 + sildenafil] treatment reduced Dna K levels in E. coli and in Neisseria gonorrheae (Booth et al., 2015a; Goodwin et al, 2011; Johnson et al, 2005; Kulp et al, 2004). Treatment of laboratory generated ampicillin and kanamycin resistant E. coli bacteria with regorafenib or with sorafenib significantly reduced bacterial protein accumulation and overall bacterial proliferation, and significantly enhanced the collective antibiotic properties of ampicillin and kanamycin (Fig. 22A–C) (Cui et al, 2005). As celecoxib can inactivate the chaperone properties of GRP78 in mammalian cells we investigated whether celecoxib also had antibiotic properties. In a dose‐dependent fashion celecoxib reduced bacterial protein accumulation and strongly enhanced the antibiotic properties of ampicillin and kanamycin (Fig. 22D). Of particular note, there was no significant observed additional anti‐bacterial interaction when we combined sorafenib and celecoxib to treat E. coli suggesting that these drugs target/utilize a very similar molecular mechanism to prevent bacterial cell growth (data not shown). The multi‐kinase inhibitor pazopanib also exhibited significant anti‐bacterial properties that were at least as great, if not greater mole for mole, than sorafenib (data not shown).
Figure 22.
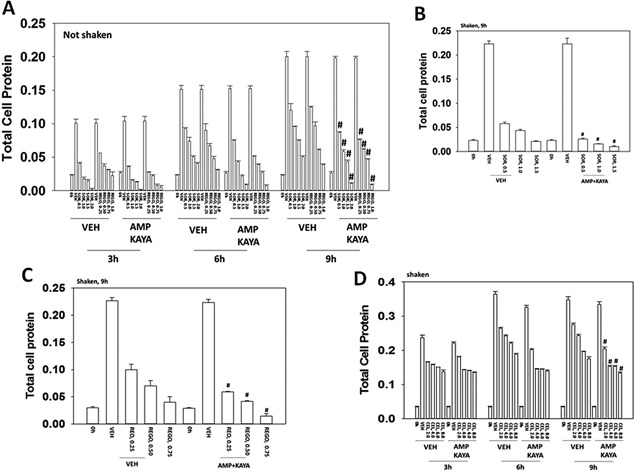
Sorafenib and regorafenib suppress bacterial cell growth and reverse antibiotic resistance. A: Escherichia coli bacteria transformed with plasmids to be ampicillin and kanamycin resistant were grown without shaking in 50 ml of media with or without ampicillin (1.0 μg/ml) and kanamycin (1.0 μg/ml). Bacteria were treated with sorafenib (0.5–2.0 μM) or with regorafenib (0.25–1.0 μM) for up to 9 h and at each indicated time point 1 ml of media was removed and the bacteria isolated after centrifugation. The total amount of protein in the bacterial cell pellet was determined at each time point by Bradford assay (n = 3 ± SEM). B and C: Escherichia coli bacteria transformed to be ampicillin and kanamycin resistant were grown with rotary shaking in 50 ml of media with or without ampicillin and kanamycin. Bacteria were treated with sorafenib (0.5–2.0 μM) or with regorafenib (0.25–1.0 μM) for 9 h and 1 ml of media was removed and the bacteria isolated after centrifugation. The total amount of protein in the bacterial cell pellet was determined at after 9 h by Bradford assay (n = 3 ± SEM). D: Escherichia coli bacteria transformed to be ampicillin and kanamycin resistant were grown with rotary shaking in 50 ml of media with or without ampicillin and kanamycin. Bacteria were treated with celecoxib (2.0–8.0 μM) for up to 9 h and at each indicated time point 1 ml of media was removed and the bacteria isolated after centrifugation. The total amount of protein in the bacterial cell pellet was determined at each time point by Bradford assay (n = 3 ± SEM).
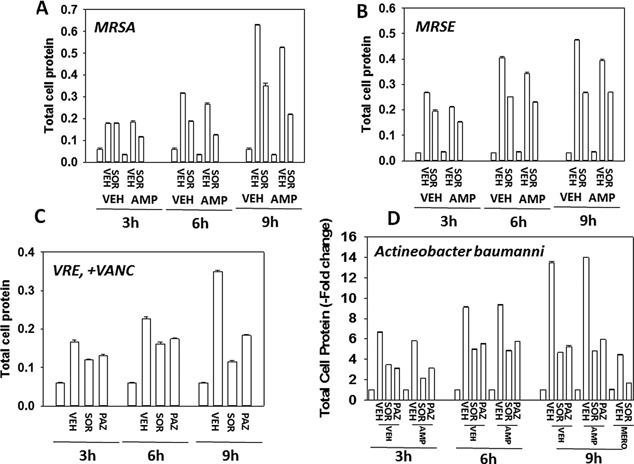
Sorafenib also exhibited antibiotic growth‐suppressing properties in: Salmonella typhimurium and Streptococcus pyogenes with NO activity against Vibrio cholerae (Fig. 23) (Chiu et al, 2009b). Higher concentrations of OSU‐03012 than used for other bacteria studies were required to suppress Vibrio cholerae growth. We discovered that sorafenib could down‐regulate expression of the bacterial GRP78‐like chaperone Dna K, which was similar to our prior data using OSU‐03012 (Fig. 23D). The decline in Dna K expression correlated with reduced expression of a Dna K chaperoned protein, Rec A. In the case of the chaperone Dna J (HSP40), treatment with sorafenib also lowered its expression. Of greater significance in multi‐drug antibiotic resistant forms of VRE; MRSA, MRSE, and antibiotic resistant Acinetobacter baumannii, sorafenib exhibited growth suppressive antibiotic properties as a single agent at low clinically relevant concentrations and in all except MRSE reverted antibiotic resistance to ampicillin, meropenem or vancomycin (Fig. 24). The bacterial growth suppressive effect of sorafenib on MRSE is of interest because in a very small subset of cancer patients sorafenib can cause a facial acneiform eruption, that could be Staphylococcus epidermis ‐related (Cohen, 2015).
Figure 23.
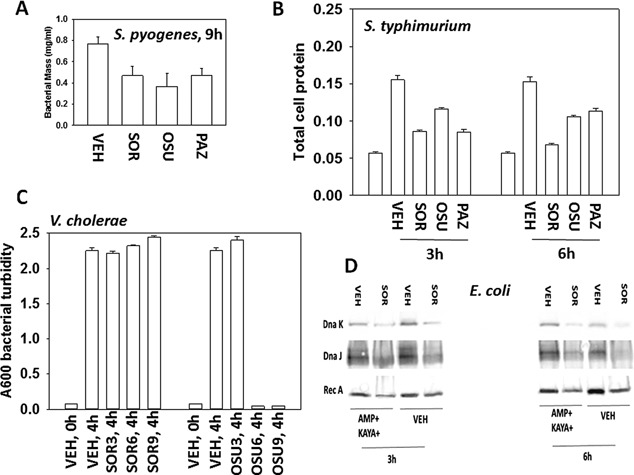
Antibiotic properties of OSU‐03012, sorafenib and of pazopanib. A: Streptococcus pyogenes bacteria were treated with OSU‐03012 (2.0 μM) or sorafenib (1.5 μM) or pazopanib (1.5 μM) for 9 h after which total bacterial biomass in 1 ml of media was determined using a 6 place electronic balance (n = 3 ± SEM). B: Salmonella typhimurium bacteria were treated with sorafenib (0.75 μM); OSU‐03012 (1.0 μM); pazopanib (1.5 μM) for 3 and 6 h and at each time point 1 ml of media was removed and the bacteria isolated after centrifugation. The total amount of protein in the bacterial cell pellet was determined by Bradford assay (n = 3 ± SEM). C: Vibrio cholerae bacteria were treated with sorafenib (0–9 μM); OSU‐03012 (0–9 μM); for 4 h. The optical density of the cell culture media was determined A600 nm (n = 3 ± SEM). D: Escherichia coli bacteria transformed to be ampicillin and kayamycin resistant were grown with rotary shaking in 50 ml of media with or without ampicillin (1.0 μg/ml) and kayamycin (1.0 μg/ml). At each indicated time point 1 ml of media was removed and the bacteria isolated after centrifugation. The total amount of protein in the bacterial cell pellet was determined and equal amounts of protein from each condition subjected to SDS PAGE. Immunoblotting was performed to determine the expression of Rec A, Dna K, and Dna J.
Figure 24.
Sorafenib kills bacteria and re‐sensitizes bacteria to standard of care antibiotics. A–D: MRSE, MRSA, VRE, and Acinetobacter baumannii bacteria were treated with sorafenib (1.0 μM) or pazopanib (1.0 μM) as indicated in the presence or absence of ampicillin (2.0 μg/ml); meropenem (2.0 μg/ml) or vancomycin (2.0 μg/ml) and in the indicated combinations for 0–9 h and 1 ml of media was removed and the bacteria isolated after centrifugation. The total amount of protein in the bacterial cell pellet was determined by Bradford assay (n = 3 ± SEM).
Generic laboratory strain Klebsiella pneumoniae is inherently resistant to ampicillin, and we additionally obtained multiple strains of this bacterial species from the VCU‐MCVH bacterial pathology laboratory and determined the impact of sorafenib with or without antibiotic exposure on their growth. Sorafenib, OSU‐03012 or pazopanib significantly reduced the growth of “generic” laboratory strain Klebsiella pneumoniae (Fig. 25A). In carbapenem‐resistant Klebsiella pneumoniae strain #1 over‐expressing very high levels of the resistance enzyme bla kpc, bacterial growth was significantly inhibited by either sorafenib or pazopanib; and sorafenib significantly enhanced the antibiotic properties of ampicillin but for unknown reasons surprisingly not of meropenem (Fig. 25B and C). Sorafenib enhanced the antibiotic properties of ampicillin and also of gentamicin in multiple other resistant bla kpc Klebsiella pneumoniae strains, though a further enhancing antibiotic effect of combining both established antibiotics with sorafenib was only observed in isolate #4 (Fig. 26A–C).
Figure 25.
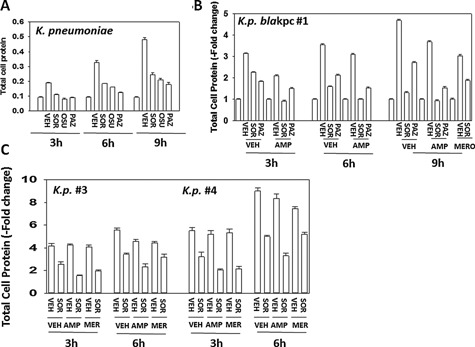
Sorafenib suppresses the growth of clinical isolate Klebsiella pneumoniae “blakpc superbug” bacteria and re‐sensitizes bacteria to ampicillin. Klebsiella pneumoniae strains were treated with OSU‐03012, sorafenib or pazopanib (Part A, laboratory generic variant, 0.75 μM each; Parts B and C, Klebsiella pneumoniae antibiotic resistant strains #1, #3, #4 (sorafenib, 2.0 μM each) in the presence or absence of 2.0 μg/ml ampicillin or 4.0 μg/ml meropenem and in the indicated combinations for 0‐9h and 1 ml of media was removed and the bacteria isolated after centrifugation. The total amount of protein in the bacterial cell pellet was determined by Bradford assay (n = 3 ± SEM).
Figure 26.
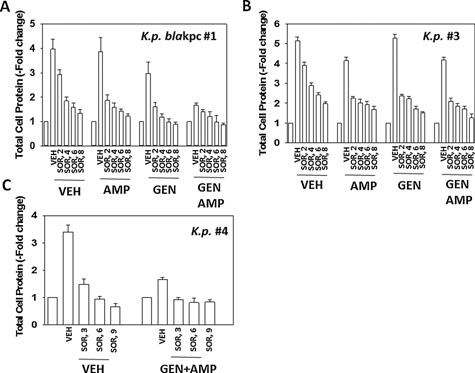
Sorafenib suppresses the growth of clinical isolate Klebsiella pneumoniae “superbug” bacteria and re‐sensitizes bacteria to gentamicin. A–C: Klebsiella pneumoniae strains were treated with sorafenib (2.0–8.0 μM) in the presence or absence of 2.0 μg/ml ampicillin and/or 2.0 μg/ml gentamicin alone or combined, and in the indicated combinations for 6 h and 1 ml of media was removed and the bacteria isolated after centrifugation. The total amount of protein in the bacterial cell pellet was determined by Bradford assay (n = 3 ± SEM).
Finally, we determined the impact of sorafenib and ampicillin on bacterial colony formation in vitro, i.e., does the sorafenib drug suppress bacterial growth on a solid substrate? Log‐phase Klebsiella pneumoniae bacteria were streaked onto plates whose agar substrate contained vehicle, ampicillin and / or sorafenib. The C max of sorafenib in plasma is 21 μM, where 99% of the drug is protein bound, though a recent study from this laboratory demonstrated that 5 μM sorafenib was active as a therapeutic in tumor cells grown in 100% human serum (Tavallai et al., 2015). The amount of bio‐available sorafenib in the present studies is unknown. Twenty‐four hours after streaking and incubation at 37°C, photographs of the agar dishes revealed that sorafenib (intra‐agar) concentrations of as low as 5 μM significantly suppressed bacterial colony formation (Figs. 27 and 28). The anti‐bacterial effect of 10 μM sorafenib in strain #1 was not substantially greater than that of 5 μM drug. In strains #3 and #4 a very modest to no effect was observed on bacterial growth above sorafenib treatment alone, when sorafenib was combined with ampicillin; this is a different outcome to our studies in liquid culture. However, in the most resistant of all of the K.p. bacteria, strain #1, we observed at concentrations as low as 5 μM that sorafenib clearly did enhance the antibiotic properties of ampicillin; note the presence of individual colonies in the initial inoculation streaks of the bacteria which in control treated plates could not be visualized as individual colonies.
Figure 27.
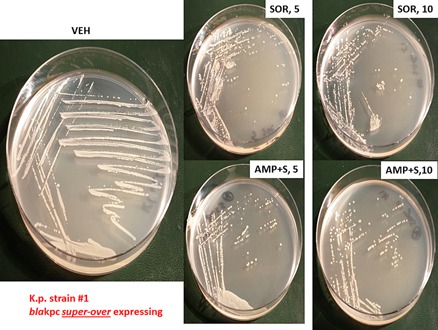
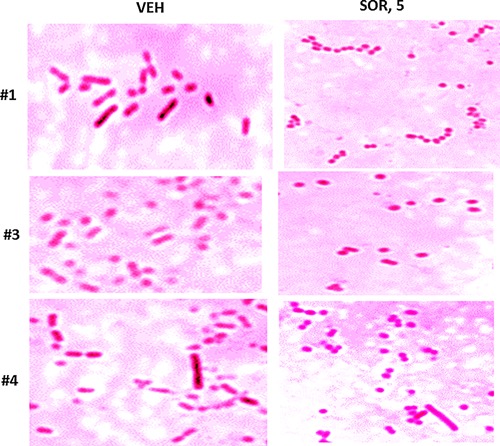
Sorafenib alone suppresses colony formation and sensitizes Klebsiella pneumoniae “superbug” bacteria strain #1 to ampicillin. Strain #1 bacteria that super‐over –express the resistance protein bla kpc were grown for 3 h in liquid media which is when the bacteria have entered log‐phase growth. Equal mounts of media (∼20 μl) containing bacteria were streaked onto nutrient broth agar plates in the standard format with sequential streaking so that each set of streaking results in dilution of the number of bacterial colony forming units. Each plate contained vehicle control agar; agar containing sorafenib (5 μM, 10 μM) and/or ampicillin (2 μg/ml; 6 μM). Bacterial were grown at 37°C in a humified atmosphere for 24 h. Bacteria in situ were then imaged using a Motorolla 10 mega‐pixel ‘phone camera.
Figure 28.
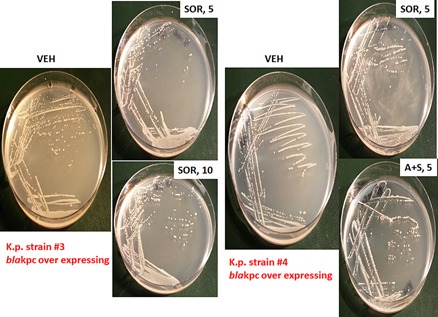
Sorafenib suppresses colony formation in Klebsiella pneumoniae “superbug” bacteria strains #3 and #4. Strain #3 and Strain #4 bacteria were grown for 3 h in liquid media which is when the bacteria have entered log‐phase growth. Equal mounts of media (∼20 μl) containing bacteria were streaked onto nutrient broth agar plates in the standard format so that each set of streaking results in dilution of the number of bacterial colony forming units. Each plate contained vehicle control agar; agar containing sorafenib (5 μM) and/or ampicillin (2 μg/ml; 6 μM). Bacterial were grown at 37°C in a humified atmosphere for 24 h. Bacteria in situ were then imaged using a Motorolla ‘phone camera.
Antibiotics can have multiple effects on the morphology of bacteria, in particular as we previously observed for the Dna K inhibitory chemical OSU‐03012, on coliform morphology where rod shaped bacteria either became coccoid in appearance or alternatively bacteria became ∼4× longer and had ∼2× more width (Booth et al., 2015a). Bacteria from colonies in Figures 27 and 28 were smeared onto glass slides, fixed and Gram stained. Klebsiella pneumoniae bacteria of all three strains under control conditions displayed a short fat rod shaped appearance with the length of the rod being approximately twice the width (Fig. 29). Growth of all Klebsiella strains in the presence of 5 μM sorafenib resulted in bacteria which appeared coccoid in shape, even going so far as to form long chains of cells, reminiscent of Rouleux chains of clotting red blood cells. A very few bacteria, in strain #4, appeared to remain in large rod‐like structures after sorafenib exposure but that were less intensly stained that in vehicle control treated bacteria. Collectively, these data imply that sorafenib, possibly by altering Dna K function, is altering the biology of the Klebsiella pneumoniae cell membrane.
Figure 29.
Sorafenib alters the morphology of Klebsiella pneumoniae bacteria from surviving bacterial colonies grown on sorafenib agar. Strains #1; #3; #4, after imaging (Figs. 27 and 28) were smeared onto glass slides, heat fixed and subjected to Gram staining. Stained cells were imaged at 100× under oil immersion using a Ziess microscope and black and white camera, and post hoc highlighting color added artificially to each image using AdobePhotoshop CS6.
Discussion
The present studies were initiated to determine the role of the ER chaperone protein GRP78/BiP/HSPA5 in regulating cell viability when cells are exposed to sorafenib/regorafenib/pazopanib alone, or when combined with phosphodiesterase 5 (PDE5) inhibitors and/or standard of care antibiotics. We discovered that sildenafil and other PDE5 inhibitors enhanced the ability of sorafenib/regorafenib to suppress GRP78 expression in vitro and in vivo. This was associated with decreased expression of multiple virus receptors, as well as growth factor receptors, effects that were for some of these receptors, blocked in vitro by GRP78 over‐expression. Similarly, and in agreement with our prior data, sorafenib/regorafenib/pazopanib and sildenafil prevented viral replication. As pazopanib is not a RAF‐1 inhibitor, nor is OSU‐03012, it is unlikely that inhibition of RAF‐1 is a primary mode of sorafenib/regorafenib interaction with sildenafil to reduce GRP78/virus receptor expression in our present studies. Furthermore, in the present studies we noted that the parent chemical of OSU‐03012, the FDA approved anti‐inflamatory drug celecoxib, also was capable of reducing viral reproduction and enhancing the bacteriocidal properties of standard of care antibiotics. However, celecoxib and sorafenib did not interact to further promote any additional decline in bacterial cell growth, arguing that these agents in bacteria were acting to suppress bacterial viability/growth through inhibition of the same target protein, i.e., putatively Dna K.
Sorafenib and regorafenib destabilize the GRP78 protein, and also as per our prior OSU‐03012 findings, sorafenib/regorafenib when combined with sildenafil/tadalafil also rapidly further enhanced the decline in total GRP78 levels (Booth et al., 2012a; Booth et al., 2015a; Tavallai et al., 2015). Treatment of Adenovirus/Coxsackie virus virally infected cells with sorafenib/regorafenib and sildenafil decreased the release of active virus particles as judged by decreased cell lysis/cell death caused by virus reproduction. However, whereas sorafenib and regorafenib had equal potency at preventing RNA‐Coxsackie virus reproduction we noted that sorafenib appeared to have a greater ability to suppress replication of the DNA‐Adenovirus when compared to regorafenib. Unlike Adenovirus, the replication of Coxsackie virus genomic RNA occurs very rapidly and it possible that this process is exquisitely sensitive to both sorafenib and to regorafenib compared to the slower nuclear DNA replication process for adenovirus (Sean and Semler, 2008). Studies to fully understand these differences between the two viruses will require additional studies by experienced virologists. A vast number of human viruses rely on GRP78/BiP/HSPA5 expression and on expression of other chaperones such as HSP90 and HSP70, for their life cycle, e.g., Ebola and Influenza, and for the further induction of GRP78 to facilitate production of functional native conformation viral proteins and, obviously, formation of new virus particles. Hence collectively our data strongly argue that the combination of sorafenib/regorafenib and sildenafil or with other longer half‐life PDE5 inhibitors, e.g., tadalafil, could potentially be developed into a potent anti‐viral therapy for many viral diseases.
In our recent cancer and infectious disease studies we stated that agents which disrupt GRP78/Dna K function, specifically the non‐approved chemical OSU‐03012, would have a universal impact on cancer cell viability, virus reproduction and bacterial viability because of the central importance of GRP78/Dna K in the initial folding of poly‐peptides into their correct tertiary conformation and the chaperoning effect of GRP78 on native/denatured extant proteins in general. In eukaryotic cells the addition of a drug that raises cyclic GMP levels, e.g., a PDE5 inhibitor, enhances the degradation of destabilized GRP78 and that, furthermore, enhances the degrative impact of the non‐approved chemical OSU‐03012 on multiple chaperones that maintain tumor cell viability and viral replication. The present studies extend and confirm our original hypothesis to include the well‐described FDA approved drugs sorafenib, regorafenib, pazopanib and to a much lesser extent celecoxib. In mice we previously demonstrated that the combination of these drugs with a PDE5 inhibitor did not result in any obvious frank normal tissue toxicity, animal weight loss or behavioral change but did cause reduced expression in vivo of multiple chaperone proteins, including GRP78; HSP70 and HSP90, and reduced expression of the chemotherapy/blood‐brain‐barrier pump proteins ABCB1 and ABCG2.
Our prior studies for over a decade have demonstrated that the celecoxib derivative chemical OSU‐03012 also killed tumor cells through mechanisms which involved enhanced endoplasmic reticulum (ER) stress signaling through activation of PERK, down‐regulation/reduced half‐life of the endoplasmic reticulum and plasma membrane localized HSP70 family chaperone GRP78/BiP/HSPA5, and a caspase‐independent, cathepsin‐dependent and autophagy‐dependent form of tumor cell death (Yacoub et al., 2006; Park et al., 2008; Booth et al., 2012a, b). More recently we have shown that the non‐approved chemical OSU‐03012 alone or in combination with PDE5 inhibitors can kill GBM stem cells, prevent virus reproduction and kill multi‐drug resistant bacteria (Booth et al., 2015a).
Very recently, a resident from Emory University in collaboration with Dr. C.F. Spiropoulou and other investigators at the Viral Special Pathogens Branch at the Centers for Disease Control and Prevention, at the St. Jude's Pediatric Infectious Disease conference in February 2015, presented evidence that “kinase inhibitors” had in vitro ability to suppress the reproduction of Lassa virus, Alkhurma hemorrhagic fever virus, Ebola GFP reporter virus, Marburg GFP reporter virus and Nipah luciferase reporter virus (http://www.pids.org/meetings-and-events/st-judepids-conference/program-at-a-glance.html), which confirmed and extended our own prior findings with OSU‐03012 on reducing Ebola and Lassa virus receptor expression and also that OSU‐03012 prevented the reproduction of a wide diverse variety of other pathogenic human viruses such as Influenza, Mumps, Measles, and Rubella (Booth et al., 2015a). It is of note that in our hands a profound reduction in Adenovirus–delivered GFP expression in HEK293 cells 14 h after infection caused by either the chemical OSU‐03012 or the drugs sorafenib/pazopanib as single agents resulted in a much less impressive reduction in viral‐mediated cell lysis after 24 h, suggesting that measuring anti‐viral drug effects using a GFP/luciferase reporter assay system may have the potential to overlook long‐term negative sequellae on virally infected cell viability. These findings also emphasize that it is the combination of GRP78 function modulator with a PDE5 inhibitor which is required to reproducibly control virus reproduction in multiple virus types.
The Emory/CDC investigators used a commercially available 163 compound panel of “kinase inhibitors” to perform their in vitro anti‐virus tests. Whether sorafenib or the more soluble bioactive sorafenib tosylate was included in the screening panel is unknown, and as we have shown, it is unlikely that sorafenib as a single agent would exhibit strong anti‐viral properties. These investigators were also possibly not cognascent with the literature concerning the decade‐long development of the chemical OSU‐03012 as a cancer therapeutic by ourselves and other groups. OSU‐03012 was classified as a “kinase inhibitor,” as the compound was originally believed to act through direct inhibition of the kinase PDK‐1 within the PI3K pathway. The Selleckchem website states that OSU‐03012 has an IC50 for inhibiting the kinase PDK‐1 as being 5 μM (http://www.selleckchem.com/products/OSU-03012.html). However, as noted in much earlier studies such as Yacoub et al. (2006), Park et al. (2008), Booth et al. (2012a), plus the works of several other laboratories (Zhang et al., 2007; Gao et al., 2008; Wang et al., 2008; Chiu et al., 2009; Bai et al., 2010), it rapidly became apparent that the primary mode of OSU‐03012‐induced tumor cell killing is through a form of endoplasmic reticulum stress signaling and increased levels of toxic autophagy, which were due in part to OSU‐03012 destabilizing the GRP78/BiP/HSPA5 protein and likely inactivating other chaperones, e.g., HSP90, HSP70, all concomitant with prolonged toxic PERK activation. Over‐expression of activated AKT alone was only weakly protective against OSU‐03012, even in GBM cells expressing a mutant active PI3K or deleted for PTEN expression. It is also of note that in several manuscripts the impact of OSU‐03012 on tumor cell viability has been linked to altered JAK1/2–STAT3 signaling, and as OSU‐03012 has the potential to reduce HSP56 and cyclophilin A expression, such findings are consistent (Booth and Dent, unpublished observations).
The probable reason why the original team from Ohio State University believed that their new compound OSU‐03012 functioned to kill cells as a direct PDK‐1 inhibitor was that in vitro the drug at >2 μM begins to reduce AKT (T308) phosphorylation in cells in parallel with tumor cell killing, however as the laboratory of Dr. Amy Lee recently demonstrated in several elegant studies, down‐regulation of cell surface GRP78 results in reduced activity within the PI3K pathway (Liu et al., 2013; Lin et al., 2015; Tsai et al., 2015). In our hands at concentrations of 2 μM, OSU‐03012 causes the very rapid down‐regulation of cell surface GRP78 expression which could easily explain the original conclusions as to why the drug was a direct PDK‐1 inhibitor causing reduced AKT phosphorylation (see data in Yacoub et al., 2006; Park et al., 2008; Booth et al., 2015a, b). Our initial studies with OSU‐03012 in PI3K mutant active GBM5 cells demonstrated that OSU‐03012 killed as a single agent and caused radiosensitization in the 0.5–1.0 μM range, before any reduction in AKT phosphorylation was evident (Yacoub et al., 2006). As the chemical OSU‐03012 also stimulates autophagy through GRP78 down‐regulation, and as autophagy can cause the breakdown of ingested viral proteins, the OSU‐03012‐induced autophagy response in cells may also play a role in reducing overall viral replication capacity, i.e., intracellular viral clearance through autophagic degradation. As neither Virginia Commonwealth University nor the Commonwealth of Virginia have BSL‐4 research capabilities, required for hemoragic virus studies, we are at present unable to test whether [sorafenib + sildenafil] or [pazopanib + sildenafil] treatments can prevent the infection of cells by hemoragic fever viruses or hemoragic fever virus reproduction.
The increasing resistance of bacteria to antibiotics, particularly beta‐lactam antibiotics, is of considerable public health concern. For example, bacteria such as MRSE and MRSA are characterized by their resistance to methicillin/penicillin and also to multiple synthetic versions of this drug. Other bacteria, such as VRE, Acinetobacter baumannii and Klebsiella pneumoniae have become resistant to almost all approved antibiotics. Our present studies demonstrated that sorafenib suppressed the growth of multiple pan‐antibiotic resistant bacteria in a dose‐dependent fashion and caused these bacteria to become sensitive again to formerly standard of care antibiotic drugs. Based on our data in multiple bla kpc antibiotic resistant Klebsiella pneumoniae strains, we suggest that sorafenib, in combination with ampicillin and gentamicin, be explored as a therapy for human Klebsiella pneumoniae infections. As sorafenib, unlike the chemical OSU‐03012, is a well‐characterized FDA approved drug with a known toxicity profile, and at 400 mg BID is generally well tolerated particularly when combined with 200 mg BID of Celebrex thus with minimal hand‐foot reaction for ∼7–14 days, our data argue that for hospitalized patients with other pan‐antibiotic resistant bacteria, a combination of this cancer therapeutic drug with an anti‐inflammatory drug and a mixture of prior standard of care efficacious antibiotics may be a useful novel therapeutic approach.
In conclusion, we have targeted the chaperone GRP78/Dna K in eukaryotic and prokaryotic cells by use of the drugs pazopanib, sorafenib, and regorafenib. In eukaryotic cells loss of GRP78 suppresses virus infection and replication. In prokaryotes the drugs inhibit Dna K which results in significantly reduced bacterial growth and a resensitization of antibiotic resistant bacteria to their former standard of care antibiotics. It will be interesting in the coming years whether the owners of these drugs, Bayer and Novartis, decide to exploit these unexpected properties of their approved anti‐cancer drugs for infectious disease applications.
Acknowledgments
Support for the present study was funded by philanthropic monies supplied by Massey Cancer Center (to PD) and by Public Health Service R01 DK52825 (for studies into sorafenib biology) and R01CA141703 (for studies into OSU‐03012 biology). The authors thank the VCU / MCVH Pathology laboratory staff Connie Bender for supplying the initial Actineobacter and Klebsiella bacteria strains growing on agar plates. PD is the holder of the Universal Inc. Chair in Signal Transduction Research. The authors have no conflicts of interest to report; studies performed at ZeptoMetrix were fully collaborative but were also paid for under a materials transfer agreement and contracts. Thanks to Mrs. Grizzard for her support to the Dent lab and to Dr. H. F. Young (Neurosurgery, VCU) and the Betts family fund for support in the purchase of the Hermes Wiscan confocal microscope instrument. Thank you for a lifetime of loving support, Mr. Alan Denholm. A provisional patent has been filed by Virginia Commonwealth University on the technologies discovered in this manuscript. Any monies resulting from this work will be donated to The Royal National Lifeboat Institution in The United Kingdom.
Literature Cited
- Anderson K, Stott EJ, Wertz GW. 1992. Intracellular processing of the human respiratory syncytial virus fusion glycoprotein: amino acid substitutions affecting folding, transport and cleavage. J Gen Virol 73:1177–1188. [DOI] [PubMed] [Google Scholar]
- Bai LY, Weng JR, Tsai CH, Sargeant A, Lin CW, Chiu CF. 2010. OSU‐03012 sensitizes TIB‐196 myeloma cells to imatinib mesylate via AMP‐activated protein kinase and STAT3 pathways. Leuk Res 2010:816–820. [DOI] [PubMed] [Google Scholar]
- Black KL, Yin D, Ong JM, Hu J, Konda BM, Wang X, Ko MK, Bayan JA, Sacapano MR, Espinoza A, Irvin DK, Shu Y. 2008. PDE5 inhibitors enhance tumor permeability and efficacy of chemotherapy in a rat brain tumor model. Brain Res 1230:290–302. [DOI] [PMC free article] [PubMed] [Google Scholar]
- Bolt G. 2001. The measles virus (MV) glycoproteins interact with cellular chaperones in the endoplasmic reticulum and MV infection upregulates chaperone expression. Arch Virol 146:2055–2068. [DOI] [PubMed] [Google Scholar]
- Booth L, Cazanave SC, Hamed HA, Yacoub A, Ogretmen B, Chen CS, Grant S, Dent P. 2012a. OSU‐03012 suppresses GRP78/BiP expression that causes PERK‐dependent increases in tumor cell killing. Cancer Biol Ther 13:224–236. [DOI] [PMC free article] [PubMed] [Google Scholar]
- Booth L, Cruickshanks N, Ridder T, Chen CS, Grant S, Dent P. 2012b. OSU‐03012 interacts with lapatinib to kill brain cancer cells. Cancer Biol Ther 13:1501–1511. [DOI] [PMC free article] [PubMed] [Google Scholar]
- Booth L, Roberts JL, Cruickshanks N, Grant S, Poklepovic A, Dent P. 2014a. Regulation of OSU‐03012 Toxicity by ER Stress Proteins and ER Stress‐Inducing Drugs. Mol Cancer Ther 13:2384–2398. [DOI] [PMC free article] [PubMed] [Google Scholar]
- Booth L, Roberts JL, Cruickshanks N, Tavallai S, Webb T, Samuel P, Conley A, Binion B, Young HF, Poklepovic A, Spiegel S, Dent P. 2014b. PDE5 inhibitors enhance Celecoxib killing in multiple tumor types. J Cell Physiol DOI: 10.1002/jcp.24843. [Epub ahead of print] [DOI] [PMC free article] [PubMed] [Google Scholar]
- Booth L, Roberts JL, Cruickshanks N, Conley A, Durrant DE, Das A, Fisher PB, Kukreja RC, Grant S, Poklepovic A, Dent P. 2014c. Phosphodiesterase 5 inhibitors enhance chemotherapy killing in gastrointestinal / genitourinary cancer cells. Mol Pharmacol 85:408–419. [DOI] [PMC free article] [PubMed] [Google Scholar]
- Booth L, Roberts JL, Conley A, Cruickshanks N, Ridder T, Grant S, Poklepovic A, Dent P. 2014d. HDAC inhibitors enhance the lethality of low dose salinomycin in parental and stem‐like GBM cells. Cancer Biol Ther 15:305–316. [DOI] [PMC free article] [PubMed] [Google Scholar]
- Booth L, Roberts JL, Cash DR, Tavallai S, Jean S, Fidanza A, Cruz‐Luna T, Siembiba P, Cycon KA, Cornelissen CN, Dent P. 2015a. GRP78/BiP/HSPA5/Dna K is a universal therapeutic target for human disease. J Cell Physiol 230:1661–1676. doi: 10.1002/jcp.24919. PMID: 25546329 [DOI] [PMC free article] [PubMed] [Google Scholar]
- Booth L, Roberts JL, Tavallai M, Nourbakhsh A, Chuckalovcak J, Carter J, Poklepovic A, Dent P. 2015b. OSU‐03012 and Viagra Treatment Inhibits the Activity of Multiple Chaperone Proteins and Disrupts the Blood Brain Barrier: Implications for Anti‐Cancer Therapies. J Cell Physiol. doi: 10.1002/jcp.24977. [Epub ahead of print] PMID: 25736380 [DOI] [PMC free article] [PubMed] [Google Scholar]
- Bredèche MF, Ehrlich SD, Michel B. 2001. Viability of rep recA mutants depends on their capacity to cope with spontaneous oxidative damage and on the DnaK chaperone protein. J Bacteriol 183:2165–2171. [DOI] [PMC free article] [PubMed] [Google Scholar]
- Burugu S, Daher A, Meurs EF, Gatignol A. 2014. HIV‐1 translation and its regulation by cellular factors PKR and PACT. Virus Res S0168–S1702. [DOI] [PubMed] [Google Scholar]
- Carleton M, Brown DT. 1997. The formation of intramolecular disulfide bridges is required for induction of the Sindbis virus mutant ts23 phenotype. J Virol 71:7696–7703. [DOI] [PMC free article] [PubMed] [Google Scholar]
- Carr BI, D'Alessandro R, Refolo MG, Iacovazzi PA, Lippolis C, Messa C, Cavallini A, Correale M, Di Carlo A. 2013. Effects of low concentrations of regorafenib and sorafenib on human HCC cell AFP, migration, invasion, and growth in vitro. J Cell Physiol 228:1344–1350. [DOI] [PMC free article] [PubMed] [Google Scholar]
- Chen WT, Zhu G, Pfaffenbach K, Kanel G, Stiles B, Lee AS. 2014. GRP78 as a regulator of liver steatosis and cancer progression mediated by loss of the tumor suppressor PTEN. Oncogen 33:4997–5005. [DOI] [PMC free article] [PubMed] [Google Scholar]
- Chen Y, Brandizzi F. 2013. IRE1: ER stress sensor and cell fate executor. Trends Cell Biol 23:547–555. [DOI] [PMC free article] [PubMed] [Google Scholar]
- Chiu HC, Kulp SK, Soni S, Wang D, Gunn JS, Schlesinger LS, Chen CS. 2009b. Eradication of intracellular Salmonella enterica serovar Typhimurium with a small‐molecule, host cell‐directed agent. Antimicrob Agents Chemother 53:5236–5244. [DOI] [PMC free article] [PubMed] [Google Scholar]
- Chiu HC, Soni S, Kulp SK, Curry H, Wang D, Gunn JS, Schlesinger LS, Chen CS. 2009. Eradication of intracellular Francisella tularensis in THP‐1 human macrophages with a novel autophagy inducing agent. J Biomed Sci 16:110. [DOI] [PMC free article] [PubMed] [Google Scholar]
- Choi CY, Park KR, Lee JH, Jeon YJ, Liu KH, Oh S, Kim DE, Yea SS. 2007. Isoeugenol suppression of inducible nitric oxide synthase expression is mediated by down‐regulation of NF‐kappaB, ERK1/2, and p38 kinase. Eur J Pharmacol 576:151–159. [DOI] [PubMed] [Google Scholar]
- Cohen PR. 2015. Sorafenib‐associated facial acneiform eruption. Dermatol Ther (Heidelb) 5:77–86. [DOI] [PMC free article] [PubMed] [Google Scholar]
- Cortes GT, Winograd E, Wiser MF. 2003. Characterization of proteins localized to a subcellular compartment associated with an alternate secretory pathway of the malaria parasite. Mol Biochem Parasito 129:127–135. [DOI] [PubMed] [Google Scholar]
- Cui W, Yu CH, Hu KQ. 2005. In vitro and in vivo effects and mechanisms of celecoxib‐induced growth inhibition of human hepatocellular carcinoma cells. Clin Cancer Res 11:8213–8221. [DOI] [PubMed] [Google Scholar]
- Dabo S, Meurs EF. 2012. DsRNA‐dependent protein kinase PKR and its role in stress, signaling and HCV infection. Viruses 4:2598–2635. [DOI] [PMC free article] [PubMed] [Google Scholar]
- Das A, Xi L, Kukreja RC. 2008. Protein kinase G‐dependent cardioprotective mechanism of phosphodiesterase‐5 inhibition involves phosphorylation of ERK and GSK3beta. J Biol Chem 283:29572–29585. [DOI] [PMC free article] [PubMed] [Google Scholar]
- Deguchi A, Thompson WJ, Weinstein IB. 2004. Activation of protein kinase G is sufficient to induce apoptosis and inhibit cell migration in colon cancer cells. Cancer Res 64:3966–3973. [DOI] [PubMed] [Google Scholar]
- Descamps V, Helle F, Louandre C, Martin E, Brochot E, Izquierdo L, Fournier C, Hoffmann TW, Castelain S, Duverlie G, Galmiche A, François C. 2015. The kinase‐inhibitor sorafenib inhibits multiple steps of the Hepatitis C Virus infectious cycle in vitro. Antiviral Res 0S0166‐3542(15) 00076–5. DOI: 10.1016/j.antiviral.2015.03.012. [DOI] [PubMed] [Google Scholar]
- Devan BD, Pistell PJ, Duffy KB, Kelley‐Bell B, Spangler EL, Ingram DK. 2014. Phosphodiesterase inhibition facilitates cognitive restoration in rodent models of age‐related memory decline. NeuroRehabilitation 34:101–111. [DOI] [PubMed] [Google Scholar]
- Dimcheff DE, Faasse MA, McAtee FJ, Portis JL. 2004. Endoplasmic reticulum (ER) stress induced by a neurovirulent mouse retrovirus is associated with prolonged BiP binding and retention of a viral protein in the ER. J Biol Chem 279:33782–33790. [DOI] [PubMed] [Google Scholar]
- Donnelly N, Gorman AM, Gupta S, Samali A. 2013. The eIF2α kinases: their structures and functions. Cell Mol Life Sci 70:3493–3511. [DOI] [PMC free article] [PubMed] [Google Scholar]
- Earl PL, Moss B, Doms RW. 1991. Folding, interaction with GRP78‐BiP, assembly, and transport of the human immunodeficiency virus type 1 envelope protein. J Virol 65:2047–2055. [DOI] [PMC free article] [PubMed] [Google Scholar]
- Elser C, Siu LL, Winquist E, Agulnik M, Pond GR, Chin SF, Francis P, Cheiken R, Elting J, McNabola A, Wilkie D, Petrenciuc O, Chen EX. 2007. Phase II trial of sorafenib in patients with recurrent or metastatic squamous cell carcinoma of the head and neck or nasopharyngeal carcinoma. J Clin Oncol 25:3766–3773. [DOI] [PubMed] [Google Scholar]
- Friebe A, Koesling D. 2009. The function of NO‐sensitive guanylyl cyclase: what we can learn from genetic mouse models. Nitric Oxide 21:149–156. [DOI] [PubMed] [Google Scholar]
- Gao M, Yeh PY, Lu YS, Hsu CH, Chen KF, Lee WC, Feng WC, Chen CS, Kuo ML, Cheng AL. 2008. OSU‐03012, a novel celecoxib derivative, induces reactive oxygen species‐related autophagy in hepatocellular carcinoma. Cancer Res 68:9348–9357. [DOI] [PubMed] [Google Scholar]
- García‐Barroso C, Ricobaraza A, Pascual‐Lucas M, Unceta N, Rico AJ, Goicolea MA, Sallés J, Lanciego JL, Oyarzabal J, Franco R, Cuadrado‐Tejedor M, García‐Osta A. 2013. Tadalafil crosses the blood‐brain barrier and reverses cognitive dysfunction in a mouse model of AD. Neuropharmacology 64:114–123. [DOI] [PubMed] [Google Scholar]
- Giannini C, Sarkaria JN, Saito A, Uhm JH, Galanis E, Carlson BL, Schroeder MA, James CD. 2005. Patient tumor EGFR and PDGFRA gene amplifications retained in an invasive intracranial xenograft model of glioblastoma multiforme. Neuro Onco 7:164–176. [DOI] [PMC free article] [PubMed] [Google Scholar]
- Goodwin EC, Lipovsky A, Inoue T, Magaldi TG, Edwards AP, Van Goor KE, Paton AW, Paton JC, Atwood WJ, Tsai B, DiMaio D. 2011. BiP and multiple DNAJ molecular chaperones in the endoplasmic reticulum are required for efficient simian virus 40 infection. MBi 2:e00101–e00111. [DOI] [PMC free article] [PubMed] [Google Scholar]
- Gorbatyuk MS, Gorbatyuk OS. 2013. The Molecular Chaperone GRP78/BiP as a Therapeutic Target for Neurodegenerative Disorders: A Mini Review. J Genet Syndr Gene The 4:128. [DOI] [PMC free article] [PubMed] [Google Scholar]
- Ha KS, Kim KM, Kwon YG, Bai SK, Nam WD, Yoo YM, Kim PK, Chung HT, Billiar TR, Kim YM. 2003. Nitric oxide prevents 6‐hydroxydopamine‐induced apoptosis in PC12 cells through cGMP‐dependent PI3 kinase/Akt activation. FASEB J 17:1036–1047. [DOI] [PubMed] [Google Scholar]
- Hayden MA, Lange PA, Nakayama DK. 2001. Nitric oxide and cyclic guanosine monophosphate stimulate apoptosis via activation of the Fas‐FasL pathway. J Surg Res 101:183–189. [DOI] [PubMed] [Google Scholar]
- He B. 2006. Viruses, endoplasmic reticulum stress, and interferon responses. Cell Death Differ 13:393–403. [DOI] [PubMed] [Google Scholar]
- Hogue BG, Nayak DP. 1992. Synthesis and processing of the influenza virus neuraminidase, a type II transmembrane glycoprotein. Virology 188:510–517. [DOI] [PubMed] [Google Scholar]
- Hollien J, Lin JH, Li H, Stevens N, Walter P, Weissman JS. 2009. Regulated Ire1‐dependent decay of messenger RNAs in mammalian cells. J Cell Biol 186:323–331. [DOI] [PMC free article] [PubMed] [Google Scholar]
- Hollien J, Weissman JS. 2006. Decay of endoplasmic reticulum‐localized mRNAs during the unfolded protein response. Science 313:104–107. [DOI] [PubMed] [Google Scholar]
- Hotte SJ, Hirte HW. 2002. BAY 43‐9006: Early clinical data in patients with advanced solid malignancies. Curr Pharm Des 8:2249–2253. [DOI] [PubMed] [Google Scholar]
- Inaba H, Rubnitz JE, Coustan‐Smith E, Li L, Furmanski BD, Mascara GP, Heym KM, Christensen R, Onciu M, Shurtleff SA, Pounds SB, Pui CH, Ribeiro RC, Campana D, Baker SD. 2011. Phase I pharmacokinetic and pharmacodynamics study of the multi‐kinase inhibitor sorafenib in combination with clofarabine and cytarabine in pediatric relapsed/refractory leukemia. J Clin Oncol 29:3293–3300. [DOI] [PMC free article] [PubMed] [Google Scholar]
- Jensen AT, Curtis J, Montgomery J, Handman E, Theander TG. 2001. Molecular and immunological characterisation of the glucose regulated protein 78 of Leishmania donovani(1). Biochim Biophys Acta 1549:73–87. [DOI] [PubMed] [Google Scholar]
- Johnson AJ, Smith LL, Zhu J, Heerema NA, Jefferson S, Mone A. 2005. A novel celecoxib derivative, OSU‐03012, induces cytotoxicity in primary CLL cells and transformed B‐cell lymphoma cell line via a caspase‐and Bcl‐2‐independent mechanism. Blood 105:2504–2509. [DOI] [PubMed] [Google Scholar]
- Kang SG, Kim JS, Park K, Kim JS, Groves MD, Nam DH. 2006. Combination celecoxib and temozolomide in C6 rat glioma orthotopic model. Oncol Rep 15:7–13. [PubMed] [Google Scholar]
- Karami‐Tehrani F, Moeinifard M, Aghaei M, Atri M. 2012. Evaluation of PDE5 and PDE9 Expression in Benign and Malignant Breast Tumors. Arch Med Res 43:470–475. [DOI] [PubMed] [Google Scholar]
- Kashfi K, Rigas B. 2005. Is COX‐2 a ‘collateral' target in cancer prevention? Biochem Soc Trans 33:724–727. [DOI] [PubMed] [Google Scholar]
- Kato M, Blanton R, Wang GR, Judson TJ, Abe Y, Myoishi M, Karas RH, Mendelsohn ME. 2012. Direct Binding and Regulation of RhoA by Cyclic GMP‐dependent Protein Kinase Iα. J Biol Chem 287:41342–41351. [DOI] [PMC free article] [PubMed] [Google Scholar]
- Kimata Y, Kohno K. 2011. Endoplasmic reticulum stress‐sensing mechanisms in yeast and mammalian cells. Curr Opin Cell Biol 23:135–142. [DOI] [PubMed] [Google Scholar]
- Klenke FM, Gebhard MM, Ewerbeck V, Abdollahi A, Huber PE, Sckell A. 2006. The selective Cox‐2 inhibitor celecoxib suppresses angiogenesis and growth of secondary bone tumors: an intravital microscopy study in mice. BMC Cancer 12:6–9. [DOI] [PMC free article] [PubMed] [Google Scholar]
- Koehne CH, Dubois RN. 2004. COX‐2 inhibition and colorectal cancer. Semin Oncol 31:12–21. [DOI] [PubMed] [Google Scholar]
- Komalavilas P, Shah PK, Jo H, Lincoln TM. 1999. Activation of mitogen‐activated protein kinase pathways by cyclic GMP and cyclic GMP‐dependent protein kinase in contractile vascular smooth muscle cells. J Biol Chem 274:34301–34309. [DOI] [PubMed] [Google Scholar]
- Kulp SK, Yang YT, Hung CC, Chen KF, Lai JP, Tseng PH, Fowble JW, Ward PJ, Chen CS. 2004. 3‐Phosphoinositide‐dependent protein kinase‐1/Akt signaling represents a major cyclooxygenase‐2‐independent target for celecoxib in prostate cancer cells. Cancer Res 64:1444–1451. [DOI] [PubMed] [Google Scholar]
- Kwan BW, Osbourne DO, Hu Y, Benedik MJ, Wood TK. 2014. Phosphodiesterase DosP increases persistence by reducing cAMP which reduces the signal indole. Biotechnol Bioeng [Epub ahead of print] [DOI] [PubMed] [Google Scholar]
- Lee AS. 2007. GRP78 induction in cancer: therapeutic and prognostic implications. Cancer Res 67:3496–3499. [DOI] [PubMed] [Google Scholar]
- Li L, Zhao M, Navid F, Pratz K, Smith BD, Rudek MA, Baker SD. 2010. Quantitation of sorafenib and its active metabolite sorafenib N‐oxide in human plasma by liquid chromatography‐tandem mass spectrometry. J Chromatogr B Analyt Technol Biomed Life Sci 878:3033–3038. [DOI] [PMC free article] [PubMed] [Google Scholar]
- Lin YG, Shen J, Yoo E, Liu R, Yen HY, Mehta A, Rajaei A, Yang W, Mhawech‐Fauceglia P, DeMayo FJ, Lydon J, Gill P, Lee AS. 2015. Targeting the glucose‐regulated protein‐78 abrogates Pten‐null driven AKT activation and endometrioid tumorigenesis. Oncogene DOI: 10.1038/onc.2015.4. [Epub ahead of print]. [DOI] [PMC free article] [PubMed] [Google Scholar]
- Liu R, Li X, Gao W, Zhou Y, Wey S, Mitra SK, Krasnoperov V, Dong D, Liu S, Li D, Zhu G, Louie S, Conti PS, Li Z, Lee AS, Gill PS. 2013. Monoclonal antibody against cell surface GRP78 as a novel agent in suppressing PI3K/AKT signaling, tumor growth, and metastasis. Clin Cancer Res 6802–6811. [DOI] [PMC free article] [PubMed] [Google Scholar]
- Luo B, Lee AS. 2013. The critical roles of endoplasmic reticulum chaperones and unfolded protein response in tumorigenesis and anticancer therapies. Oncogene 32:805–818. [DOI] [PMC free article] [PubMed] [Google Scholar]
- Martin AP, Park MA, Mitchell C, Walker T, Rahmani M, Thorburn A, Häussinger D, Reinehr R, Grant S, Dent P. 2009. BCL‐2 family inhibitors enhance histone deacetylase inhibitor and sorafenib lethality via autophagy and overcome blockade of the extrinsic pathway to facilitate killing. Mol Pharmacol 76:327–341. [DOI] [PMC free article] [PubMed] [Google Scholar]
- Maurel M, Chevet E, Tavernier J, Gerlo S. 2014. Getting RIDD of RNA: IRE1 in cell fate regulation. Trends Biochem Sci 39:245–254. [DOI] [PubMed] [Google Scholar]
- Mirazimi A, Svensson L. 2000. ATP is required for correct folding and disulfide bond formation of rotavirus VP7. J Virol 74:8048–8052. [DOI] [PMC free article] [PubMed] [Google Scholar]
- Moreno JA, Tiffany‐Castiglioni E. 2014. The Chaperone Grp78 in Protein Folding Disorders of the Nervous System. Neurochem Res Aug 9. [Epub ahead of print]. [DOI] [PubMed] [Google Scholar]
- Narayanan BA, Narayanan NK, Pittman B, Reddy BS. 2006. Adenocarcina of the mouse prostate growth inhibition by celecoxib: downregulation of transcription factors involved in COX‐2 inhibition. Prostate 66:257–265. [DOI] [PubMed] [Google Scholar]
- Ni M, Lee AS. 2007. ER chaperones in mammalian development and human diseases. FEBS Lett 581:3641–3651. [DOI] [PMC free article] [PubMed] [Google Scholar]
- Noguchi A, Ikeda A, Mezaki M, Fukumori Y, Kanemori M. 2014. DnaJ‐promoted binding of DnaK to multiple sites on σ32 in the presence of ATP. J Bacteriol 196:1694–1703. [DOI] [PMC free article] [PubMed] [Google Scholar]
- Panner A, Murray JC, Berger MS, Pieper RO. 2007. Heat shock protein 90alpha recruits FLIPS to the death‐inducing signaling complex and contributes to TRAIL resistance in human glioma. Cancer Res 67:9482–9489. [DOI] [PubMed] [Google Scholar]
- Park MA, Mitchell C, Zhang G, Yacoub A, Allegood J, Häussinger D, Reinehr R, Larner A, Spiegel S, Fisher PB, Voelkel‐Johnson C, Ogretmen B, Grant S, Dent P. 2010b. Vorinostat and sorafenib increase CD95 activation in gastrointestinal tumor cells through a Ca(2+)‐de novo ceramide‐PP2A‐reactive oxygen species‐dependent signaling pathway. Cancer Res 70:6313–6324. [DOI] [PMC free article] [PubMed] [Google Scholar]
- Park MA, Reinehr R, Häussinger D, Voelkel‐Johnson C, Ogretmen B, Yacoub A, Grant S, Dent P. 2010a. Sorafenib activates CD95 and promotes autophagy and cell death via Src family kinases in gastrointestinal tumor cells. Mol Cancer Ther 9:2220–2231. [DOI] [PMC free article] [PubMed] [Google Scholar]
- Park MA, Yacoub A, Rahmani M, Zhang G, Hart L, Hagan MP. 2008. OSU‐03012 stimulates PKR‐like endoplasmic reticulum‐dependent increases in 70‐kDa heat shock protein expression, attenuating its lethal actions in transformed cells. Mol Pharmacol 73:1168–1184. [DOI] [PMC free article] [PubMed] [Google Scholar]
- Patel MI, Subbaramaiah K, Du B, Chang M, Newman RA, Cordon‐Cardo C, Thaler HT, Dannenberg AJ. 2005. Celecoxib inhibits prostate cancer growth: evidence of a cyclooxygenase‐2‐independent mechanism. Clin Cancer Res 11:1999–2007. [DOI] [PubMed] [Google Scholar]
- Pavitt GD, Ron D. 2012. New insights into translational regulation in the endoplasmic reticulum unfolded protein response. Cold Spring Harb Perspect Biol 4: pii: a012278. [DOI] [PMC free article] [PubMed] [Google Scholar]
- Potter LR. 2011. Guanylyl cyclase structure, function and regulation. Cell Signal 23:1921–1926. [DOI] [PMC free article] [PubMed] [Google Scholar]
- Pratz KW, Cho E, Levis MJ, Karp JE, Gore SD, McDevitt M, Stine A, Zhao M, Baker SD, Carducci MA, Wright JJ, Rudek MA, Smith BD. 2010. A pharmacodynamic study of sorafenib in patients with relapsed and refractory acute leukemias. Leukemia 24:1437–1444. [DOI] [PMC free article] [PubMed] [Google Scholar]
- Quinones QJ, de Ridder GG, Pizzo SV. 2008. GRP78: a chaperone with diverse roles beyond the endoplasmic reticulum. Histol Histopathol 23:1409–1416. [DOI] [PubMed] [Google Scholar]
- Rahmani M, Davis EM, Bauer C, Dent P, Grant S. 2005. Apoptosis induced by the kinase inhibitor BAY. J Biol Chem 280:43–9006. [DOI] [PubMed] [Google Scholar]
- Rahmani M, Davis EM, Crabtree TR, Habibi JR, Nguyen TK, Dent P, Grant S. 2007. The kinase inhibitor sorafenib induces cell death through a process involving induction of endoplasmic reticulum stress. Mol Cell Biol 27:5499–5513. [DOI] [PMC free article] [PubMed] [Google Scholar]
- Rao R, Fiskus W, Ganguly S, Kambhampati S, Bhalla KN. 2012. HDAC inhibitors and chaperone function. Adv Cancer Res 116:239–262. [DOI] [PubMed] [Google Scholar]
- Rathore APS, Ng ML, Vasudevan SG. 2013. Differential unfolded protein response during Chikungunya and Sindbis virus infection: CHIKV nsP4 suppresses eIF2α phosphorylation. Virol J 10:36. [DOI] [PMC free article] [PubMed] [Google Scholar]
- Reid SP, Shurtleff AC, Costantino JA, Tritsch SR, Retterer C, Spurgers KB, Bavari S. 2014. HSPA5 is an essential host factor for Ebola virus infection. Antiviral Res 109:171–174. [DOI] [PubMed] [Google Scholar]
- Roberts JL, Booth L, Conley A, Cruickshanks N, Malkin M, Kukreja RC, Grant S, Poklepovic A, Dent P. 2014. PDE5 inhibitors enhance the lethality of standard of care chemotherapy in pediatric CNS tumor cells. Cancer Biol Ther 15:758–767. [DOI] [PMC free article] [PubMed] [Google Scholar]
- Roller C, Maddalo D. 2013. The Molecular Chaperone GRP78/BiP in the Development of Chemoresistance: Mechanism and Possible Treatment. Front Pharmacol 11;4:10. [DOI] [PMC free article] [PubMed] [Google Scholar]
- Roux L. 1990. Selective and transient association of Sendai virus HN glycoprotein with BiP. Virolog 175:161–166. [DOI] [PubMed] [Google Scholar]
- Sano R, Reed JC. 2013. ER stress‐induced cell death mechanisms. Biochim Biophys Acta 1833:3460–3470. [DOI] [PMC free article] [PubMed] [Google Scholar]
- Sarfati M, Mateo V, Baudet S, Rubio M, Fernandez C, Davi F, Binet JL, Delic J, Merle‐Beral H. 2003. Sildenafil and vardenafil, types 5 and 6 phosphodiesterase inhibitors, induce caspase‐dependent apoptosis of B‐chronic lymphocytic leukemia cells. Blood 101:265–269. [DOI] [PubMed] [Google Scholar]
- Schmidt AJ, Ryjenkov DA, Gomelsky M. 2005. The ubiquitous protein domain EAL is a cyclic diguanylate‐specific phosphodiesterase: enzymatically active and inactive EAL domains. J Bacteriol 187:4774–4781. [DOI] [PMC free article] [PubMed] [Google Scholar]
- Sean P, Semler BL. 2008. Coxsackievirus B RNA replication: lessons from poliovirus. Curr Top Microbiol Immunol 323:89–121. [DOI] [PubMed] [Google Scholar]
- Shan X, Quaile MP, Monk JK, French B, Cappola TP, Margulies KB. 2012. Differential expression of PDE5 in failing and nonfailing human myocardium. Circ Heart Fail 5:79–86. [DOI] [PMC free article] [PubMed] [Google Scholar]
- Shen Y, Meunier L, Hendershot LM. 2002. Identification and characterization of a novel endoplasmic reticulum (ER) DnaJ homologue, which stimulates ATPase activity of BiP in vitro and is induced by ER stress. J Biol Chem 277:15947–15956. [DOI] [PubMed] [Google Scholar]
- Spurgers KB, Alefantis T, Peyser BD, Ruthel GT, Bergeron AA, Costantino JA, Enterlein S, Kota KP, Boltz RC, Aman MJ, Delvecchio VG, Bavari S. 2010. Identification of essential filovirion‐associated host factors by serial proteomic analysis and RNAi screen. Mol Cell Proteomics 9:2690–2703. [DOI] [PMC free article] [PubMed] [Google Scholar]
- Tavallai M, Hamed HA, Roberts JL, Cruickshanks N, Chuckalovcak J, Poklepovic A, Booth L, Dent P. 2015. Nexavar/Stivarga and Viagra Interact to Kill Tumor Cells. J Cell Physiol. doi: 10.1002/jcp.24961. [Epub ahead of print] PMID: 25704960 [DOI] [PMC free article] [PubMed] [Google Scholar]
- Thompson WJ, Piazza GA, Li H, Liu L, Fetter J, Zhu B, Sperl G, Ahnen D, Pamukcu R. 2000. Exisulind induction of apoptosis involves guanosine 3',5'‐cyclic monophosphate phosphodiesterase inhibition, protein kinase G activation, and attenuated beta‐catenin. Cancer Res 60:3338–3342. [PubMed] [Google Scholar]
- Tong L, Heim RA, Wu S. 2011. Nitric oxide: a regulator of eukaryotic initiation factor 2 kinases. Free Radic Biol Med 50:1717–1725. [DOI] [PMC free article] [PubMed] [Google Scholar]
- Tsai YL, Zhang Y, Tseng CC, Stanciauskas R, Pinaud F, Lee AS. 2015. Characterization and Mechanism of Stress‐induced Translocation of 78‐kilodalton Glucose Regulated Protein (GRP78) to the Cell Surface. J Biol Chem jbc.M114.618736. [Epub ahead of print]. [DOI] [PMC free article] [PubMed] [Google Scholar]
- Tuckerman JR, Gonzalez G, Gilles‐Gonzalez MA. 2011. Cyclic di‐GMP activation of polynucleotide phosphorylase signal‐dependent RNA processing. J Mol Biol 407:633–639. [DOI] [PubMed] [Google Scholar]
- Vélez Acevedo, Kandler C, Shafer JL, Cornelissen WM. 2014. Identification of regulatory elements that control expression of the tbpBA operon in Neisseria gonorrhoeae. J Bacteriol 196:2762–2774. [DOI] [PMC free article] [PubMed] [Google Scholar]
- Wang YC, Kulp SK, Wang D, Yang CC, Sargeant AM, Hung JH, Kashida Y, Yamaguchi M, Chang GD, Chen CS. 2008. Targeting endoplasmic reticulum stress and Akt with OSU‐03012 and gefitinib or erlotinib to overcome resistance to epidermal growth factor receptor inhibitors. Cancer Res 68:2820–2830. [DOI] [PMC free article] [PubMed] [Google Scholar]
- Xu A, Bellamy AR, Taylor JA. 1998. BiP (GRP78) and endoplasmin (GRP94) are induced following rotavirus infection and bind transiently to an endoplasmic reticulum‐localized virion component. J Virol 72:9865–9872. [DOI] [PMC free article] [PubMed] [Google Scholar]
- Xu Z, Jensen G, Yen TS. 1997. Activation of hepatitis B virus S promoter by the viral large surface protein via induction of stress in the endoplasmic reticulum. J Virol 71:7387–7392. [DOI] [PMC free article] [PubMed] [Google Scholar]
- Yacoub A, Park MA, Hanna D, Hong Y, Mitchell C, Pandya AP. 2006. OSU‐03012 promotes caspase‐independent but PERK‐, cathepsin B‐, BID‐, and AIF‐dependent killing of transformed cells. Mol Pharmacol 70:589–603. [DOI] [PubMed] [Google Scholar]
- Yang Y, Chen S, Zhang J, Li C, Sun Y, Zhang L, Zheng X. 2014. Stimulation of autophagy prevents amyloid‐β peptide‐induced neuritic degeneration in PC12 cells. J Alzheimers Dis 40:929–939. [DOI] [PubMed] [Google Scholar]
- Yu H, Li S, Yang C, Wei M, Song C, Zheng Z, Gu Y, Du H, Zhang J, Xia N. 2011. Homology model and potential virus‐capsid binding site of a putative HEV receptor Grp78. J Mol Model 17:987–995. [DOI] [PubMed] [Google Scholar]
- Zhang J, Guo J, Zhao X, Chen Z, Wang G, Liu A, Wang Q, Zhou W, Xu Y, Wang C. 2013. Phosphodiesterase‐5 inhibitor sildenafil prevents neuroinflammation, lowers beta‐amyloid levels and improves cognitive performance in APP/PS1 transgenic mice. Behav Brain Res 250:230–237. [DOI] [PubMed] [Google Scholar]
- Zhang S, Sun Y, Chen H, Dai Y, Zhan Y, Yu S, Qiu X, Tan L, Song C, Ding C. 2014. Activation of the PKR/eIF2α signaling cascade inhibits replication of Newcastle disease virus. Virol J 11:62. [DOI] [PMC free article] [PubMed] [Google Scholar]
- Zhang S, Suvannasankha A, Crean CD, White VL, Johnson A, Chen CS, Farag SS. 2007. OSU‐03012, a novel celecoxib derivative, is cytotoxic to myeloma cells and acts through multiple mechanisms. Clin Cancer Res 13:4750–4758. [DOI] [PubMed] [Google Scholar]
- Zhang X, Yan G, Ji J, Wu J, Sun X, Shen J, Jiang H, Wang H. 2012. PDE5 inhibitor promotes melanin synthesis through the PKG pathway in B16 melanoma cells. J Cell Biochem 113:2738–2743. [DOI] [PubMed] [Google Scholar]
- Zhu B, Strada SJ. 2007. The novel functions of cGMP‐specific phosphodiesterase 5 and its inhibitors in carcinoma cells and pulmonary/cardiovascular vessels. Curr Top Med Chem 7:437–454. [DOI] [PubMed] [Google Scholar]
- Zhu B, Strada S, Stevens T. 2005a. Cyclic GMP‐specific phosphodiesterase 5 regulates growth and apoptosis in pulmonary endothelial cells. Am J Physiol Lung Cell Mol Physiol 289:L196–L206. [DOI] [PubMed] [Google Scholar]
- Zhu B, Vemavarapu L, Thompson WJ, Strada SJ. 2005b. Suppression of cyclic GMP‐specific phosphodiesterase 5 promotes apoptosis and inhibits growth in HT29 cells. J Cell Biochem 94:336–350. [DOI] [PubMed] [Google Scholar]
- Zhu B, Zhang L, Alexeyev M, Alvarez DF, Strada SJ, Stevens T. 2009. Type 5 phosphodiesterase expression is a critical determinant of the endothelial cell angiogenic phenotype. Am J Physiol Lung Cell Mol Physiol 296:L220–L228. [DOI] [PMC free article] [PubMed] [Google Scholar]
- Zhu J, Huang JW, Tseng PH, Yang YT, Fowble JW, Shiau CW, Shaw YJ, Kulp SK, Chen CS. 2004. From the cyclooxygenase‐2 inhibitor celecoxib to a novel class of 3‐phosphoinositide‐dependent protein kinase‐1 inhibitors. Cancer Res 64:4309–4318. [DOI] [PubMed] [Google Scholar]
- Zusman RM, Morales RM, Glasser DB, Osterloh IH. Overall cardiovascular profile of sildenafil citrate Am J Cardiol 83 1999; 35C–44C. [DOI] [PubMed] [Google Scholar]