Significance
Changes in vigilance and arousal levels can interfere with the study of brain function with functional MRI (fMRI). However, the difficulty of tracking and modeling arousal state during fMRI typically precludes the assessment of arousal-dependent influences on fMRI measurements. Here, we present evidence that continuous variations in arousal level may be monitored from fMRI data alone and validate this approach with a combination of fMRI, intracortical electrophysiology, and a behavioral measure of arousal. We describe a spatial pattern whose time-varying expression in the fMRI data is found to track both electrophysiological and behavioral arousal fluctuations. These findings have implications for increasing the sensitivity of fMRI as a cognitive and clinical biomarker.
Keywords: resting-state fMRI, spontaneous fluctuations, arousal, electrophysiology
Abstract
Changes in brain activity accompanying shifts in vigilance and arousal can interfere with the study of other intrinsic and task-evoked characteristics of brain function. However, the difficulty of tracking and modeling the arousal state during functional MRI (fMRI) typically precludes the assessment of arousal-dependent influences on fMRI signals. Here we combine fMRI, electrophysiology, and the monitoring of eyelid behavior to demonstrate an approach for tracking continuous variations in arousal level from fMRI data. We first characterize the spatial distribution of fMRI signal fluctuations that track a measure of behavioral arousal; taking this pattern as a template, and using the local field potential as a simultaneous and independent measure of cortical activity, we observe that the time-varying expression level of this template in fMRI data provides a close approximation of electrophysiological arousal. We discuss the potential benefit of these findings for increasing the sensitivity of fMRI as a cognitive and clinical biomarker.
During both active task engagement and rest, the human brain exhibits fluctuations in neural activity that can be readily measured using functional MRI (fMRI). In recent years, examining the spatiotemporal organization of these fluctuations has generated novel insight into the functional architecture of the human brain and its changes with development and disease (1). A prominent approach for mapping this architecture is to study interregional correlations in the fMRI signal fluctuations, which, even during rest, appear to be indicative of networks supporting specific functions. However, despite the promise and rapidly increasing application of this technique in the endeavor of brain connectomics (2–4), its sensitivity and specificity are compromised by unexplained variability arising from multiple neural and nonneural sources (e.g., refs. 5–11). As a result, the interpretation of resting-state fMRI data and the efficacy of these data as a biomarker rely critically on understanding and accounting for such sources of variability (11–13).
Changes in arousal, mediated by an interaction between the ascending arousal system and the neocortex, may strongly modulate neuronal activity in much of the brain (14–18). Indeed, changes in vigilance and arousal (hereafter described jointly as “arousal”), which can be especially prevalent during the passive and uncontrolled resting state, result in fMRI signal variability that may confound the extraction of functional networks (5, 19). For example, the amplitude and extent of correlations in resting-state fMRI data vary with EEG- and behaviorally defined indicators of drowsiness and light sleep (20–25) and are altered by sleep deprivation (26–28) and caffeine-induced changes in arousal state (29). Distinct patterns of functional connectivity across multiple networks have been associated with distinct EEG-defined sleep stages (30, 31) with sufficient reliability to enable the identification of sleep stages from fMRI data alone (30). Using the technique described in ref. 30, it was discovered that light sleep is surprisingly prevalent in resting-state scans in which subjects were intended to stay awake (5). Together, these findings indicate that substantial changes in arousal occur in routine, several-minute-long fMRI scans and imply that changes in functional connectivity caused by arousal may be attributed erroneously to core differences in functional organization.
However, variations in arousal level are not typically measured or accounted for in fMRI scans. In addition to the practical difficulties of collecting EEGs during fMRI acquisition, the influence of arousal changes on fMRI measurements of brain activity is not fully understood. Hence, it would be valuable to track instantaneous arousal levels (in addition to sleep stages) from the fMRI data itself and to understand how such changes in state are expressed in fMRI signals. Converging evidence from the neuroimaging literature indicates that arousal changes are associated with a reproducible pattern of increases and decreases in the fMRI signal. Specifically, studies invoking a range of EEG and behavioral measures suggest that elevated arousal may be associated jointly with (i) increased fMRI signal in the thalamus and (ii) decreased signal across widespread areas of neocortex, including the occipital, cingulate, and parietal cortices, with conditions of reduced arousal showing the converse (24, 32–38). Thus, if a pattern of brain activity that is robustly linked with changes in arousal exists, it may be possible to derive an instantaneous measure of arousal level from fMRI data alone. Such a measure, and the associated pattern of fMRI signal changes, could be leveraged to delineate cognitive and clinical variables of interest more sensitively and to infer arousal-driven behavioral variability in task performance. In this report we explored this possibility by performing concurrent fMRI, behavioral measurements, and intracortical electrophysiology in unanesthetized macaques.
Results
fMRI data and arousal measures were obtained from four unanesthetized macaque monkeys (monkeys A, S, F, and Z) seated in a vertical-bore 4.7-T MRI scanner in nearly complete darkness. In two of the four monkeys (A and S), electrophysiological measures from intracortical electrodes were recorded simultaneously with fMRI; in all four monkeys the behavior of one eye was monitored and recorded throughout the scans with an infrared camera. For all scans, monocrystalline iron oxide nanoparticles (MION) administered before fMRI acquisition provided regional cerebral blood volume (rCBV) contrast. Because increases in rCBV produce decreases in signal intensity, we inverted the sign of the rCBV time series of each voxel before analysis so that it was consistent with that of the blood oxygenation level dependent (BOLD) response typically measured in human fMRI, yielding what we refer to throughout as the “fMRI signal.” Further experimental details are provided in SI Methods.
In the following sections, we first describe the spatial pattern of fMRI signal changes linked with a behavioral measure of arousal based on natural eye opening and closing. Next, we describe an approach for estimating the time course of the brain’s electrophysiological state of arousal from the fMRI data. We then evaluate the proposed metric by comparing it with concurrent measurements of EEG-related changes in local field potential (LFP) signals in monkeys A and S.
Spatial Pattern of fMRI Signals Correlated with Behavioral Arousal.
Because eye monitoring was readily available in all monkeys, we first considered a behavioral measure of arousal derived from the natural opening and closing of the eyes as a reference signal for characterizing the spatial distribution of arousal-related changes in fMRI signal. Specifically, behavioral arousal was quantified during each fMRI measurement (every 2.6 s for monkeys A and S and every 2.5 s for monkeys F and Z), wherein the fraction of eyelid opening was taken directly as a “behavioral arousal index” (SI Methods). Although eye behavior is often indicative of altered responsiveness and changes in neurophysiological arousal (39, 40), it provides only an indirect measure of electrophysiological arousal and is not always informative: For instance, fluctuations in arousal can persist while the eyes remain completely closed. Nevertheless, as a first step, we examined the potential for this behavioral measure to yield a reproducible map of arousal-correlated fMRI signals in each subject.
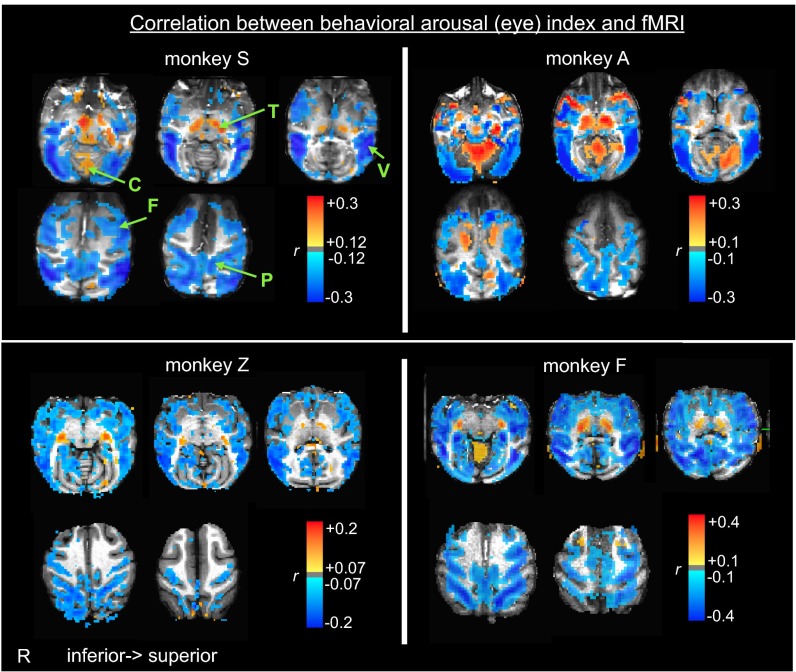
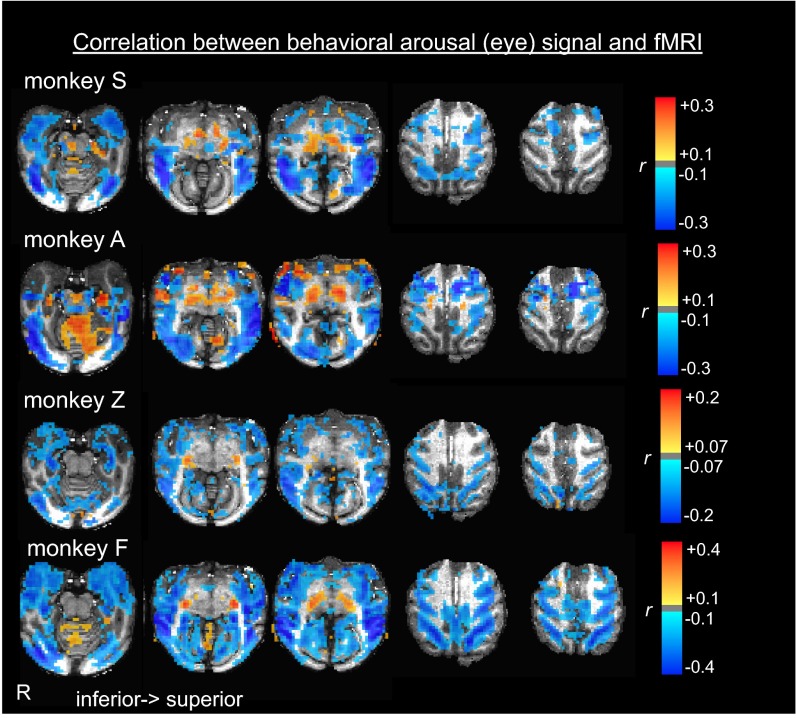
We mapped the correlation between the behavioral arousal index and the fMRI time course of each voxel (SI Methods). As shown in Fig. 1, correlation patterns were largely consistent across monkeys; regions of negative correlation were widespread across cortex, including extrastriate visual cortex, insula, and limbic cortex. At the same time, other brain areas, notably the thalamus and cerebellum, showed an opposite, positive correlation with natural eye opening.
Fig. 1.
Fluctuations in behavioral arousal correlate with resting-state fMRI. Spatial pattern of correlation between the time course of behavioral arousal and the resting-state fMRI signal fluctuations of each voxel. Behavioral arousal was assessed from natural eyelid opening and closing throughout the scan. C, cerebellum; F, frontal cortex; P, intraparietal sulcus; R, side of right hemisphere; T, thalamus; V, visual cortex.
Inferring Electrophysiological Arousal.
The intersubject consistency of the maps in Fig. 1, together with their resemblance to arousal response maps previously characterized with concurrent EEG-fMRI in humans (e.g., refs. 24, 34, 35), suggests that, despite its aforementioned shortcomings, the time course of spontaneous eye opening and closing in darkness may provide a viable means of computing fMRI maps related to electrophysiological arousal. We next explored the use of such a map as an “arousal template,” whereby its time-varying expression in the fMRI data could be used to approximate changes in instantaneous arousal. We reasoned that periods of elevated arousal would be marked by a stronger contribution of this arousal template to the fMRI data, whereas periods of diminished arousal would be marked by weaker, or perhaps negative, contributions. The identification and tracking of this fMRI arousal template thus might provide an approximation for the brain’s electrophysiological state, even under conditions in which behavior cannot be used as a measure of arousal.
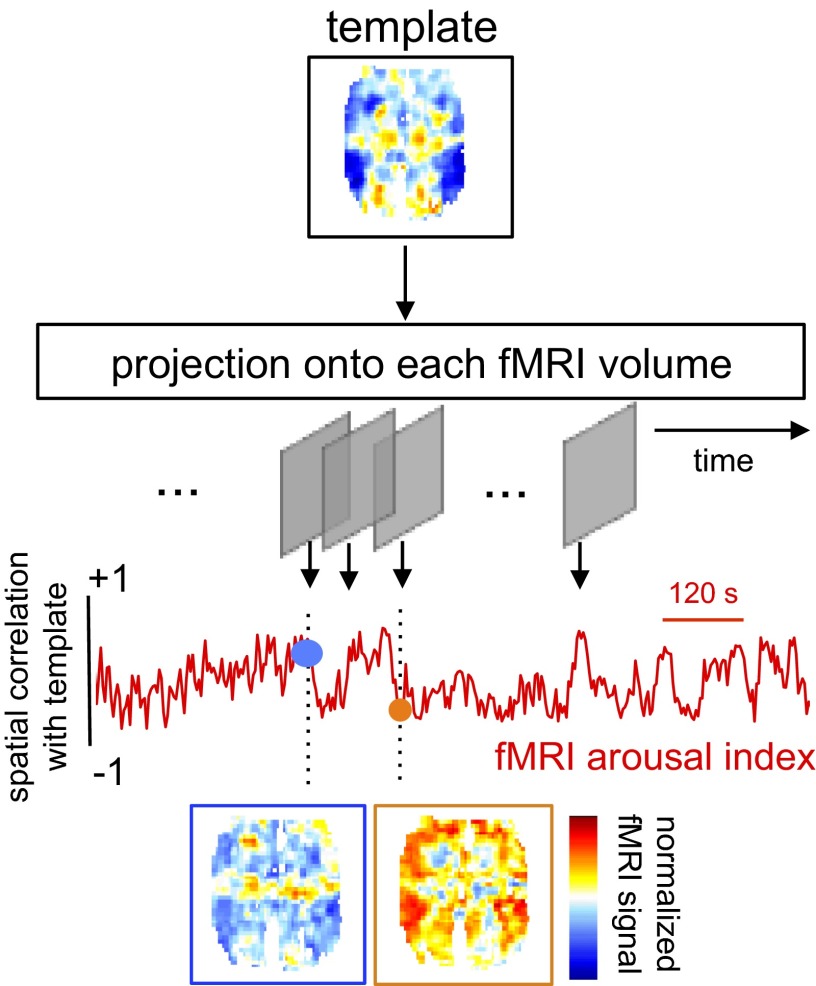
To examine this possibility, we projected the arousal template onto the instantaneous map of fMRI signal intensity (relative to an average baseline) (SI Methods) at each time point via spatial correlation, creating a time course of coefficients reflecting the putative arousal level, the fMRI arousal index (Fig. 2). To avoid circularity, the fMRI arousal index was estimated for segments of the fMRI time series (the validation set) distinct from those used to compute the arousal template (the training set). The fMRI arousal index derived in the validation set then was compared with concurrent eye behavior and LFP measurements, described below. For the results shown throughout this section, the template map was derived on a subject-specific basis; subsequently, we examined the feasibility of a common template by estimating arousal fluctuations in one monkey based on a spatial template derived from the others (see Generalizability of Template Estimation Across Subjects).
Fig. 2.
Method for estimating arousal fluctuation in resting-state fMRI. A spatial template, derived a priori and representing the degree to which voxels across the brain display increased or decreased signal change with behavioral arousal, is projected onto each fMRI volume via spatial correlation. This correlation, quantifying the similarity between the template and the spatial distribution of signal intensity at each preprocessed fMRI volume, traces out a time course of estimated arousal fluctuation, the fMRI arousal index, across the measurement period. Two examples of time frames from monkey S are shown, illustrating the instantaneous patterns (single volumes of the normalized fMRI signal) at frames having high positive and negative spatial correlation with the template. These frames correspond to estimates of increased and decreased levels of arousal, respectively.
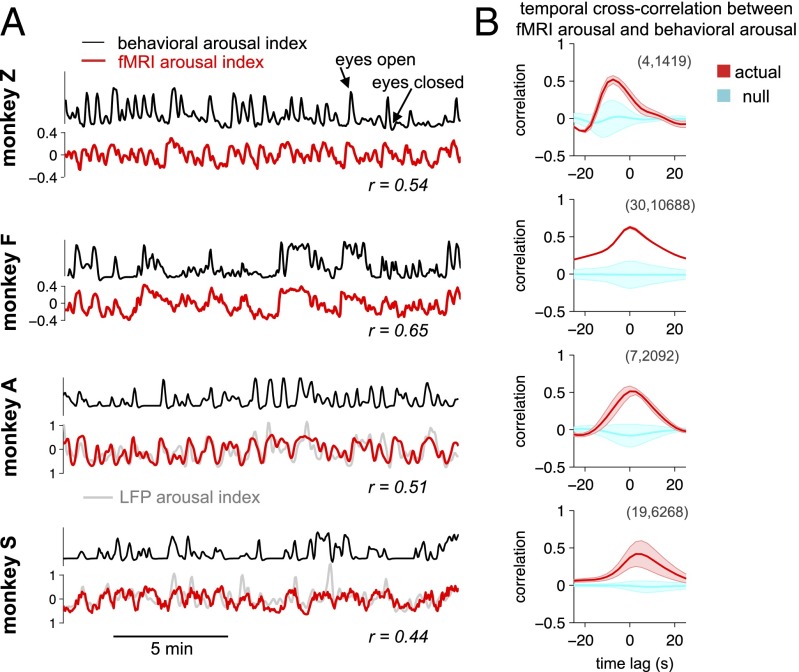
The time course of estimated arousal in the fMRI data corresponded closely with behavioral arousal (Fig. 3). In the examples shown in Fig. 3A, each subject’s template had been derived from a 30-min training set within the same subject that was distinct from the time periods of arousal estimation shown in these panels. The correspondence between the fMRI arousal index and behavioral arousal was quantified with temporal cross-correlation (Methods and Fig. 3B). To consider a more comprehensive collection of different training and validation intervals, multiple training sets were formed by sliding a window of 30-min length, with 50% overlap, across the data (concatenated over sessions) of each monkey. For each training set, all remaining time points were used as the validation set on which temporal cross-correlation between the fMRI arousal index and the measured (behavioral) arousal was calculated. The mean and SD across these iterations are shown in Fig. 3B, and null distributions were obtained with permutation testing (SI Methods). Results for training intervals of shorter duration are shown in Fig. S1.
Fig. 3.
Comparison of estimated arousal with behavioral measurements. (A) Time courses of estimated arousal in fMRI data (fMRI arousal index, red) compared with measurements of natural eye open/closing (behavioral arousal index, black). In each monkey, the template used to generate the fMRI arousal index was derived from a 30-min segment of data (training set) that did not overlap with the time intervals shown here. The unit of estimated arousal is the spatial correlation between each fMRI volume and the template. A comparison with the LFP arousal index in these time intervals (light gray; here, temporally normalized to arbitrary units for display) is provided for the two monkeys with implanted electrodes. Below each panel are Pearson’s correlation coefficients between the fMRI and behavioral arousal indices for the displayed intervals (for monkeys A and S, correlations between fMRI and LFP arousal indices are r = 0.6 and 0.5, respectively). (B) Temporal cross-correlation between the fMRI arousal and behavioral arousal signals. Results corresponding to separate 30-min training periods are shown (mean ± SD) (red) together with a null distribution (cyan) constructed for statistical comparison (SI Methods). Because the total recording duration differed across monkeys, two length-dependent parameters are indicated for reference, indicated in parenthesis in each panel: (i) the number of cross-correlation functions included in the average, and (ii) the number of time points entering into each cross-correlation function, equal to the total length of the data record minus the length of the training period. The small amount of variation seen for monkey F results from the high consistency of its template maps across training intervals (Fig. S2).
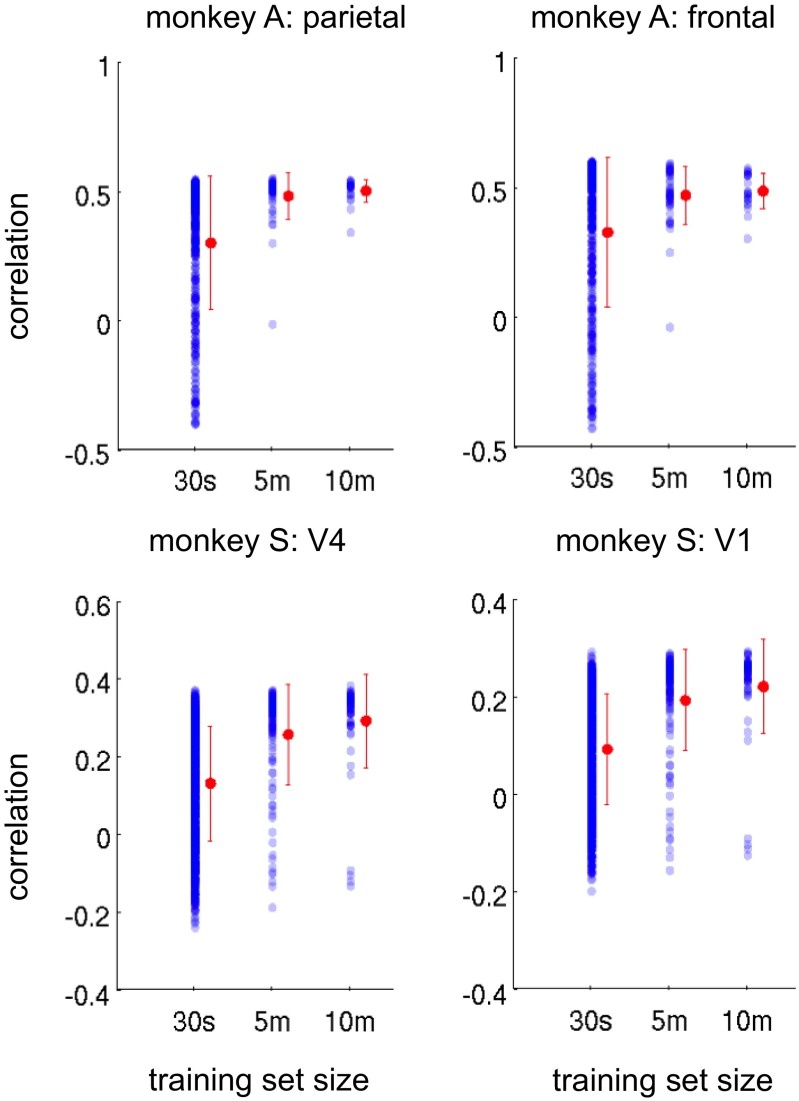
Fig. S1.
Temporal correlation between the fMRI arousal index and the LFP arousal index for template maps computed on training intervals of 30 s, 5 min, and 10 min. Cross-validation methods are identical to those described in SI Methods for the 30-min analysis shown in the main text. Each dot represents the result of one sliding-window training set, and its value is equal to the maximum of the temporal cross-correlation with the LFP arousal index within a lag range of ±5.2s (−2 to +2 TRs), computed on the associated validation set. Training intervals for which there was no variation in the behavioral (eye) signal were excluded. Error bars (red) indicate mean and SD.
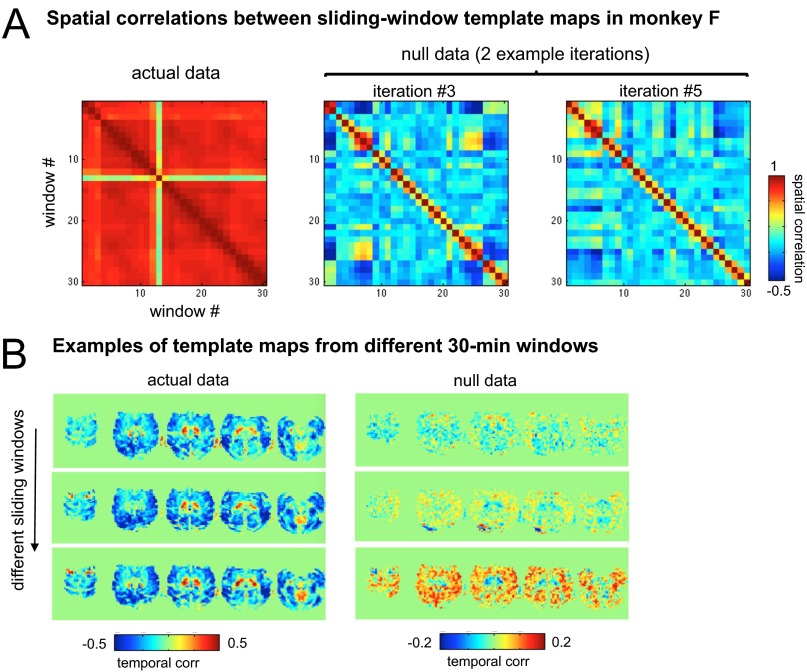
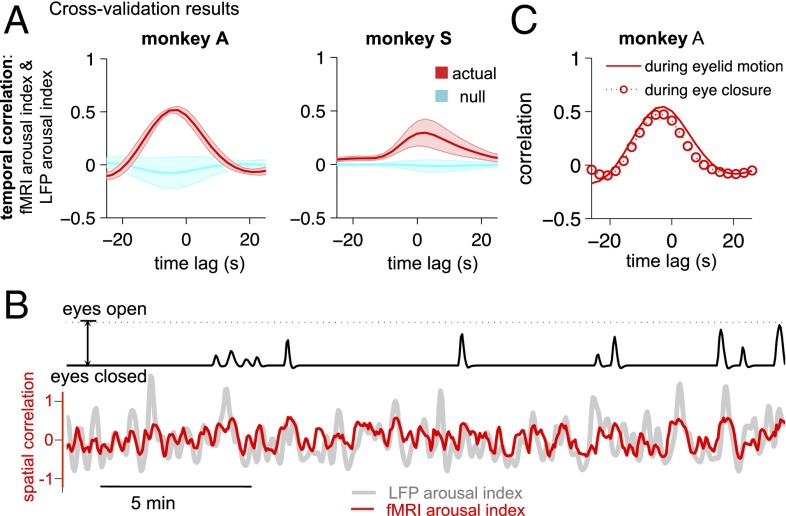
The results of Fig. 3 and Fig. S2 essentially demonstrate the consistency with which behavioral arousal is associated with prototypical patterns in the fMRI data; i.e., they show that templates constructed from subsets of eyelid behavior and fMRI data can be applied to estimate the time course of eyelid behavior across independent segments of data. Next, we proceeded to ask whether the fMRI arousal index tracks electrophysiological arousal by comparing it with the concurrently acquired LFP data in monkeys A and S (Fig. 4). An LFP index of arousal was generated by taking the ratio of power in beta- and theta-range frequency bands (15–25 Hz and 3–7 Hz, respectively) at each fMRI time point, as motivated by earlier studies (e.g., as reviewed in ref. 41; see SI Methods).
Fig. S2.
(A) Consistency of template maps in monkey F. Matrices represent the pairwise spatial correlation between template maps derived from the 30 sliding windows in the actual data of monkey F (Left) and from two iterations of null data (Right). Templates are highly consistent in the actual data. High values on the first off-diagonal result from the 50% overlap between adjacent sliding windows. (B) Examples of template maps (five representative slices) in actual data (Left) and null data (Right) from three distinct and nonadjacent sliding windows. Note the difference in color-scale range between the actual and null panels.
Fig. 4.
Comparison of the fMRI arousal index with LFP arousal measurements. (A) Cross-validation of fMRI arousal index with the LFP arousal index. Results corresponding to separate 30-min training periods are shown (mean ± SD, red) in which the template for each was derived using the behavioral arousal index. The number of cross-correlation runs and time points are identical to those shown in Fig. 3B. The null distribution (cyan) was constructed for statistical comparison (SI Methods). (B) Example of time series from monkey A showing that fluctuations in the fMRI arousal index (red) and LFP arousal index (gray) persist during complete eye closure. Here, the LFP arousal index is temporally normalized for visualization (arbitrary units). (C) Relationship between LFP and fMRI arousal indices during complete eye closure (692 points) compared with during periods of eyelid motion (2,092 points). Comparisons with matched numbers of time points are provided in Fig. S4. The data shown are from the parietal electrode of monkey A and the V4 electrode of monkey S; results for the other electrodes are shown in Fig. S3. In C the template was generated with respect to the behavioral arousal index using all time points.
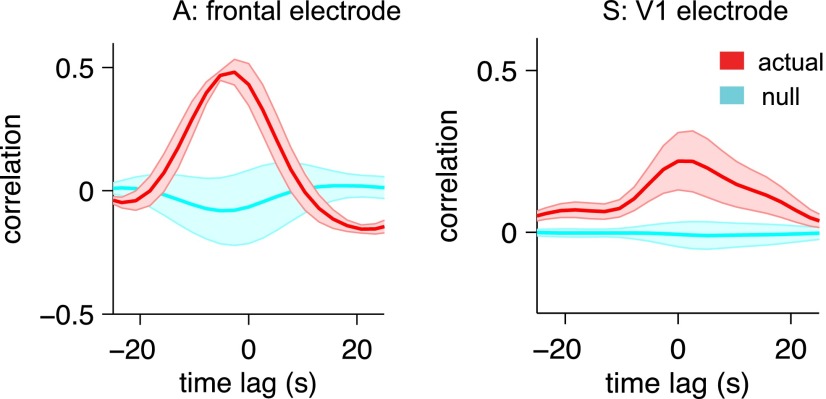
A significant cross-correlation was obtained between the fMRI- and LFP-derived measures of arousal (Fig. 4A and Fig. S3). Further, from the example in Fig. 4B, it is evident that fluctuations in the fMRI arousal index persist even when eye closure is maintained and that they indeed may follow fluctuations in the LFP arousal index. For monkey A, which exhibited lengthy periods of eye closure, we were able to quantify the correlation between the fMRI arousal index and the LFP arousal index throughout periods of complete eye closure as compared with periods of eyelid motion (Fig. 4C and Fig. S4; segmentation of these two conditions is described in SI Methods). Correlations were marginally reduced during eye closure, further supporting the fidelity of this fMRI arousal index to fluctuations in electrophysiological arousal.
Fig. S3.
Comparison of the fMRI arousal index with LFP arousal measurements. Cross-validation of the fMRI arousal index with the LFP arousal index, the latter derived from the frontal electrode of monkey A and the V1 electrode of monkey S. Fig. 4A shows results for the other two electrode locations. As in Fig. 4, results corresponding to separate 30-min training periods are shown (mean ± SD) in which the template for each was derived using the behavioral arousal index. The number of cross-correlation runs and time points are identical to those shown in Figs. 3B and 4A.
Fig. S4.
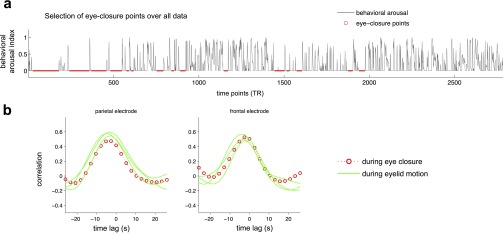
Inferring electrophysiological arousal during eye closure. (A) The behavioral arousal index for all time points of monkey A (concatenated across sessions); time points selected for the eye-closure condition are indicated in red. (B) Cross-correlations between the fMRI and LFP arousal indices during the eye-closure condition compared with time points of eyelid motion (all remaining points). Because the two conditions have different numbers of time points (692 and 2,092, respectively), and the differences in the degrees of freedom of these conditions may affect the magnitude of cross-correlation, the set of eyelid-motion points was partitioned into three disjoint intervals equal in length to the number of eye-closure points, and cross-correlations for each interval are plotted separately (green).
Generalizability of Template Estimation Across Subjects.
Thus far we have described a method of arousal estimation in fMRI that relies on constructing template maps for each individual monkey. This procedure therefore would require at least one calibration scan during which an external measure of arousal (e.g., eyelid behavior or EEG) is recorded to derive a template pattern associated with arousal fluctuation. However, the agreement among the maps in Fig. 1, together with the consistency of a subject-specific arousal estimate demonstrated in Figs. 3 and 4, points to the feasibility of using one canonical template map across subjects. Doing so would allow arousal fluctuation to be estimated in any subject, and in existing datasets, with fMRI alone.
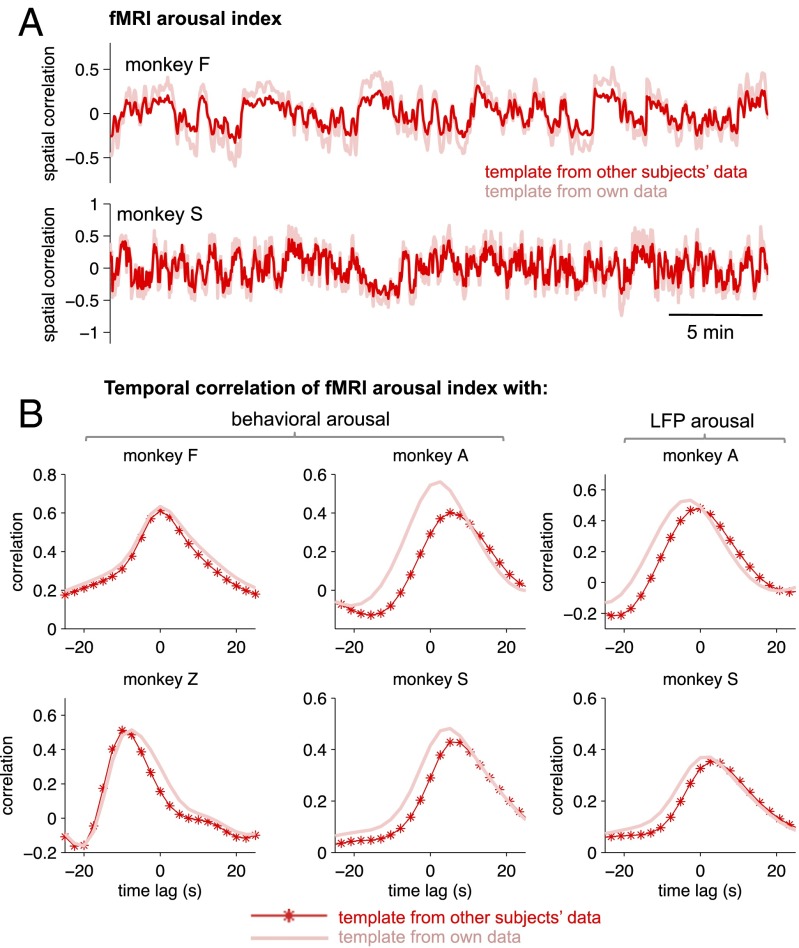
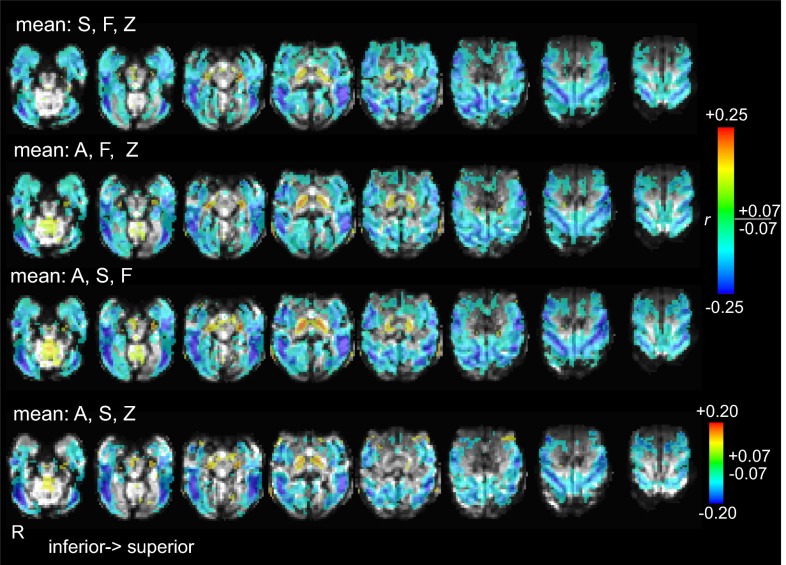
To investigate this possibility, we derived the average template from three monkeys and applied it to estimate arousal fluctuations in a fourth. This process was repeated, in turn, for each monkey. Fig. 5A shows an example of the fMRI arousal index generated for monkey F based on the averaged template maps of monkeys A, S, and Z and for the arousal index generated for monkey S based on the averaged template maps of monkeys A, Z, and F (Figs. S5 and S6). Although the spatial correlation coefficients were smaller than those of subject-specific templates, the correlation with behavioral and LFP measures of arousal remained of comparable magnitude (Fig. 5B). Observed differences in the optimal time lag of cross-correlation may result from a mismatch between the individual template and common template, likely stemming from intersubject variability in the timing at which the eye behavior changes in response to arousal fluctuation.
Fig. 5.
Generalization of templates across subjects. For each of the four monkeys, the fMRI arousal index was estimated based on a template derived either from an average of the remaining three monkeys’ templates (red) or from the same monkey’s data (pink). For the results shown in this figure, the template calculated from a monkey’s own data was based on all available data points and therefore provides an upper bound of the performance obtained from the subject-specific template. (A) Examples of time courses of the fMRI arousal index for two monkeys. (B) Temporal correlation between the fMRI arousal index and the measured behavioral and LFP arousal signals.
Fig. S5.
Template maps transformed to a common space. Maps of voxelwise correlation between fMRI data and behavioral arousal are transformed to a common space (that of monkey F) and overlaid on the high-resolution T1-weighted anatomic image of monkey F. Note that the functional overlays of monkeys A and S appear truncated in the posterior and superior areas because of differences in the field of view of the fMRI acquisitions.
Fig. S6.
Cross-subject average template maps. Template maps averaged over each indicated combination of three monkeys, as used in the section Generalizability of Template Estimation Across Subjects. Maps are transformed to a common space (that of monkey F) and are superimposed on the mean EPI image of monkey F. Voxels in any constituent map that had been truncated because of a limited field of view (see the legend of Fig. S5) did not contribute to the average.
SI Methods
Data Acquisition.
Experimental overview.
fMRI data were acquired from four unanesthetized macaque monkeys seated in nearly complete darkness inside a 4.7-T vertical-bore MRI scanner. Behavior throughout each experimental run was monitored via an infrared video of the monkey’s face. The duration of each run was ∼30 min, and a total of 33 runs across the four monkeys were analyzed for this study (details are provided below and summarized in Table S1). In monkeys A and S, LFPs were acquired concurrently throughout the fMRI scans from multicontact electrode arrays placed simultaneously in occipital areas V1 and V4 in monkey S and in frontal area 6d and parietal area 7a in monkey A. These simultaneous fMRI/electrophysiological data were acquired as part of a previous study; further details concerning the surgeries and experimental procedures can be found in ref. 65. All procedures followed National Institutes of Health guidelines and were approved by the Animal Care and Use Committee.
Table S1.
Parameters of the datasets included in this study
| Monkey | Electrode locations | fMRI matrix size (voxels) | No. of scans | Total no. of TRs used in analysis* | No. of LFP artifact epochs† |
| S | V1, V4 | 44 × 72 × 16 (axial) | 10 | 6,960 | 39 |
| A | Frontal 6d, parietal 7a | 42 × 72 × 15 (axial) | 4 | 2,784 | 0 |
| F | — | 38 × 64 × 42 (sagittal) | 16 | 11,408 | n/a |
| Z | — | 34 × 64 × 42 (sagittal) | 3 | 2,139 | n/a |
After removal of initial time frames from each run for T1 stabilization.
Criteria for artifact identification are described in SI Methods.
MRI data acquisition.
MRI was performed with a 4.7-T/60 cm vertical scanner (Bruker BioSpec 47/60) using a custom-built double–D-shaped transmit–receive RF volume coil (66) (width 100 mm). A single-shot gradient-echo echo-planar imaging (GE-EPI) sequence was used. For monkeys A and S, data were acquired with a repetition time (TR) of 2.6 s and an echo time (TE) of 15.6 ms. The acquisition of each fMRI volume took 1.6 s and was followed by a 1.0-s gap to expose a section of electrophysiological data at each TR that was free from gradient-switching artifacts. Runs consisted of 700 volume acquisitions (1,820 s, or ∼30 min); the first four frames of each run were discarded for T1 stabilization. Further information about acquisitions in monkeys A and S can be found in ref. 65. For monkeys F and Z, data were acquired with a TR of 2.5 s and a TE of 14 ms for monkey Z and a TE of 14.3 ms for monkey F, and runs consisted of 720 volume acquisitions (30 min); the initial seven frames of each run were discarded for T1 stabilization. No electrophysiological data were acquired for these two monkeys. The in-plane resolution of all functional images was 1.5 × 1.5 mm2, and the slice thickness was 1.5 mm, with a 0.5-mm gap between slices for monkeys A and S. The field of view and acquisition planes differed across monkeys and are reported in Table S1.
For all scans, MION were administered i.v. before fMRI acquisition, serving as a T2* contrast agent that isolates the rCBV component of the hemodynamic response and provides a higher contrast-to-noise ratio than that of the BOLD signal. Because increases in rCBV produce decreases in the signal intensity, we inverted the sign of the rCBV time series of each voxel before analysis so that it was consistent with that of the BOLD response, yielding what we refer to throughout as the “fMRI signal.”
Electrophysiological data acquisition.
Electrophysiological data from monkeys A and S were recorded during the fMRI scans and were measured from two types of implanted electrode arrays. Data from monkey A were obtained from a 32-contact linear electrode array penetrating the gray matter; each contact had a diameter of 40 μm and intercontact spacing of 100 μm. Arrays were placed in V1, frontal cortex (area 6d), and parietal cortex (area 7a). Data from monkey S were obtained with a subdural electrocorticography array that tangentially sampled the cortical surface with 32 contacts, each with a diameter of 100 μm, arranged in a regular grid (6 × 6 minus the corners) with 600-um spacing. These arrays were implanted in areas V1 and V4. Signals were recorded using an MR-compatible 32-channel amplifier with an input range of 16 mV (BrainAmp; Brain Products) with a 16-bit A/D converter that sampled the signal at 5 kHz with a resolution of 500 nV. The signal was bandpass filtered between 0.5 and 1,000 Hz. During simultaneous acquisition, the scanner was synchronized with the electrophysiological data via a brief digital pulse delivered at the beginning of each volume acquisition. Data were down-sampled to 200 Hz and further analyzed in MATLAB (www.mathworks.com). Additional details are provided in ref. 65.
Behavioral monitoring.
During the fMRI scans, monkeys sat in nearly complete darkness; no monitor screen was present. An infrared video camera (with sampling rate of 29.97 Hz) inside the bore was focused on the monkey’s face, clearly showing one eye, and these data were used to determine the extent to which the eyes remained open or closed throughout the scan (see Behavioral arousal index below).
Data included in the present study.
A summary of major parameters of the data analyzed for each monkey is provided in Table S1. For monkeys A and S, we initially considered all runs that had been included in the analysis reported in ref. 65. For monkey S, 10 of the 14 runs from the previous study were used, all with electrodes placed simultaneously in areas V1 and V4. One run was excluded because eye-camera data were missing, a second because data across all V1 electrodes were corrupted, a third because a large section of LFP data in the middle of the scan was corrupted, and a fourth because different fMRI acquisition parameters were used. Of the five sessions of monkey A with electrodes placed simultaneously in frontal area 6d and parietal area 7a, one run was excluded because excessive signal dropout prevented adequate spatial alignment to the other sessions. Because of disparate spatial coverage and acquisition parameters, sessions from monkey A in which electrodes were placed in V1 were not analyzed for the present study. Data from monkeys F and Z were acquired as part of a separate study in which resting-state data were acquired following the infusion of either muscimol or saline into the basal forebrain. For the present analysis, we selected only sessions in which saline was injected into the left hemisphere of the basal forebrain (three sessions for monkey Z and 16 sessions for monkey F).
Data Analysis.
fMRI preprocessing.
Motion coregistration (six-parameter rigid body correction), skull-stripping, and between-session alignment were performed with the FMRIB Software Library (FSL) (fsl.fmrib.ox.ac.uk/fsl/fslwiki/), and nuisance signals consisting of low-order trends (polynomials up to the third order) and the six estimated motion parameters were subsequently regressed out. Spatial smoothing (FWHM of 3 mm) was carried out with the Analysis of Functional NeuroImages (AFNI) software (https://afni.nimh.nih.gov/afni). For two runs of monkey A, an oscillatory artifact at the Nyquist frequency (0.1923 Hz) was discovered; therefore, for these two sessions, the artifact was mitigated by temporal low-pass filtering with a nominal cutoff of 0.15 Hz using AFNI. The use of a low-pass filter is common in resting-state fMRI preprocessing.
All analysis was performed in the original image dimensions of each subject except as described in the section Generalizability of Template Estimation Across Subjects, when alignment of fMRI data between subjects was carried out. For this step, the high-resolution T1-weighted anatomic images of monkeys A, S, and Z were first aligned to that of monkey F using the “flirt” routine provided in FSL; the resulting transformation was applied to the fMRI data, which then were resampled to the fMRI image dimensions of monkey F.
LFP preprocessing.
Only segments recorded during the 1-s gap between fMRI volume acquisitions were considered for analysis. For each segment, an additional 0.3 s of data at the beginning was excluded because of noticeable transients following the offset of the imaging gradients. Segments corresponding to the first four fMRI TRs were removed to preserve temporal alignment with the fMRI data. LFP data channels with excessive corruption across a given run were identified manually and removed from further analysis of that run. From the remaining channels, TR segments containing potential motion-related artifacts (defined here as epochs in which the zero-centered signal exceeded ±300 μV) were identified. Linear interpolation was performed across these epochs when calculating the time-series of power in a given frequency band (see LFP arousal index below). To reduce the influence of extreme values further, all temporal segments (TRs) in a given frequency band whose power exceeded four times the SD of that band’s time series across the run were clipped to the value of four times the SD (63).
LFP arousal index.
Following the extraction of artifact-free segments of LFP data between each fMRI volume acquisition (TR; see LFP preprocessing), the power in a given frequency band was computed for each segment using a Hanning-tapered Fourier transform. A measure of electrophysiological arousal at each fMRI time point was formed by taking, at each segment, a ratio of the square root of the power in the 15–25 Hz range to the power in the 3–7 Hz range. A three-tap moving-average filter was applied to the resulting waveform, providing a modest amount of smoothing to increase the signal-to-noise ratio of this LFP arousal index. (Note that the step of hemodynamic response convolution, described below, introduces additional temporal smoothing.)
Both alpha and beta power have been found to increase with arousal and diminish with drowsiness and sleep onset (reviewed in ref. 42). Alpha power is often taken as an arousal measure in the human EEG-fMRI literature under conditions of constant eye closure (e.g., refs. 21, 24). Here we elected to use beta power as the numerator of an electrophysiological arousal index because of the presence of unconstrained eye open/closure that might interfere with the interpretation of alpha power fluctuations (i.e., alpha power typically increases upon voluntary eye closure but diminishes with reduced arousal; it is also noted in ref. 41 that decreased alertness may be associated with decreasing alpha power when the eyes are closed but with increasing alpha power when the eyes are open). According to studies reviewed in ref. 41, the two EEG measures that best correlated with task performance reductions were decreasing beta power and increasing theta power. A study in insomniacs also found that the beta/theta ratio was most effective in discriminating wakefulness from stage-1 sleep (67).
Behavioral arousal index.
From the behavioral videos, we quantified the degree to which the eyes were open or closed over time. For this calculation we extracted the height of a bounding box around the pupil at each movie frame and took its median value within the time bin corresponding to each volume acquisition (TR) of the fMRI data, yielding a time series sampled at the same rate as the fMRI data. For each scan session, this time series was subsequently normalized by dividing by the maximum value, corresponding to the eye being fully open, so that the units were rendered comparable across sessions despite slight variations in the positioning of the camera relative to the eyes. The resulting signal is termed the “behavioral arousal index.” For comparison, we also considered a binary signal (taking the value 1 if eyes were open and 0 if the eyes were closed) based on independent manual scoring of the videos. This binary eye signal exhibited patterns of correlation similar to those in both LFP and fMRI, suggesting that the behavioral arousal signal primarily captures eyelid opening and closure rather than the smaller variations in pupil diameter occurring in darkness.
Combining data across sessions and baseline normalization.
Functional MRI, LFP, and behavioral arousal data were combined across sessions within a given monkey using temporal concatenation. For fMRI data, concatenation was performed following sessionwise temporal normalization to zero mean and unit SD. For LFP data, the band-limited power time series were maintained in their original units.
Convolution of behavioral and LFP arousal measures with HRF.
For all comparisons with the fMRI data and the fMRI arousal index, both the LFP and behavioral arousal indices were convolved with the default gamma-variate HRF provided in SPM (www.fil.ion.ucl.ac.uk/spm), with a time-to-peak similar to that which has been shown for stimulus-driven MION responses and for the cross-correlation between MION signals and LFP (65, 68). No further time-shifting or transformation of these signals was performed, with the exception of the analysis described below in Variance explained in fMRI data by behavioral arousal, which uses a set of time-shifted signals (finite impulse response basis) instead of convolution with a fixed HRF.
Generation of template maps.
Voxelwise, whole-brain maps of the temporal relationship between the behavioral arousal signal and the fMRI data (Fig. 1) were obtained by taking Pearson’s correlation (zero-lag) between the HRF-convolved behavioral arousal signal and the fMRI data at each voxel. The same procedure (using subsets of the data, as indicated throughout Results) was followed to generate template maps for the fMRI arousal index, and cross-validation was used to evaluate the within- and between-subject stability and generalizability of these templates, as described below.
Cross-validation of the fMRI arousal index.
For within-subject cross-validation, template maps were generated using successive 30-min intervals (with 50% overlap) of training data, from which an estimate of the fMRI arousal index was formed on the remaining (validation) data using spatial correlation with each successive fMRI time frame (illustrated in Inferring Electrophysiological Arousal in the main text). At each cross-validation fold, temporal cross-correlation was applied to evaluate the similarity of the fMRI arousal index with the behavioral arousal (Fig. 3B) and LFP arousal (Fig. 4A) indices during the validation period. To generate a null distribution, the behavioral arousal signal (or LFP arousal signal, in the case of Fig. 4A) was circularly shifted 15 times relative to the fMRI data, in time steps of 50 fMRI time points; for each circular shift, the above cross-validation procedure was repeated. The families of cross-correlation functions resulting from each circular shift were pooled, and their collective mean and SD is shown in Figs. 3B and 4A. For the between-subject cross-validation procedure, templates generated for three of the monkeys (using all their respective time points) were averaged to form a template for the fourth monkey. The fMRI arousal index resulting from this template was subsequently compared with the fourth monkey’s behavioral and (if available) LFP arousal indices (Fig. 5B).
Selection of eye-closure intervals.
To obtain time intervals of constant eye closure in monkey A (Fig. 4 B and C), the behavioral arousal signal was first thresholded at 15% of its maximum value. A nonzero value was used because manual review of the automated the pupil detection showed that, even when the eyes were fully closed, the algorithm occasionally recorded small deviations caused by eyelashes, which were of similar image intensity as the pupil. To increase the likelihood of drawing points from a sustained eye-closure state and to avoid carry-over effects from surrounding time points, only contiguous subthreshold intervals whose duration exceeded 20 TRs (52 s) were considered, and the first six and final four TRs of each interval were excluded. The resulting time points were pooled for assessing LFP–fMRI correlations under this “eye closure” condition, shown in Fig. S4.
Variance explained in fMRI data by behavioral arousal.
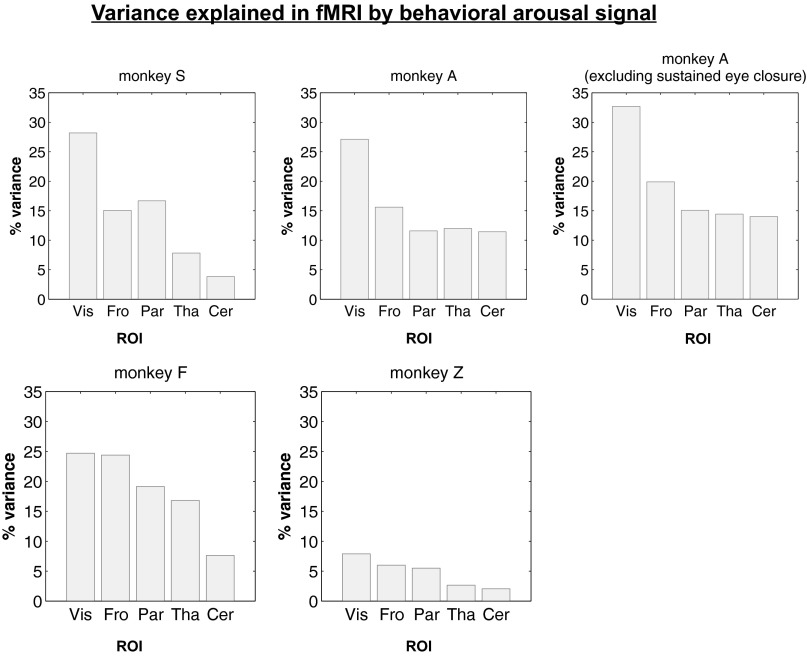
To quantify the variability in fMRI data that may be attributed to fluctuations in behavioral arousal (Fig. S7), a 15-tap causal finite impulse response was used in the temporal mapping between behavioral arousal (without HRF convolution) and fMRI to permit potential regional variation in the HRF. Specifically, 15 time-shifted versions of the unconvolved behavioral arousal index were entered into a linear regression against the fMRI time series of the indicated ROIs, and the variance explained (R2, equal to one minus the ratio of the residual sum of squares to the total sum of squares) is reported.
Fig. S7.
Temporal variance in fMRI data explained by behavioral arousal. The percentage of fMRI signal variance accounted for by behavioral arousal (R2) in a linear convolution model (SI Methods) is shown for five selected ROIs with the dimensions 3 mm × 3 mm × 1.5 mm. For monkey A, which engaged in lengthy periods of constant eye closure, the percent variance is also shown after excluding periods of sustained eye closure, defined according to criteria described in SI Methods. Cer, cerebellum; Fro, frontal cortex; Par, intraparietal sulcus; Tha, thalamus; Vis, visual cortex.
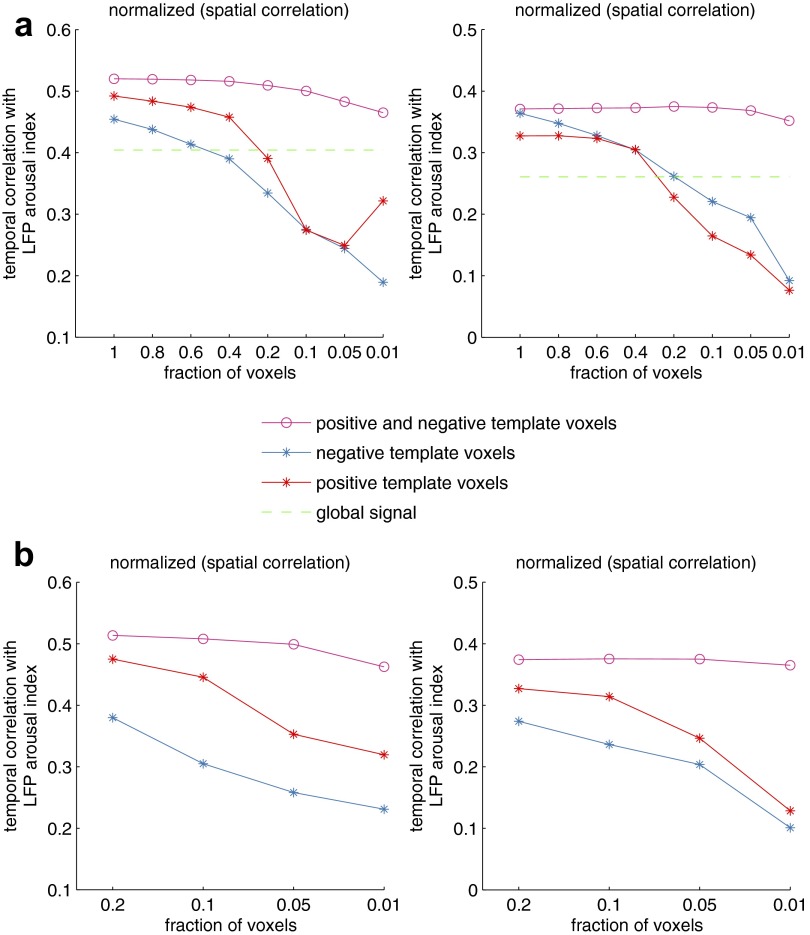
Template thresholding analysis and comparison with global signal.
To examine the impact of pruning the template, we successively increased the threshold to retain a specified fraction of voxels having the strongest correlation with the behavioral arousal index. The subject-specific template map was taken as the full template, consisting of each voxel’s temporal correlations with the behavioral arousal index over all time points (Fig. 1). At each iteration, the fMRI arousal index was derived using the resulting reduced voxel sets and was compared with the LFP arousal index, via temporal cross-correlation over all time points, in the monkeys for which it was available (monkeys A and S). The maximal temporal correlation value over a set of lags ranging from −10 to 10 TRs was recorded. As shown in Fig. S9A, this process was repeated with three different forms of voxel selection: (i) using only the top k% of negative-valued voxels in the template; (ii) using only the top k% of positive-valued voxels, and (iii) using the top k/2% of negative- and positive-valued voxels, respectively. Because there are different numbers of positive and negative voxels in the full template, each fraction k corresponds to a different number of voxels across the three traces. Therefore in Fig. S9B we also show results based on using equal numbers of voxels at each k. In this panel, the x axis represents the number of voxels (specified in terms of the fraction of total voxels in the template, which begins at 0.2 because of the small number of positive voxels). For comparison, in Fig. S9A we also show results based on using the whole-brain average (global) fMRI signal as an arousal metric. Findings are described in Discussion in the main text.
Fig. S9.
Effects of reducing the spatial template. Subject-specific templates (Fig. 1) were pruned successively to retain the indicated fraction of highest-magnitude voxels drawn from negative-, positive-, or both negative- and positive-signed voxels. These reduced voxel sets were taken as templates for generating the fMRI arousal index, which subsequently was compared with the LFP arousal index via temporal cross-correlation. Additional description is provided in SI Methods. (A) For each of the three voxel sets, the x axis indicates the fraction of voxels relative to the total number in each set separately that were included in the template; i.e., at x = 0.4, we used (i) the highest 40% of positive-valued voxels (red), (ii) the highest 40% of negative-valued voxels (blue), and (iii) the highest 20% of positive values combined with the highest 20% of negative voxels (magenta). For comparison, we show the magnitude of the temporal cross-correlation between the whole-brain average (global) fMRI signal and the LFP arousal index. The sign of this correlation was negative for both monkeys. (B) Here, the x axis indicates the fraction of voxels, relative to the total number of voxels in the full template, that were drawn from each of the three indicated sets. Therefore, at each fraction, the same number of voxels was used to create the templates for each of the three voxel sets.
Sleep-scoring analysis.
We performed sleep staging and event identification on the LFP data to understand whether the reported effects may be linked to sleep and the occurrence of transient events (e.g., vertex sharp waves and k-complexes) that have been shown to have an impact on the BOLD signal (59, 60). As has been done previously in rhesus macaques (69), sleep was scored manually using the settings and standards from the human scoring manual (70) with the following exception: in addition to scoring 30-s intervals, short bouts of non-rapid eye movement (NREM) stage-1 sleep were marked within each interval as “potential microsleeps” if they had a duration of at least 3 s. These additional potential sleep bouts were marked to exclude any possible sleep events more stringently in our reanalysis, which is described in the next paragraph. Vertex sharp waves and k-complexes also were identified manually. This sleep analysis was undertaken for monkey A, which exhibited more prolonged periods of eye closure than monkey S and, importantly, also showed a stronger relationship among the fMRI, behavioral, and LFP arousal indices (Figs. 3–5). Scoring was performed on a representative electrode located in parietal cortex.
We then excised all epochs (TRs) of these potential sleep and sleep events from the time series, accounting for the hemodynamic response. We did so by forming a binary time series containing ‘1’ for each TR containing potential sleep or a sleep event, convolving it with a standard (SPM) HRF, and finally excluding all TRs in which the resulting waveform was nonzero. For evaluation, a template map was formed in the usual fashion (temporal correlation with behavioral arousal index) from this restricted set of time points, and the fMRI arousal index (also calculated using this restricted set of points) was compared with the LFP arousal index.
Importantly, we note that certain aspects of our LFP data rendered the sleep-scoring procedure potentially less reliable than standard EEG recordings: (i) interleaved acquisition had been performed for these concurrent LFP-fMRI recordings, leaving <1 s of clean data between each fMRI volume acquisition (see MRI data acquisition above); and (ii) lack of EMG recordings to allow scoring REM sleep. Therefore, further validation with a different dataset will be necessary to study the effects of transient events and sleep stages more comprehensively.
Discussion
We describe an approach for tracking brain arousal fluctuations based on spatial pattern analysis of fMRI data. Here, the similarity of an fMRI pattern at each time frame to a template of arousal-modulated responses formed a significant estimator of both behavioral and electrophysiological measures of arousal, even when the template was derived from the data of other monkeys. This work extends previous correlational studies of arousal with fMRI data to introduce a framework for continuously monitoring relative arousal levels from fMRI alone. Findings indicate the reliability of an fMRI signal pattern linked with arousal, with implications for improving the mapping of functional connectivity and task-evoked responses with fMRI.
Changes in cortical arousal are mediated by ascending pathways projecting from the brainstem by way of the cingulate fiber bundle and the thalamus (15, 17). Modulation of arousal gives rise to changes in behavior and responsiveness to sensory stimuli (42). The neurophysiological correlates of changes in the arousal state can be observed noninvasively by EEG and more recently have been shown to have correlates in human fMRI (43) resembling the pattern linked with spontaneous eye behavior observed here (Fig. 1). At the threshold between wakefulness and light sleep, widespread fMRI signal changes have been observed wherein much of the cortex appears to be modulated as a unit, whereas subcortical structures (including the thalamus) display opposing fluctuations (e.g., refs. 24, 32–36, 44). Also consistent are observations that negative correlations between the thalamus and cortex in resting-state fMRI are stronger in proportion to daytime sleepiness (45) and under conditions of eye closure than with fixation (46). Additionally, a pattern strikingly similar to the inverse of our template (Fig. 1) has been observed in association with hippocampal ripples (47), which occur preferentially during low arousal. It appears likely that such widespread changes in the fMRI signal result from changes in one or more neurotransmitter systems, a chief candidate being the cholinergic system because of its established involvement in the ascending arousal system and in the modulation of hippocampal ripples (48–50). The opposing fMRI signals between thalamus and cortex may, in part, reflect inhibition of the cortex by the thalamus as part of the latter's putative role as a relay for incoming sensory signals (51).
The extensive modulation of resting-state fMRI signals by arousal introduces variability into interregional correlations and other metrics that are applied toward describing functional brain architecture. In addition to the necessity of minimizing nonneural fluctuations (11), disambiguating common modulatory neural activity from more localized network activity (52) and specific cognitive processes remains a primary challenge in the study of functional organization and for the clinical viability of resting-state fMRI. Toward this aim, we sought to determine the momentary influence of arousal modulation on whole-brain, resting-state fMRI signal fluctuations. Importantly, it may not be possible, even with perfect knowledge of the arousal state, to separate arousal-related signal fluctuations fully from other signals of interest; indeed, these components of neural activity are unlikely to be linearly additive, and other ongoing neural processes may be modulated by arousal changes even if arousal fluctuations per se can be regressed out. Nonetheless, gauging the degree to which arousal fluctuations are influencing momentary brain activity is a critical step toward reducing state-dependent variability (and thus increasing the reproducibility) of measures of resting-state functional connectivity and accounting for variability in task-evoked activity and performance (53, 54).
Although EEG is currently the gold standard for monitoring arousal during fMRI, inference from fMRI data alone has been proposed recently (5, 30). This approach is based on classifying the arousal level within 2-min sliding windows of fMRI data into discrete EEG-defined sleep stages based on the pairwise functional connectivity across multiple regions of interest (ROIs). The fMRI arousal index described here provides distinct and complementary information, estimating a continuous time course of relative arousal level at the temporal resolution of the fMRI signal and predominantly capturing arousal variations on the boundary between wakefulness and light sleep. In principle, it may be used in conjunction with EEG data (and with the aforementioned fMRI sleep-stage classification) to provide a more reliable assessment than that obtained with either modality alone and to encompass a broader spectrum of arousal changes.
Spontaneous eyelid behavior was used here as a starting point for forming a template of arousal-modulated activity because it was readily available in all our subjects. This measure yielded consistent fMRI activation maps across subjects (Fig. 1), which in turn could track electrophysiological arousal even during constant eye closure (Fig. 4). A surprising observation was the amount of variability in the amplitude of the resting-state fMRI signal that could be attributed to spontaneous eye opening and closing; in some monkeys and ROIs, this fraction reached nearly 30% (Fig. S7 and SI Methods). Given the stability of template patterns observed here in macaques, generalizable templates also might be obtained for human subjects, such as from a dedicated fMRI subject cohort, with EEG and/or eye-monitoring. Such a template then could be used to reexamine large fMRI datasets (e.g., refs. 2, 4).
In comparing the fMRI arousal index with behavioral or LFP arousal indices, the maximum temporal correlation values with either signal were around 0.5–0.6 (Figs. 3–5). Beyond the factors described above, reductions from unity may originate from nonneural fluctuations such as artifacts from respiration and cardiac processes. Here, only motion effects were regressed out during preprocessing, because physiological measurements were not available for all monkeys (only monkeys F and Z had end-tidal CO2 recordings). Moreover, because the LFP signals were acquired only from single sites in the cortex, we might speculate that electrophysiological measurements integrated over more widely sampled electrodes may bear even stronger correlations with our estimate of fMRI arousal. However, the maximal correlation values observed here are comparable to, or exceed, correlations between electrophysiological and fMRI signals in the human and macaque literature (e.g., refs. 55, 56). The degree to which the fMRI arousal index can be influenced by task responses or by neural activity related to other mental processes is a consideration that warrants further investigation. Our approach, which compares the joint (multivariate) pattern of fMRI signal levels across the brain to a spatial template—akin to the dual regression method for independent component analysis (57) and analysis of coactivation patterns (58)—may be less susceptible to the influence of other ongoing fluctuations.
A further question is the degree to which sleep and transient sleep events such as k-complexes and vertex sharp waves (59, 60) drive the reported fMRI arousal patterns. To examine this question, we performed sleep scoring of the LFP data (SI Methods) and excluded time points corresponding to potential sleep and sleep events in monkey A. Excluding these time points had a minor impact on the spatial correlation between behavioral arousal and fMRI data and on the correspondence between the fMRI and LFP arousal indices (SI Results and Fig. S8). However, because of the limitations of our LFP dataset for sleep scoring (SI Methods), further validation will be necessary to study the impact of transient events and sleep stages more comprehensively.
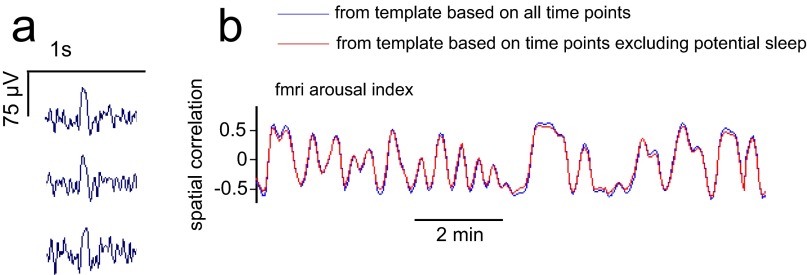
Fig. S8.
Effects of removing potential sleep epochs. (A) Example of a vertex sharp wave identified in one epoch of the LFP data, shown across three electrodes in parietal cortex. (B) fMRI arousal index, as estimated from template maps computed either on all time points (blue) or on the set of time points excluding potential sleep and sleep events (red). Data are shown for a time interval in which no potential sleep or sleep events were identified.
Our fMRI arousal index was derived using a spatial template encompassing all brain regions in the field of view, but it is possible that a smaller number of informative voxels may suffice. To investigate this question, we successively reduced the volume of the spatial template so as to retain smaller fractions of the voxels having the strongest correlations with the behavioral arousal index (SI Methods). We also assessed the impact of including only positive- or only negative-valued voxels in the template. Jointly including positive and negative voxels outperformed the use of voxels from either set alone and the whole-brain average fMRI signal (Fig. S9), suggesting that the pattern of opposing fluctuations across regions such as thalamus and cortex provides critical information about arousal state. Correlations with the global signal were still relatively high, and indeed one may expect that, in scans in which arousal influences predominate over other common neural or artifactual fluctuations, the global signal may resemble the arousal-related fMRI signal that is shared among the spatially extensive negative voxels in the template (Fig. 1).
An interesting feature of the template pattern is its overlap with areas of the well-described default-mode network (61), including cingulate cortex, prefrontal cortex, and lateral parietal areas. A hallmark of the default-mode network is its tendency to exhibit elevated activity during passive, resting conditions and internally oriented mentation (62). Given the likelihood of reduced arousal during passive conditions, some degree of overlap with (negative) arousal-driven responses may not be surprising. The extent to which default-mode functional connectivity arises from common modulation by the arousal system or from a separate mechanism warrants further investigation. Also of note is that both the thalamus and cerebellum have been included within a network implicated in tonic alertness (63), and the function and activation of this network could overlap considerably with the dynamics of arousal shifts. The tonic alertness network also was reported to have a negative interaction with the externally oriented dorsal attention network (63, 64) anchored by the inferior parietal sulcus and frontal eye fields, which in fact demonstrates opposing behavior in our arousal template. In distinction, other key nodes of the tonic alertness network (insula, anterior cingulate cortex) did not coactivate with thalamus and cerebellum to behavioral arousal in the present study and could signify a divergence between the processes of tonic alertness and arousal.
In summary, the consistency of the pattern by which resting-state fluctuations across much of cortex are modulated with arousal may enable arousal fluctuations to be inferred with fMRI alone. The correlation of estimated arousal fluctuations with measurements of behavioral and electrophysiological signals indicates the utility of this approach for detecting and modeling arousal effects in fMRI studies and for increasing the sensitivity of fMRI as a cognitive and clinical biomarker.
SI Results
Sleep scoring of the LFP data (monkey A) identified 175 epochs (TRs) containing NREM stage-1 sleep or potential microsleeps, of which 28 contained vertex sharp waves. No k-complexes or deeper sleep stages were identified. After removal of these potential sleep and sleep event epochs and accounting for the hemodynamic response (SI Methods), the estimated fMRI arousal index was similar to that derived from a template based on all time points (Fig. S8). The temporal correlation between the fMRI and LFP arousal index calculated over these remaining (nonsleep) points was reduced only slightly, from r = 0.47 to r = 0.46 in the parietal electrode and from r = 0.47 to r = 0.45 in the frontal electrode. The spatial template (the correlation between behavioral arousal index and fMRI data) also was similar before and after the elimination of these time points (spatial correlation of r = 0.98 between the two maps).
These results indicate that the main effect in our study is not critically dependent on the occurrence of transient sleep events. Rather, the phenomenon may primarily capture variations of arousal level at the border between wakefulness and light sleep. Further support comes from the results shown in Fig. S4, in which time intervals of frequent eye opening/closure displayed cross-correlation functions comparable to those having constant eye closure (although one cannot necessarily rule out the occurrence of sleep events during partial eye opening). As noted above (SI Methods), because of the characteristics of our LFP dataset and a lack of EMG recordings, further validation with a different dataset will be necessary.
Methods
All procedures followed National Institutes of Health guidelines and were approved by the Animal Care and Use Committee of the National Institute of Mental Health. Functional MRI and eye-behavior data were obtained from four unanesthetized macaque monkeys seated in nearly complete darkness; for two of the monkeys, LFPs were recorded concurrently. Behavioral and LFP-based measures of arousal were calculated at each fMRI time point (details are given in SI Methods), and each was convolved with the gamma-variate hemodynamic response function (HRF) provided in SPM (www.fil.ion.ucl.ac.uk/spm). Unless stated otherwise, these convolved signals were used throughout for comparisons with fMRI data and the fMRI arousal index. In all figures depicting lagged cross-correlations, peaks to the right of zero indicate that the fMRI arousal index is delayed with respect to the convolved LFP or behavioral arousal signals. A detailed explanation of experimental procedures and data analysis is provided in SI Methods. A summary of major parameters of the data analyzed for each monkey is provided in Table S1.
Acknowledgments
We thank Brian Russ, Mikail Rubinov, Jennifer Evans, and Michael Chen for valuable discussions and David Yu and Katy Smith for assistance with experiments. This research was supported in part by the Intramural Research Programs of the National Institute of Neurological Disorders and Stroke and the National Institute of Mental Health, National Institutes of Health.
Footnotes
The authors declare no conflict of interest.
This article is a PNAS Direct Submission.
This article contains supporting information online at www.pnas.org/lookup/suppl/doi:10.1073/pnas.1520613113/-/DCSupplemental.
References
- 1.Fox MD, Raichle ME. Spontaneous fluctuations in brain activity observed with functional magnetic resonance imaging. Nat Rev Neurosci. 2007;8(9):700–711. doi: 10.1038/nrn2201. [DOI] [PubMed] [Google Scholar]
- 2.Smith SM, et al. WU-Minn HCP Consortium Resting-state fMRI in the Human Connectome Project. Neuroimage. 2013;80:144–168. doi: 10.1016/j.neuroimage.2013.05.039. [DOI] [PMC free article] [PubMed] [Google Scholar]
- 3.Zuo XN, et al. An open science resource for establishing reliability and reproducibility in functional connectomics. Sci Data. 2014;1:140049. doi: 10.1038/sdata.2014.49. [DOI] [PMC free article] [PubMed] [Google Scholar]
- 4.Biswal BB, et al. Toward discovery science of human brain function. Proc Natl Acad Sci USA. 2010;107(10):4734–4739. doi: 10.1073/pnas.0911855107. [DOI] [PMC free article] [PubMed] [Google Scholar]
- 5.Tagliazucchi E, Laufs H. Decoding wakefulness levels from typical fMRI resting-state data reveals reliable drifts between wakefulness and sleep. Neuron. 2014;82(3):695–708. doi: 10.1016/j.neuron.2014.03.020. [DOI] [PubMed] [Google Scholar]
- 6.Waites AB, Stanislavsky A, Abbott DF, Jackson GD. Effect of prior cognitive state on resting state networks measured with functional connectivity. Hum Brain Mapp. 2005;24(1):59–68. doi: 10.1002/hbm.20069. [DOI] [PMC free article] [PubMed] [Google Scholar]
- 7.Shirer WR, Ryali S, Rykhlevskaia E, Menon V, Greicius MD. Decoding subject-driven cognitive states with whole-brain connectivity patterns. Cereb Cortex. 2012;22(1):158–165. doi: 10.1093/cercor/bhr099. [DOI] [PMC free article] [PubMed] [Google Scholar]
- 8.Chang C, et al. Association between heart rate variability and fluctuations in resting-state functional connectivity. Neuroimage. 2013;68:93–104. doi: 10.1016/j.neuroimage.2012.11.038. [DOI] [PMC free article] [PubMed] [Google Scholar]
- 9.Yellin D, Berkovich-Ohana A, Malach R. Coupling between pupil fluctuations and resting-state fMRI uncovers a slow build-up of antagonistic responses in the human cortex. Neuroimage. 2015;106:414–427. doi: 10.1016/j.neuroimage.2014.11.034. [DOI] [PubMed] [Google Scholar]
- 10.Fan J, et al. Spontaneous brain activity relates to autonomic arousal. J Neurosci. 2012;32(33):11176–11186. doi: 10.1523/JNEUROSCI.1172-12.2012. [DOI] [PMC free article] [PubMed] [Google Scholar]
- 11.Murphy K, Birn RM, Bandettini PA. Resting-state fMRI confounds and cleanup. Neuroimage. 2013;80:349–359. doi: 10.1016/j.neuroimage.2013.04.001. [DOI] [PMC free article] [PubMed] [Google Scholar]
- 12.Yan CG, Craddock RC, Zuo XN, Zang YF, Milham MP. Standardizing the intrinsic brain: Towards robust measurement of inter-individual variation in 1000 functional connectomes. Neuroimage. 2013;80:246–262. doi: 10.1016/j.neuroimage.2013.04.081. [DOI] [PMC free article] [PubMed] [Google Scholar]
- 13.Buckner RL, Krienen FM, Yeo BT. Opportunities and limitations of intrinsic functional connectivity MRI. Nat Neurosci. 2013;16(7):832–837. doi: 10.1038/nn.3423. [DOI] [PubMed] [Google Scholar]
- 14.Deco G, Hagmann P, Hudetz AG, Tononi G. Modeling resting-state functional networks when the cortex falls asleep: Local and global changes. Cereb Cortex. 2014;24(12):3180–3194. doi: 10.1093/cercor/bht176. [DOI] [PMC free article] [PubMed] [Google Scholar]
- 15.Jones BE. From waking to sleeping: Neuronal and chemical substrates. Trends Pharmacol Sci. 2005;26(11):578–586. doi: 10.1016/j.tips.2005.09.009. [DOI] [PubMed] [Google Scholar]
- 16.Massimini M, et al. Breakdown of cortical effective connectivity during sleep. Science. 2005;309(5744):2228–2232. doi: 10.1126/science.1117256. [DOI] [PubMed] [Google Scholar]
- 17.Saper CB, Scammell TE, Lu J. Hypothalamic regulation of sleep and circadian rhythms. Nature. 2005;437(7063):1257–1263. doi: 10.1038/nature04284. [DOI] [PubMed] [Google Scholar]
- 18.Fox MD, Snyder AZ, Barch DM, Gusnard DA, Raichle ME. Transient BOLD responses at block transitions. Neuroimage. 2005;28(4):956–966. doi: 10.1016/j.neuroimage.2005.06.025. [DOI] [PubMed] [Google Scholar]
- 19.Power JD, Schlaggar BL, Petersen SE. Studying brain organization via spontaneous fMRI signal. Neuron. 2014;84(4):681–696. doi: 10.1016/j.neuron.2014.09.007. [DOI] [PMC free article] [PubMed] [Google Scholar]
- 20.Fukunaga M, et al. Large-amplitude, spatially correlated fluctuations in BOLD fMRI signals during extended rest and early sleep stages. Magn Reson Imaging. 2006;24(8):979–992. doi: 10.1016/j.mri.2006.04.018. [DOI] [PubMed] [Google Scholar]
- 21.Horovitz SG, et al. Low frequency BOLD fluctuations during resting wakefulness and light sleep: A simultaneous EEG-fMRI study. Hum Brain Mapp. 2008;29(6):671–682. doi: 10.1002/hbm.20428. [DOI] [PMC free article] [PubMed] [Google Scholar]
- 22.Larson-Prior LJ, et al. Cortical network functional connectivity in the descent to sleep. Proc Natl Acad Sci USA. 2009;106(11):4489–4494. doi: 10.1073/pnas.0900924106. [DOI] [PMC free article] [PubMed] [Google Scholar]
- 23.Sämann PG, et al. Development of the brain’s default mode network from wakefulness to slow wave sleep. Cereb Cortex. 2011;21(9):2082–2093. doi: 10.1093/cercor/bhq295. [DOI] [PubMed] [Google Scholar]
- 24.Olbrich S, et al. EEG-vigilance and BOLD effect during simultaneous EEG/fMRI measurement. Neuroimage. 2009;45(2):319–332. doi: 10.1016/j.neuroimage.2008.11.014. [DOI] [PubMed] [Google Scholar]
- 25.Chang C, Liu Z, Chen MC, Liu X, Duyn JH. EEG correlates of time-varying BOLD functional connectivity. Neuroimage. 2013;72:227–236. doi: 10.1016/j.neuroimage.2013.01.049. [DOI] [PMC free article] [PubMed] [Google Scholar]
- 26.Sämann PG, et al. Increased sleep pressure reduces resting state functional connectivity. MAGMA. 2010;23(5-6):375–389. doi: 10.1007/s10334-010-0213-z. [DOI] [PubMed] [Google Scholar]
- 27.Verweij IM, et al. Sleep deprivation leads to a loss of functional connectivity in frontal brain regions. BMC Neurosci. 2014;15:88. doi: 10.1186/1471-2202-15-88. [DOI] [PMC free article] [PubMed] [Google Scholar]
- 28.De Havas JA, Parimal S, Soon CS, Chee MW. Sleep deprivation reduces default mode network connectivity and anti-correlation during rest and task performance. Neuroimage. 2012;59(2):1745–1751. doi: 10.1016/j.neuroimage.2011.08.026. [DOI] [PubMed] [Google Scholar]
- 29.Wong CW, Olafsson V, Tal O, Liu TT. The amplitude of the resting-state fMRI global signal is related to EEG vigilance measures. Neuroimage. 2013;83:983–990. doi: 10.1016/j.neuroimage.2013.07.057. [DOI] [PMC free article] [PubMed] [Google Scholar]
- 30.Tagliazucchi E, et al. Automatic sleep staging using fMRI functional connectivity data. Neuroimage. 2012;63(1):63–72. doi: 10.1016/j.neuroimage.2012.06.036. [DOI] [PubMed] [Google Scholar]
- 31.Spoormaker VI, Czisch M, Maquet P, Jancke L. Large-scale functional brain networks in human non-rapid eye movement sleep: Insights from combined electroencephalographic/functional magnetic resonance imaging studies. Philos Trans A Math Phys Eng Sci. 2011;369(1952):3708–3729. doi: 10.1098/rsta.2011.0078. [DOI] [PubMed] [Google Scholar]
- 32.Goldman RI, Stern JM, Engel J, Jr, Cohen MS. Simultaneous EEG and fMRI of the alpha rhythm. Neuroreport. 2002;13(18):2487–2492. doi: 10.1097/01.wnr.0000047685.08940.d0. [DOI] [PMC free article] [PubMed] [Google Scholar]
- 33.Moosmann M, et al. Correlates of alpha rhythm in functional magnetic resonance imaging and near infrared spectroscopy. Neuroimage. 2003;20(1):145–158. doi: 10.1016/s1053-8119(03)00344-6. [DOI] [PubMed] [Google Scholar]
- 34.Ong JL, et al. Co-activated yet disconnected-Neural correlates of eye closures when trying to stay awake. Neuroimage. 2015;118:553–562. doi: 10.1016/j.neuroimage.2015.03.085. [DOI] [PubMed] [Google Scholar]
- 35.Poudel GR, Innes CR, Bones PJ, Watts R, Jones RD. Losing the struggle to stay awake: Divergent thalamic and cortical activity during microsleeps. Hum Brain Mapp. 2014;35(1):257–269. doi: 10.1002/hbm.22178. [DOI] [PMC free article] [PubMed] [Google Scholar]
- 36.Liu Z, et al. Finding thalamic BOLD correlates to posterior alpha EEG. Neuroimage. 2012;63(3):1060–1069. doi: 10.1016/j.neuroimage.2012.08.025. [DOI] [PMC free article] [PubMed] [Google Scholar]
- 37.de Munck JC, et al. The hemodynamic response of the alpha rhythm: An EEG/fMRI study. Neuroimage. 2007;35(3):1142–1151. doi: 10.1016/j.neuroimage.2007.01.022. [DOI] [PubMed] [Google Scholar]
- 38.Mo J, Liu Y, Huang H, Ding M. Coupling between visual alpha oscillations and default mode activity. Neuroimage. 2013;68:112–118. doi: 10.1016/j.neuroimage.2012.11.058. [DOI] [PMC free article] [PubMed] [Google Scholar]
- 39.Abe T, et al. Detecting deteriorated vigilance using percentage of eyelid closure time during behavioral maintenance of wakefulness tests. Int J Psychophysiol. 2011;82(3):269–274. doi: 10.1016/j.ijpsycho.2011.09.012. [DOI] [PubMed] [Google Scholar]
- 40.McGinley MJ, David SV, McCormick DA. Cortical Membrane Potential Signature of Optimal States for Sensory Signal Detection. Neuron. 2015;87(1):179–192. doi: 10.1016/j.neuron.2015.05.038. [DOI] [PMC free article] [PubMed] [Google Scholar]
- 41.Oken BS, Salinsky MC, Elsas SM. Vigilance, alertness, or sustained attention: Physiological basis and measurement. Clin Neurophysiol. 2006;117(9):1885–1901. doi: 10.1016/j.clinph.2006.01.017. [DOI] [PMC free article] [PubMed] [Google Scholar]
- 42.Ogilvie RD. The process of falling asleep. Sleep Med Rev. 2001;5(3):247–270. doi: 10.1053/smrv.2001.0145. [DOI] [PubMed] [Google Scholar]
- 43.Picchioni D, Duyn JH, Horovitz SG. Sleep and the functional connectome. Neuroimage. 2013;80:387–396. doi: 10.1016/j.neuroimage.2013.05.067. [DOI] [PMC free article] [PubMed] [Google Scholar]
- 44.Feige B, et al. Cortical and subcortical correlates of electroencephalographic alpha rhythm modulation. J Neurophysiol. 2005;93(5):2864–2872. doi: 10.1152/jn.00721.2004. [DOI] [PubMed] [Google Scholar]
- 45.Killgore WD, et al. Daytime sleepiness is associated with altered resting thalamocortical connectivity. Neuroreport. 2015;26(13):779–784. doi: 10.1097/WNR.0000000000000418. [DOI] [PubMed] [Google Scholar]
- 46.Zou Q, et al. Functional connectivity between the thalamus and visual cortex under eyes closed and eyes open conditions: A resting-state fMRI study. Hum Brain Mapp. 2009;30(9):3066–3078. doi: 10.1002/hbm.20728. [DOI] [PMC free article] [PubMed] [Google Scholar]
- 47.Logothetis NK, et al. Hippocampal-cortical interaction during periods of subcortical silence. Nature. 2012;491(7425):547–553. doi: 10.1038/nature11618. [DOI] [PubMed] [Google Scholar]
- 48.Vandecasteele M, et al. Optogenetic activation of septal cholinergic neurons suppresses sharp wave ripples and enhances theta oscillations in the hippocampus. Proc Natl Acad Sci USA. 2014;111(37):13535–13540. doi: 10.1073/pnas.1411233111. [DOI] [PMC free article] [PubMed] [Google Scholar]
- 49.Hasselmo ME, McGaughy J. High acetylcholine levels set circuit dynamics for attention and encoding and low acetylcholine levels set dynamics for consolidation. Prog Brain Res. 2004;145:207–231. doi: 10.1016/S0079-6123(03)45015-2. [DOI] [PubMed] [Google Scholar]
- 50.Jones BE. Modulation of cortical activation and behavioral arousal by cholinergic and orexinergic systems. Ann N Y Acad Sci. 2008;1129:26–34. doi: 10.1196/annals.1417.026. [DOI] [PubMed] [Google Scholar]
- 51.Sherman SM, Guillery RW. The role of the thalamus in the flow of information to the cortex. Philos Trans R Soc Lond B Biol Sci. 2002;357(1428):1695–1708. doi: 10.1098/rstb.2002.1161. [DOI] [PMC free article] [PubMed] [Google Scholar]
- 52.Damoiseaux JS, et al. Consistent resting-state networks across healthy subjects. Proc Natl Acad Sci USA. 2006;103(37):13848–13853. doi: 10.1073/pnas.0601417103. [DOI] [PMC free article] [PubMed] [Google Scholar]
- 53.Czisch M, et al. On the need of objective vigilance monitoring: Effects of Sleep loss on target detection and task-negative activity using combined EEG/fMRI. Front Neurol. 2012;3:67. doi: 10.3389/fneur.2012.00067. [DOI] [PMC free article] [PubMed] [Google Scholar]
- 54.Matsuda T, et al. Influence of arousal level for functional magnetic resonance imaging (fMRI) study: Simultaneous recording of fMRI and electroencephalogram. Psychiatry Clin Neurosci. 2002;56(3):289–290. doi: 10.1046/j.1440-1819.2002.01016.x. [DOI] [PubMed] [Google Scholar]
- 55.Mantini D, Perrucci MG, Del Gratta C, Romani GL, Corbetta M. Electrophysiological signatures of resting state networks in the human brain. Proc Natl Acad Sci USA. 2007;104(32):13170–13175. doi: 10.1073/pnas.0700668104. [DOI] [PMC free article] [PubMed] [Google Scholar]
- 56.Goense JB, Logothetis NK. Neurophysiology of the BOLD fMRI signal in awake monkeys. Curr Biol. 2008;18(9):631–640. doi: 10.1016/j.cub.2008.03.054. [DOI] [PubMed] [Google Scholar]
- 57.Filippini N, et al. Distinct patterns of brain activity in young carriers of the APOE-epsilon4 allele. Proc Natl Acad Sci USA. 2009;106(17):7209–7214. doi: 10.1073/pnas.0811879106. [DOI] [PMC free article] [PubMed] [Google Scholar]
- 58.Liu X, Chang C, Duyn JH. Decomposition of spontaneous brain activity into distinct fMRI co-activation patterns. Front Syst Neurosci. 2013;7:101. doi: 10.3389/fnsys.2013.00101. [DOI] [PMC free article] [PubMed] [Google Scholar]
- 59.Jahnke K, et al. To wake or not to wake? The two-sided nature of the human K-complex. Neuroimage. 2012;59(2):1631–1638. doi: 10.1016/j.neuroimage.2011.09.013. [DOI] [PubMed] [Google Scholar]
- 60.Stern JM, et al. Functional imaging of sleep vertex sharp transients. Clin Neurophysiol. 2011;122(7):1382–1386. doi: 10.1016/j.clinph.2010.12.049. [DOI] [PMC free article] [PubMed] [Google Scholar]
- 61.Raichle ME, et al. A default mode of brain function. Proc Natl Acad Sci USA. 2001;98(2):676–682. doi: 10.1073/pnas.98.2.676. [DOI] [PMC free article] [PubMed] [Google Scholar]
- 62.Buckner RL, Andrews-Hanna JR, Schacter DL. The brain’s default network: Anatomy, function, and relevance to disease. Ann N Y Acad Sci. 2008;1124:1–38. doi: 10.1196/annals.1440.011. [DOI] [PubMed] [Google Scholar]
- 63.Sadaghiani S, et al. Intrinsic connectivity networks, alpha oscillations, and tonic alertness: A simultaneous electroencephalography/functional magnetic resonance imaging study. J Neurosci. 2010;30(30):10243–10250. doi: 10.1523/JNEUROSCI.1004-10.2010. [DOI] [PMC free article] [PubMed] [Google Scholar]
- 64.Sadaghiani S, Hesselmann G, Kleinschmidt A. Distributed and antagonistic contributions of ongoing activity fluctuations to auditory stimulus detection. J Neurosci. 2009;29(42):13410–13417. doi: 10.1523/JNEUROSCI.2592-09.2009. [DOI] [PMC free article] [PubMed] [Google Scholar]
- 65.Schölvinck ML, Maier A, Ye FQ, Duyn JH, Leopold DA. Neural basis of global resting-state fMRI activity. Proc Natl Acad Sci USA. 2010;107(22):10238–10243. doi: 10.1073/pnas.0913110107. [DOI] [PMC free article] [PubMed] [Google Scholar]
- 66.Pfeuffer J, Merkle H, Beyerlein M, Steudel T, Logothetis NK. Anatomical and functional MR imaging in the macaque monkey using a vertical large-bore 7 Tesla setup. Magn Reson Imaging. 2004;22(10):1343–1359. doi: 10.1016/j.mri.2004.10.004. [DOI] [PubMed] [Google Scholar]
- 67.Merica H, Gaillard JM. The EEG of the sleep onset period in insomnia: A discriminant analysis. Physiol Behav. 1992;52(2):199–204. doi: 10.1016/0031-9384(92)90258-4. [DOI] [PubMed] [Google Scholar]
- 68.Mandeville JB. IRON fMRI measurements of CBV and implications for BOLD signal. Neuroimage. 2012;62(2):1000–1008. doi: 10.1016/j.neuroimage.2012.01.070. [DOI] [PMC free article] [PubMed] [Google Scholar]
- 69.Hsieh KC, Robinson EL, Fuller CA. Sleep architecture in unrestrained rhesus monkeys (Macaca mulatta) synchronized to 24-hour light-dark cycles. Sleep. 2008;31(9):1239–1250. [PMC free article] [PubMed] [Google Scholar]
- 70.American Academy of Sleep Medicine . AASM Manual for the Scoring of Sleep and Associated Events: Rules, Terminology and Technical Specifications. American Academy of Sleep Medicine; Westchester, IL: 2007. [Google Scholar]


