Significance
Beginning over 40 y ago, a curious type of microemulsions—as transparent dispersion of two immiscible liquids separated by an interfacial film—at thermodynamic equilibrium has been described as “pre-Ouzo,” “detergentless,” or surfactant-free microemulsions. The experiments in ternary systems containing one hydrotropic cosolvent were ambiguous, and therefore, there was no need to come up with a general theory. Recent evidence obtained by specific deuteration in neutron scattering established the need for the extension of self-assembly theories based on Derjaguin-Landau-Verwey-Overbeck theory (DLVO), bending, or phase transfer energy. Here, we introduce a general free energy expression for weak self-assembly, where solvation effects and entropy compete without the influence of film bending, that explains all experimental results for this class of microemulsions.
Keywords: microemulsions, aggregation, micelles, hydrotrope, hydration force
Abstract
Ternary solutions containing one hydrotrope (such as ethanol) and two immiscible fluids, both being soluble in the hydrotrope at any proportion, show unexpected solubilization power and allow strange but yet unexplained membrane enzyme activity. We study the system ethanol-water-octanol as a simple model of such kinds of ternary solutions. The stability of “detergentless” micelles or microemulsions in such mixtures was proposed in the pioneering works of Barden and coworkers [Smith GD, Donelan CE, Barden RE (1977) J Colloid Interface Sci 60(3):488–496 and Keiser BA, Varie D, Barden RE, Holt SL (1979) J Phys Chem 83(10):1276–1281] in the 1970s and then, neglected, because no general explanation for the observations was available. Recent direct microstructural evidence by light, X-ray, and neutron scattering using contrast variation reopened the debate. We propose here a general principle for solubilization without conventional surfactants: the balance between hydration force and entropy. This balance explains the stability of microemulsions in homogeneous ternary mixtures based on cosolvents.
Adding slightly hydrophobic compounds to water can lead to structureless solutions, aggregate formation, or even, formation of defined structures, such as micelles, in the case where the added compound is a surfactant. In ternary or quaternary mixtures containing at least one type of surfactant, the formation of microemulsions usually occurs in specific parts of the phase diagram. These macroscopically homogeneous, transparent liquids are composed of well-defined microstructures with specific signatures in scattering experiments (1). It was only recently that similar structures, designated as “pre-Ouzo,” were found and characterized in ternary mixtures of two partly miscible solvents and one hydrotropic cosolvent (2). In this paper, we present a theory that explains and even predicts the existence of such structures in “detergentless” formulations.
Ouzo, Limoncello, and Pommeau liquors are popular in several European countries and produced by maceration of plants with a specific amount of ethanolic solutions containing some water-insoluble compounds (3). Adding water to those solutions leads to spontaneous formation of fine emulsions with a remarkable stability, a phenomenon that is called the “Ouzo effect” (4). Even common mouthwash products show a similar phenomenon. In common, they entirely clear up on addition of ethanol and get milky with the addition of water (5).
Ternary surfactant-free model systems, such as decane-water-isobutoxyethanol [as studied by Shinoda and Kunieda (6)], however, show this Ouzo effect only for specific points in the composition diagram. The precondition for such behavior seems to be the mixture of two miscible (either completely or at least to a large degree) solvents 1 and 2 with a solute that can also be a liquid (7) (e.g., anethole in the case of Ouzo; component 3). This component 3 must be highly soluble in one solvent (e.g., ethanol) but poorly soluble in the other one (e.g., water) (8).
Whereas the Ouzo effect is increasingly studied and partly understood, we focus our attention on the single-phase adjacent region of the phase diagram, where the water content is still low enough to get a macroscopically homogeneous, stable, transparent one-phase system. Surprisingly, these one-phase systems are structured as revealed by combined X-ray and neutron scattering (2). In analogy to the Ouzo effect, which is related to relatively stable fine emulsions without surfactants, we named the unexpected structuring in these monophasic systems the pre-Ouzo effect, emphasizing that it occurs before the system is diluted with so much water that it phase-separates (9).
There is no quantitative or predictive explanation of this surprising but very common pre-Ouzo solubilization at the mesoscopic scale. The aim of this work is to investigate the underlying mechanism. We use as a model system the generic ternary mixture of water-ethanol-octanol, because detailed measurements of densities and ethanol partition are available (10). Water and octanol present a large miscibility gap, with ethanol being a cosolvent as well as a hydrotrope.
According to the classical theory, based on the balance between the van der Waals and electrostatic interaction combined in the Derjaguin-Landau-Verwey-Overbeck theory (DLVO) approach, it is generally accepted that surfactants in aqueous solutions form micellar and lyotropic liquid crystalline phases (i.e., supramolecular organizations that minimize the free energy above a certain temperature and concentration) (11). Short-chain alcohols, which are surface active but do not fulfill the criteria of micelle-forming surfactants, are used in formulations as a “cosurfactant.” Because they quench the presence of defined surfactant aggregates, they are also known as “hydrotropes” (12, 13). In binary solutions with water, all alcohols form loose networks that can be seen as living polymers, and the 3D mesh that they form has a specific signature in small-angle scattering (14).
However, over the last 30 y, occasional papers postulated the so-called detergentless alias “surfactant-free” microemulsions. Their existence was claimed as a working hypothesis to explain some curious observations, such as the fact that enzymes requiring interfaces work well in such systems (15). The oldest papers go back to the 1970s (7, 8). The key observation at that time was the appearance of three optically clear domains in analytical ultracentrifuge. Beyond the single-phase domain near the phase separation line, they show the Ouzo spontaneous emulsification effect on dilution. Moreover, close to the boundary but nevertheless, far from the critical point, these ternary solutions exhibit dynamic light scattering (16) that is experimentally identical to that characteristic of monodisperse micellar aggregates (17). Recently, density contrast variation using three different isotopic labeling conditions in small-angle neutron scattering (SANS) combined with small-angle high-resolution X-ray scattering (SWAXS) could deliver unambiguous structural information (2). It was shown that water, ethanol, and n-octanol segregate in water-rich and octanol-rich mesoscopic pseudophase domains and that ethanol partitions between these domains (18) with a scattering pattern different from classical microemulsions (SI Materials and Methods, Scattering Data and Interpretation). Clearly, the sample satisfies the international union of pure and applied crystallography (IUPAC) criteria for microemulsions, but the thermodynamic stability of this type of detergentless microemulsions must be of an origin different from classical micelles or microemulsions.
SI Materials and Methods
Scattering Data and Interpretation.
Typical light scattering results obtained in the pre-Ouzo region.
Methodology used in determining static light scattering (SLS) and dynamic light scattering (DLS) data of the system water-n-octanol-ethanol was given by Klossek et al. (9). Two points are crucial to note. First, the scattering signals become less and less pronounced with increasing ethanol content, moving from the pre-Ouzo structured region to the classic and unstructured ethanol-rich ternary solution corner, meaning that there is a continuous “path” in the phase diagram linking well-structured systems to unstructured true ternary mixtures. Second, both SLS and DLS indicate apparent “radii” of microdomains ranging from 1 nm for compositions far away from the two-phase region up to around 10 nm close to it.
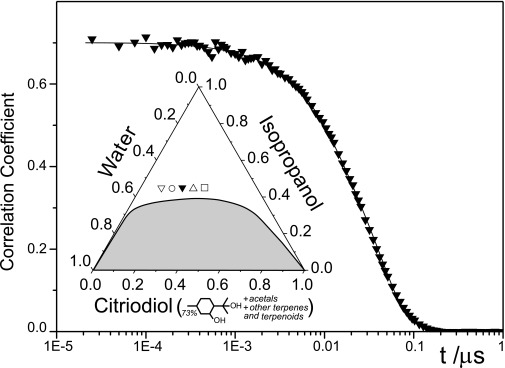
Such typical behavior has been measured for several other ternary systems containing a hydrotrope (3). As an example, Fig. S1 gives the ternary-phase diagram of mixtures of water, isopropanol, and citriodiol as another example of systems showing the pre-Ouzo effect. Fig. S1 also shows the corresponding time-dependent self-correlation function as obtained by DLS for the composition denoted with ▼ in Fig. S1 (20% wt citriodiol). The correlation function resembles the case of monodisperse droplets, although the system is very polydisperse. The reason is because of the conjunction of micelle–micelle critical fluctuations, the fluctuation in local ethanol content, and the presence of strong hydration repulsion between interfaces that are volume-independent.
Fig. S1.
Time-dependent self-correlation function of a ternary system in the pre-Ouzo region. The system has the composition that is indicated by ▼. The inferred apparent radius is given in Table S1 (20% wt citriodiol). (Inset) The corresponding ternary-phase diagram of mixtures of water, isopropanol, and citriodiol. The apparent hydrodynamic radii of the microdomains, as derived from DLS and SLS results, corresponding to the points indicated in the homogeneous, transparent phase region are given in Table S1.
Table S1 contains the apparent radii inferred for these ternary systems and different compositions as also indicated in Fig. S1. Evaluating for the same sample-apparent DLS and SLS in the presence of two types of fluctuations in a ternary system leads to different values: this difference indicates some influence of hydrodynamics and the existence of at least two timescales as in conventional micelles: one related to exchange of surfactant (in our case, ethanol), and the other related to the dynamic coalescence of pre-Ouzo aggregates near this peculiar critical point.
Table S1.
Apparent radii of microdomains as deduced from DLS and SLS produced by ternary mixtures of water, isopropanol, and citriodiol
| Citriodiol, % wt/wt | Radius as obtained by DLS, nm | Radius as obtained by SLS, nm |
| 10 | 1.06 | 0.49 |
| 15 | 1.12 | 0.56 |
| 20 | 1.17 | 0.58 |
| 25 | 1.02 | 0.55 |
| 30 | 0.8 | 0.49 |
The compositions of the samples correspond to the symbols indicated in Fig. S1.
General features of SANS and small-angle X-ray scattering patterns.
Detailed microstructural information can be captured by examining small-angle X-ray scattering (SAXS) and SANS scattering as shown on the absolute scale in Fig. S2. The standard procedure used for SANS studies of structures in ternary systems consists of selective deuteration of two of three components involved (the latter remaining fully protonated). Then, we call contrast P1 when octanol is fully protonated (“octanol only”), contrast P3 when water is the only nondeuterated component, and interfacial film contrast P2 when ethanol is the single protonated component. Diat et al. (2) have given a detailed analysis and discussion of the relative intensities at vanishing angles to deduce ethanol and water partition.
Fig. S2.
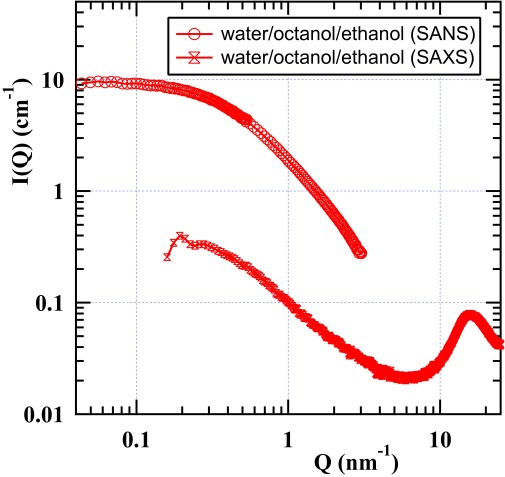
SANS (strong) and SWAXS (weak) scattering cross-sections per unit volume, I(Q), on the absolute scale for the sample containing, in volume fractions, 21% octanol, 44.7% ethanol, and 34.3% water in deuteration conditions, where only scattering produced by octanol is seen and ethanol–water are deuterated and contrast-matched.
Fig. S2 shows SANS and SAXS data on a log–log scale for the composition shown in Table S2. The OZ behavior (58)—equivalent to the Teubner–Strey expression with a vanishing Porod quadratic term (59)—represents well both the SANS and the SAXS data, with a volume-averaged correlation length of typical polydisperse isometric domains denoted as ξ.
Table S2.
Composition of the optically clear single-phase sample in mole (x), weight (ω), and volume (Φ) fractions compared with the values for the water- and oil-rich coexisting pseudophases in the same units as derived from SANS results (6)
| Fractions of the components in different units | Analytical composition, % | Ethanol fractions in the two pseudophases in different units | Ethanol fractions, % |
| 5 | 18 | ||
| 27 | 57 | ||
| 68 | |||
| 20 | 35 | ||
| 41 | 50 | ||
| 39 | |||
| 21 | 40 | ||
| 45 | 52 | ||
| 34 |
The SAXS and SANS spectra were adjusted using the simple OZ function as follows:
with being the volume fraction of water-rich domain, being the difference in scattering length density (SLD) between water- and oil-rich domains for the contrast P1, P2, or P3, and being the characteristic length of the SLD variation. To analyze the data, we consider that an x fraction of ethanol goes toward the water-rich domain as well as a z fraction of oil (here, the octanol), and finally, a y fraction of water is solubilized in the oil-rich domains.
Then, the for each contrast can be expanded as follows:
with O, A, and W indices for oil, alcohol and water, respectively, and π for the of the corresponding SLD for each component depending on the contrast used.
Then, the best adjustment of the three sets of experimental curves is given in Table S2. This adjustment is made in two steps considering, first, the decrease of the scattering curves to determine and then, the relative ratios of the extrapolated scattering intensities at Q→0 [and to determine SLD that allows one to go back to the various relative fractions in each domain]. After we get the set of (x, y, z, ) parameters, SAXS data can also be successfully adjusted.
Analyzing the wide-angle X-ray scattering patterns of pre-Ouzo solutions.
The examination of the wide-angle X-ray scattering (WAXS) pattern shown in Fig. S3 confirms the coexistence of octanol-rich domains. These octanol-rich aggregates and water-rich domains have distinct compositions that are given in volume, mass, and weight fractions in Table S2. They can be considered as coexisting pseudophases as introduced in the work by Tanford (20), and the equality in chemical potential for each molecular component exchanging between pseudophases is the fundamental point. Analysis of the gas phase gives access to the activities and therefore, the reference chemical potential of solutes as well.
Fig. S3.
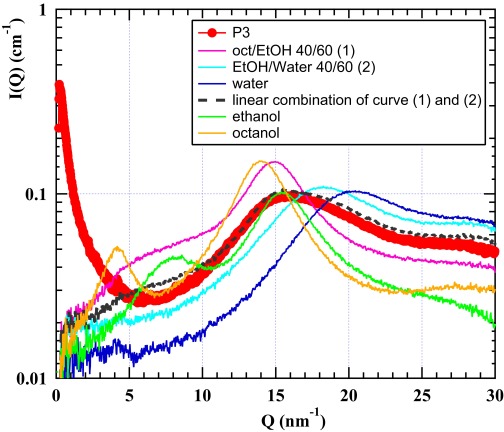
The WAXS part obtained from the sample P3 in linear scale (red) is shown, with the enlargement of the broad liquid band obtained at Q = 1.5 Å−1, compared with the scattering in the same region produced by the two pseudophases in equilibrium [mixture of ethanol and water with a volume fraction ratio of 40:60 (light blue) and mixture of octanol and ethanol with a volume fraction ratio of 40:60 (purple)] as well as from several pure solutions: pure water (blue), pure octanol (orange), and pure ethanol (green). The dotted black line represents a linear combination of both reference mixtures to adjust the SWAXS contribution of the surfactant-free microemulsion.
At low scattering vector Q, OZ-like decay without the common microemulsion peak is obtained in SANS regardless of the contrast. At high Q, a well-defined broad bump common to all alcoholic solutions originates from the collective contributions of oxygen atoms and hydrocarbon atoms in the region around 15 nm−1 (60).
As also shown in Fig. S3, at large angles, binary water-ethanol, ethanol-octanol, and the ternary solution containing pre-Ouzo aggregates have distinct scattering signatures. The peaks above 0.1 nm−1 can be interpreted as living polymers, with the 3D dynamic network of hydroxide belonging to alcohols or water (61, 62).
As can be seen in Fig. S3, the high Q pattern produced by the ternary fluid in that Q range can be reproduced by a linear combination of WAXS produced by the two coexisting binary fluids (i.e., octanol- and water-rich domains containing about 42% and 58% by volume of the ethanol, respectively). These binary solutions investigated by SAXS close to the end of the virtual tie line between the compositions of pseudophases in equilibrium are shown in Fig. 1. The coefficient in the linear combination is directly taken as the volume fraction of the octanol-rich phase (Table S2). Any other predictive model of pre-Ouzo aggregation should also predict this high Q additivity. To our knowledge, critical fluctuations in an unstructured ternary fluid would only be compatible with this WAXS additivity by numerical coincidences.
Fig. 1.
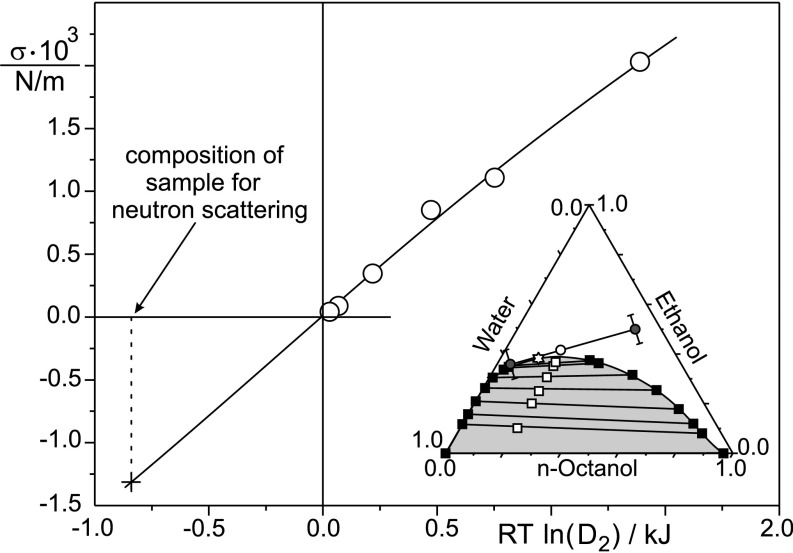
Experimental interfacial tensions-σ between octanol- and water-rich phases in the biphasic domain (46) for the samples shown by ■ in Inset with the extrapolation into the monophasic domain. (Inset) Ternary-phase diagram (weight %) of the model system water-ethanol-n-octanol-1, with (○) the location of the sample investigated by contrast variation in SANS, small-angle X-ray scattering/wide-angle X-ray scattering, and the critical point (☆). Pseudophases of compositions are shown on a pseudotie line. Data recorded at 25° C. RT, gas constant multiplied by temperature.
The position and width of the correlation peak at large Q values coincide in the scattering produced by these detergentless microemulsions and the one produced by the two fluids in dynamical equilibrium. It is highly significant that the linear combination of WAXS produced from fluids close to ends of the virtual tie line (shown in Fig. 1) is nearly fully superposed to the WAXS pattern produced by the sample in the pre-Ouzo region.
Comparing scattering experiments with molecular dynamics snapshots.
The main arguments developed in this work are based on thermodynamic arguments considering continuous solvents interactions beyond the first neighbor at the mesoscale. Molecular dynamics allow, however, comparison of experimental results with modeling at the supramolecular scale.
In the case of quaternary solutions containing molecules in oil-rich solution without micelles, nonisometric aggregates have been obtained by molecular dynamics and shown to be present by comparison of molecular dynamics snapshots and the their Fourier transform with SAXS or SWANS data, which was pioneered by Ferru and coworkers (63). A detailed evaluation of the preeminent mechanisms in the stability of aggregates has shown, in this oil-rich weak aggregation, a balance between steric stabilization and dipolar attraction responsible for the equilibrium sizes of aggregates present (58).
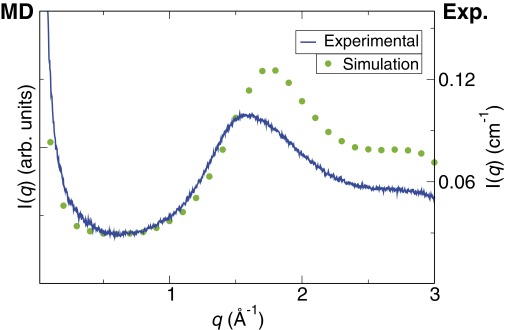
In the case study developed in this paper, the steric terms are negligible, because there is no long hydrocarbon chain, and the detergentless microemulsions are better described as “ultraflexible.” Molecular dynamics studies on pre-Ouzo aggregates have revealed a threshold in concentration for emergence of the aggregates (22) as well as an enrichment of the interface in ethanol (23). Fig. S4 illustrates how MD dynamics, with methodology as described in refs. 22 and 23, capture the broad peak at wide angle as well the OZ decay at low angle and the absence of detectable Porod-type asymptotic behavior in between SAXS and WAXS domains.
Fig. S4.
Comparison of the experimental X-ray scattering intensity (blue curve), which is also shown in Fig. S2, and the X-ray scattering intensity shown in refs. 22 and 23 for a system in the pre-Ouzo region calculated from the molecular dynamics trajectories (green points). The differences in the high q region are partly explained by the different compositions in the experiment and molecular dynamics simulations, but both low q regions, in which the presence of the pre-Ouzo aggregates is manifested, are in agreement.
Energetic Aspects.
Evaluation of the dispersion entropy and hydration force equilibria.
Our estimate of the dispersion entropy is based on the OZ spectrum measured by the scattering experiments. Microemulsions composed of isotropic aggregates are best described by Gaussian random fields (64, 65). Using accurate analytical approximations for the curvatures and entropy, the spectrum of the random fields can be varied to minimize the free energy. Alcoholic solutions are structured and also show structuration in the WAXS region (60).
The most disordered density distribution consistent with our scattering results is a random Gaussian field with the OZ spectrum. A level cut of the random Gaussian field produces a disordered system of surfaces. As long as the level cut is performed near the field value of zero (the volume of oil- and water-rich phases is similar), the same expression for entropy applies to the surface distribution (37, 38). The entropy evaluated below applies, therefore, to both sharp and diffuse surfaces and depends only on the OZ correlation length-ξ.
The OZ spectrum is
and the entropy is
To obtain numerical values, we need to select the short wavelength cutoff λmin = 2π/kc. If we assume that the system does not support variations on the length scale smaller than the correlation length-ξ, we obtain kc = 2π/ξ. In experiments, ξ is 1.8 nm, and 2π/ξ = 3.5 nm−1. Qualitative conclusions do not depend on exact values taken for cutoffs as long as the solvation effects are strong enough to prevent the pre-Ouzo phase from collapsing into a molecular solution. OZ spectral behavior in scattering ends at kc = 4 nm−1, and therefore, the choice for kc is consistent with the data (64).
An alternative estimate of the configuration entropy may be obtained from hard sphere fluid with a given sphere radius and a total volume matching the experimental data. We approximated the entropy using the ideal gas with the Carnahan–Starling correction formula. The variation of entropy of the hard sphere fluid is very similar to the one found on the basis of random Gaussian fields, but the absolute values are an order of magnitude smaller. This difference reflects much higher-order hard sphere fluid compared with the polydisperse OZ random Gaussian field.
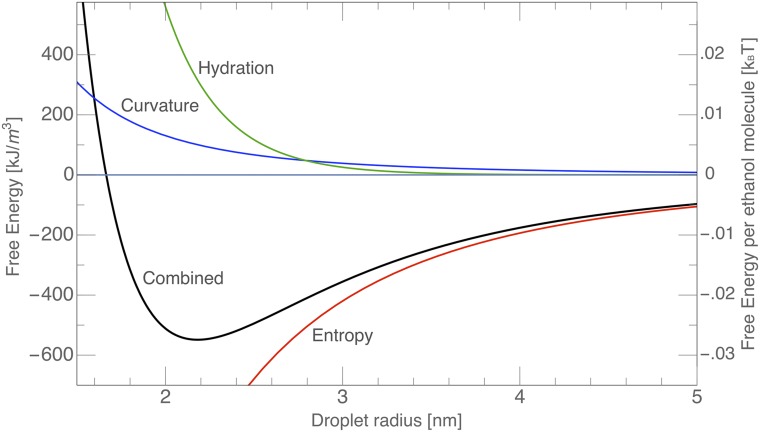
Lower-limit estimate of the entropy from the hard sphere model together with a weaker hydration force lead to an alternative figure for the free energy minimum in the pre-Ouzo state (Fig. S5). The free energy minimum of the order of 500 kJ/m3 is more consistent with the easy transition to the two-phase Ouzo state under ultracentrifugation.
Fig. S5.
Same as Fig. 4 but with the hard sphere fluid estimate of the entropy and the hydration force parameters of Πhydration = 1.5 × 10⁹ Pa and λ = 0.25 nm. It includes an upper value maximum hypothetic influence of curvature energy if the ethanol would be acting as a surface active polymer with a given hydrophilie-lipophile balance (HLB).
The hydration force contribution was obtained using the surface area of the level-cut Gaussian random field (59, 65):
A/v is the area per unit volume, and α is the value of the field at the level cut taken here as −0.3 to reproduce the oil-rich volume fraction of 0.37. The average surface separation is given as a volume fraction of the water-rich phase divided by the surface area.
In the model of hard spheres, the contribution of the free energy from hydration-repulsive pressure can be obtained in a similar manner, because the amount of surface per unit volume of sample directly depends on the radius of average nanodomains.
Why the bending free energy can be neglected in the case of pre-Ouzo aggregate when the cosolvent is the main component of the interfacial film.
The bending free energy of the interface between octanol-rich domains and water-rich domains per unit surface is classically taken as
where Σv is the total interface between octanol- and water-rich domains, and the effective packing p is a function of the persistence length; p0 is the spontaneous curvature, a scalar associated with any interfacial film. This expression with one single parameter related to stiffness k* is consistent with “untearable” fluid films (66) rather than the more complex Helfrich expression involving two bending constants. Because the constants depend on the third power of the interfacial thickness and because the typical value of k* for C12 chains is less than 0.5 kBT, we estimate k* in the case of octanol–ethanol to be k* ≤ 0.1 kBT.
The bending term contributing to the free energy balance is the free energy of the interfacial surfactant film associated with bending of the mixed film that covers and belongs to the octanol-rich domains, with a typical octanol:ethanol ratio of 1:5 in this study. This term, expressed as a surface integral, is recalled just for generality, because detergentless microemulsions contain no component forming either flexible or rigid monomolecular films (67, 68). In the octanol–ethanol formulation, it should be zero. However, a term associated with film bending favors the sizes of microemulsion domains for which the curvature radii are close to spontaneous curvature, like in any microemulsion, assuming that spontaneous packing parameter is close to one and that the bending constant k* is much less than 0.1 in reduced units. In the case of detergentless microemulsions, converting flexibilities into kilojoules per mole is difficult, because only a small fraction of the ethanol present in the sample constitutes the interfacial film separating water- and octanol-rich domains. Because of the low values of bending rigidities, this type of microstructures could well be described as ultraflexible microemulsions.
Minimizing the free energy vs. equilibrium correlation length-ξ.
The total free energy associated with local segregation into two pseudophases in dynamic equilibrium is the sum of four terms. The free energy in the single-phase pre-Ouzo region now stands:
The opposing “forces” compensating at equilibrium are derivatives of the free energy vs. the length scale-ξ. The two-phase system disperses until the equilibrium is reached, and consequently, the free energy has a minimum.
Neglecting minor terms, the balance of the dominating entropy vs. hydration stands as
This expression replaces the standard van der Waals vs. electrostatics equilibrium (DLVO) for uncharged systems in the absence of steric repulsion (because of protruding macromolecules for instance). To evaluate numerically these four contributions to the free energy as a function of the length scale-ξ, we need to know some intensive properties at the mesoscale. In calculating the solvation term, we assumed a contact pressure of 1.5⋅1010 Pa and a decay length of 0.27 nm. The calculation of the mixing entropy depends only on the length scale-ξ and does not require any other parameters.
For the minor terms, we assumed
a conservative upper limit of the Hamaker constant involved in van der Waals interactions to be 0.1 kBT, because optical contrast is reduced by ethanol with a partition coefficient close to 1.
a conservative upper bound of the bending constant of 0.1 kBT, because bending constants are close to 1 kBT for C12 chains. The bending constants scale like the cube of the “film thickness” and are reduced in the presence of short-chain alcohols; therefore, the real value is certainly below that value.
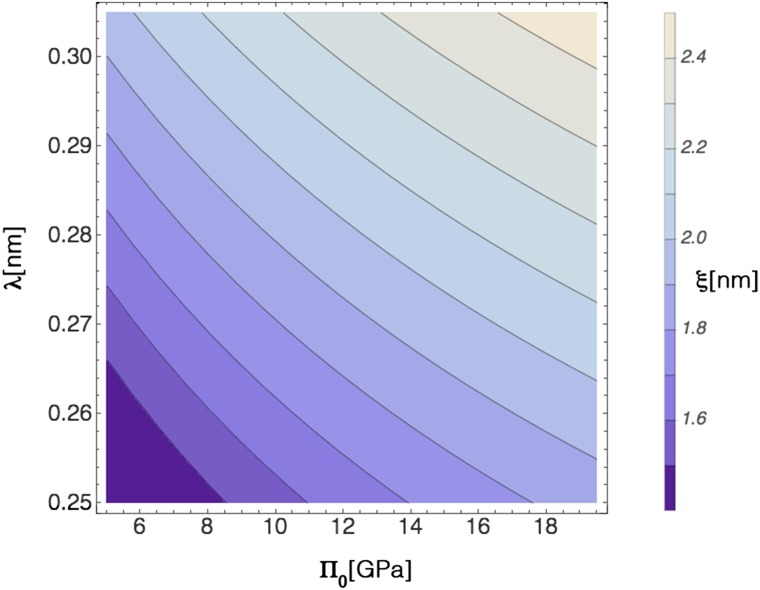
Relation between the domain size-ξ, the hydration pressure Πhydration, and the corresponding decay length-λ.
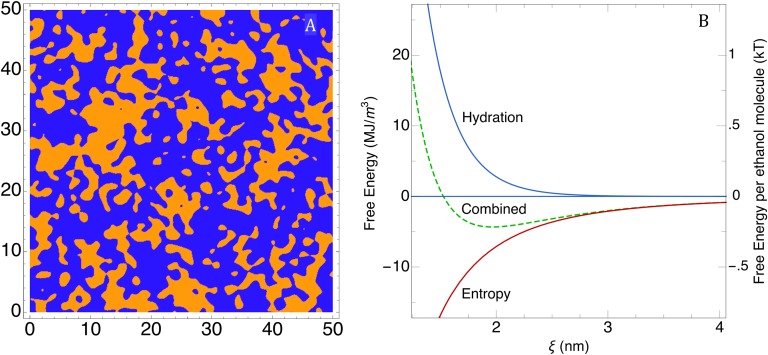
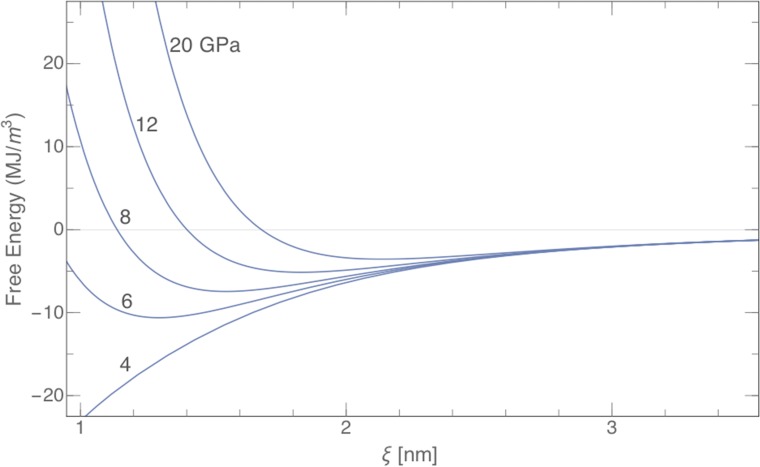
In Fig. 4, the total free energy per unit volume of sample and the free energy per ethanol molecule are given as functions of the domain size. For the selected contact pressure and the decay length, the total curve exhibits a minimum reflecting the considered ternary system 1-octanol-ethanol-water. However, for small hydration pressures and short decay lengths, the minimum can vanish, as can be seen in Fig. S6. This is seen, for example, when the number density of water molecules in the interfacial layer between the oil- and water-rich domains is low. Obviously, the vanishing of the minimum happens for the octane and toluene systems shown in Fig. 5 and explains the ubiquity of the phenomenon, well beyond the ternary system studied in detail here with octanol and water as nonmiscible fluids at the origin of this microemulsion system. To our knowledge, in all available experimental results, the decay length of the hydration force has always been in the range 0.23 ± 0.03 nm.
Fig. 4.
(A) A snapshot of the real space representation with a cutoff wavelength of 1.8 nm (edge length of 50 nm). (B) Total free energy per unit volume of sample (left scale) and free energy per ethanol molecule (right scale) vs. the correlation length-ξ (nanometers) Also shown is the hydration (solvation) force contribution (evaluated using Πhydration = 1.5⋅1010 Pa and λ = 0.27 nm).
Fig. S6.
Map of hydration force decay length-λ and hydration pressure Π0: the domain size expected from entropy–hydration competition is 2–4 nm, a typical size that was encountered in all different ternary systems showing the pre-Ouzo effect. In the lower left-hand corner, there is no minimum in the free energy, and aggregates do not form.
Fig. 5.
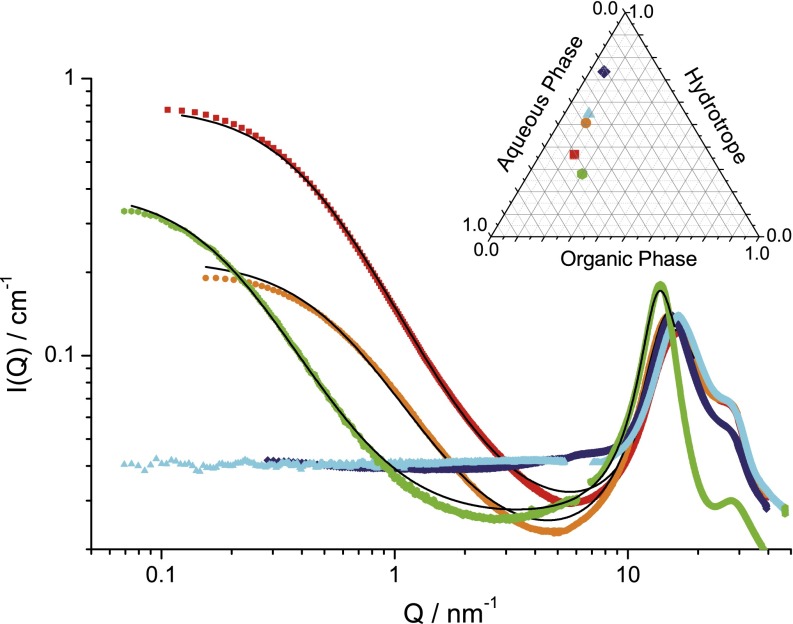
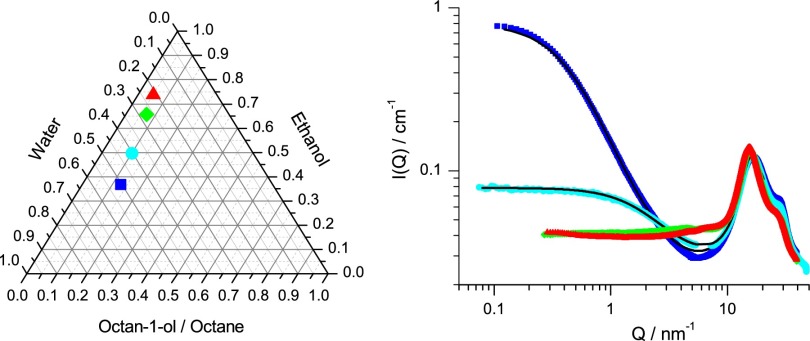
Five different ternary systems presenting pre-Ouzo structuration and the corresponding SWAXS spectra of different ternary mixtures. Dark blue, toluene/ethanol/water; green, 1-octanol/ethanol/water (ξ = 2.1 nm); light blue, octane/ethanol/water; orange, 2-octanol/1,5-pentanediol/water (ξ = 1.5 nm); red, m-cresol (3-methylphenol)/ethanol/water (ξ = 4.9 nm).
Quenching Aggregation by Control of Surface OH Density.
The SWAXS experiments were performed at Argonne National Laboratory (ANL) (X9 SAXS/WAXS beamline) following the methodology described by Diat et al. (2). Before fitting to the OZ equation, the flat background and the WAXS peak were subtracted, assuming an asymptotic Q−2 behavior of the octanol-rich aggregates. The results are shown in Fig. S7.
Fig. S7.
A graph in analogy to Fig. 4 but for different hydration pressures and a given decay length of 0.27 nm. With increasing pressures, the minima are shifted to higher ξ-values [compare with Fig. 5, sample 5 (i.e., the cresol system)] and progressively vanish. By contrast, with decreasing pressure, the minimum is shifted down to molecular dimensions, and there is a weak progressive transformation toward unstructured ternary fluids; The minimum corresponding to surfactant-free microemulsions appears at the “Lifshitz line” (65, 66), when hydration pressure is strong enough as tested by using octane/octanol as a mixed model solvent.
Two important characteristics appear: pre-Ouzo aggregates are only formed when sufficient numbers of OH groups are present and when the concentration of ethanol is not too high. The first condition relates to the contact pressure caused by the hydration force, whereas the second one reflects the structuring of the two immiscible phases by ethanol. It is well-known that both binary mixtures ethanol–water and wet octanol are structured fluids that can be described as 3D networks of connected OH groups, which can be deduced from multimode concentration-dependent broad peaks appearing in Q space (61, 69). If we compare these results with the theoretical expectations, we can conclude that, at contact hydration pressures lower than gigapascals, ξ is only of the order of molecular dimensions, and pre-Ouzo aggregates do not form. Insufficient hydration pressure is likely the situation with pure octane. By contrast, when the threshold in hydration pressure is exceeded, pre-Ouzo aggregates form, and the observed ξ-values are in the range of 2–3 nm, consistent with the location of the free energy minimum in the balance between the entropy and hydration. The variations in the free energy involved are still lower than the interfacial bending free energy of classical microemulsions as well as the free energy of pure octanol/ethanol-based ultra-flexible microemulsion (UFME) (estimated to be in the range of 1–10 or 0.01–0.1 kBT, respectively). Similar to this case, UFME with flexibility in the intermediary range has also been described and is based on propanol as a surfactant, with oleic acid ensuring high carboxylate group surface density of the pre-Ouzo aggregates (54).
We now compare the results with those of the earlier studies by Strey and coworkers (70) and Gradzielski et al. (71) on microemulsions consisting of water, oil, and a short-chain surfactant. The scattering pattern also seems to be OZ-like, and the Porod Q−4 term in the scattering is gradually decreasing when the surfactant becomes progressively weaker. However, the short-chain alkylethylenglycol ethers CiEj used are the main component of the film between water and oil. As a result, the interfacial curvature term is competing with entropy and determines the typical “droplet” size observed in stiff or rigid microemulsions. Note that, in contrast to ethanol, these hydrotropes short CiEj may form micelles and liquid crystalline phases in binary aqueous solutions. In all pre-Ouzo systems studied, the hydrotropic cosolvent is distributed in the two pseudophases present and only slightly accumulates at the interface, as can be seen in Fig. 2.
Fig. 2.
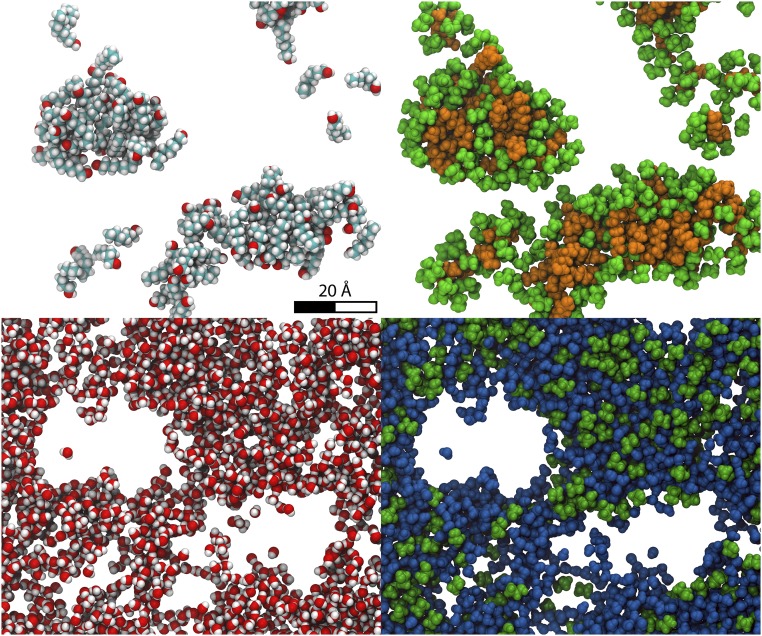
Snapshots from molecular dynamics (22) in the single-phase pre-Ouzo region (octanol weight fraction xE = 0.2; water weight fraction xW = 0.8). (Upper Left) Only the octanol molecules are shown. (Upper Right) The ethanol molecules that interact strongly with the octanol molecules are shown in green. (Lower Left) Only the water molecules are shown, showing the morphology of the water-rich “external” aqueous pseudophase. (Lower Right) The same snapshot with water molecules represented together with the ethanol molecules partitioned in the water-rich phase. Each slice is 1.5-nm thick.
Experimental Results on the Water-Ethanol-n-Octanol System
The phase diagram of the water-ethanol-n-octanol system is shown in Fig. 1, which also shows the composition for which SANS and SWAXS have been performed (2). (SI Materials and Methods, Scattering Data and Interpretation). The partition of ethanol between the two coexisting pseudophases, as inferred from neutron scattering, is also given in SI Materials and Methods, Scattering Data and Interpretation (Table S2). The end points of the virtual tie lines representing the two compositions coexisting at the nanometer scale are shown as a virtual tie line in Fig. 1. In the two-phase region, we relate the interfacial tension between octanol-rich and water-rich phases with an evaluation of the reference free energy of transfer per ethanol molecule from the water- to octanol-rich phase (Fig. 1). Because in the single-phase pre-Ouzo domain, the compositions of the two coexisting pseudophases have been determined by neutron scattering, the abscissae of the corresponding data points are known. At compositions containing a smaller percentage of cosolvent (here ethanol) than the translucid sample studied, the sample appears “cloudy,” and pronounced light scattering known as “haze” in chemical engineering is always detected. Extrapolation as a straight line would, for the single-phase pre-Ouzo domain, give a negative surface tension of 1 mN/m, which is shown as a data point in Fig. 1. All surface tensions in Fig. 1 are reported as a function of the molar distribution coefficient D2 of ethanol, which is defined as the ratio of the molarities of ethanol in water- and octanol-rich phases (18). The x coordinate in Fig. 1 is an estimate of the difference of the solvation free energies of ethanol in water- and oil-rich coexisting phases. As expected, close to the critical point, surface tension vanishes: at that stage, the critical fluctuation between pre-Ouzo aggregates—and not dispersed octanol molecules—is the dominant phenomenon. Vanishing of surface tension is also observed with classical microemulsions (19).
For the composition given in Table S2, assuming a maximum density of 5 OH groups per 1 nm2 at the interface between the aqueous and octanol pseudophases and using known partial molar volumes, we infer that the octanol-rich aggregates are composed of 80 octanol and 350 ethanol molecules. The water-rich domains have a composition close to 60/40/0 wt/wt/wt in water/ethanol/octanol, whereas for the octanol-rich domains, the composition is 10/50/40 wt/wt/wt in water/ethanol/octanol. The “internal” volume fraction of octanol-rich domains is 55% (SI Materials and Methods, General features of SANS and small-angle X-ray scattering patterns). The SANS experiments show the presence of polydisperse octanol-rich globular domains surrounded by water-rich domains, which can be considered as pseudophases (20). The octanol-rich domains are in thermodynamic equilibrium and separated by a surface film, which contains a slight accumulation of ethanol molecules at the interface (21) as also suggested by molecular dynamics (MD) simulations (22). This microstructure corresponds to the IUPAC definition of microemulsions, because two immiscible fluids are separated by an interface, which in the case described here, is a nanometer-thick diffuse film composed mainly of ethanol (23). However, no “Porod limit” or broad peak characteristic of classical microemulsions is observed (24, 25).
In Fig. 2, we illustrate the features of the weak structuration with the snapshots of an MD structure in the pre-Ouzo region. Octanol-rich domains typically have a radius of about 2 nm, and the interface has a slightly enhanced concentration of ethanol. The phase behavior and the density fluctuations visible in the figures are reminiscent of critical fluctuations in ternary fluids, which also produce Ornstein–Zernike (OZ) scattering functions and diverging scattering intensities near the critical point. Comparison between expected scattering by Fourier transformation of real molecular coordinates is discussed in SI Materials and Methods, Scattering Data and Interpretation and shown in Fig. S4.
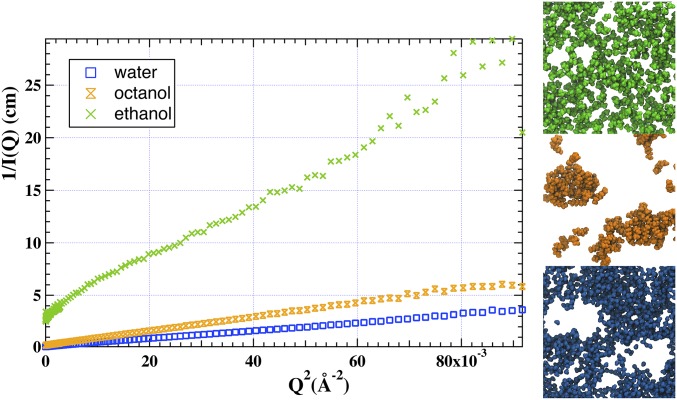
However, there is a subtle distinction between the critical fluctuations in a ternary molecular fluid and the emerging pre-Ouzo aggregates. Close to a critical point, diverging intensities of static light scattering at low angles are measured, and this divergence is also the case in this ternary system (26). However, in critical fluctuations of an unstructured ternary fluid, fluctuations are featureless changes in molecular concentrations. By contrast, in this case, the hydrotropic nature of ethanol favors the formation of interfaces, and near the critical point, the fluctuations are formed by well-defined aggregates alternating between oil-rich and -poor domains as shown qualitatively by light scattering studies. To interpret SANS at different contrasts, we use the inverse scattering intensity vs. square of scattering vector: the crucial result is shown in Fig. 3. The length scales corresponding to the results are 1.8 nm for the aggregates, 2.1 nm for the “holes” in water-rich solvent, and 1.2 nm for the ethanol-rich interface (Fig. 3). Critical points between aggregates of different morphologies not corresponding to molecular fluctuations have also been described for nonionic micellar systems (27, 28).
Fig. 3.
(Left) Scattering intensity I(q) in OZ representation of the same sample with (Right) three different contrasts: (Top Right) ethanol only (green), (Middle Right) octanol only (orange), and (Bottom Right) water only (blue). The steepest slope is caused by a diffuse layer about 1.2-nm thick. The molecular dynamics (slice is 1.5-nm thick) show the molecules as seen by each specific labeling experiment.
Hydration Vs. Entropy Balance
In the previous section, we have shown that, in the pre-Ouzo region near the miscibility gap in the ternary system studied, polydisperse globular transient aggregates with no sharp interface are in dynamic equilibrium. The coexistence of two pseudophases in equilibrium, one octanol-rich and one water-rich, requires that this microstructure corresponds to a free energy minimum. Using the equation of state approach, equivalent to the balance of forces as introduced by Parsegian and coworkers (29) in the case of lipids, the derivative of the free energy vs. correlation length should be zero at equilibrium: any decrease or any increase in average size costs overall free energy. To determine the equation of state, classically, van der Waals vs. electrostatics is considered by DLVO, with entropic terms caused by fluctuations of diluted flexible bilayers considered as thin solids introduced by Helfrich (30) and extended to flexible microemulsions with vanishing interfacial film thickness by Andelman and coworkers (31).
In the case of classical micelles and microemulsions containing at least one surfactant with a well-defined head group “bound” to the oil–water interface, the volume of micelle and microemulsion droplet is controlled by the area per molecule at the interface (as well as topology) (32–34). The free energy of micelle formation vs. the area per surfactant molecule (the lateral equation of state) is a function with a deep minimum (35). This minimum of the free energy varies with the average pseudophase interfacial area per surfactant and controls the micellar volume (36). However, in this case, we have neither electrostatic repulsion nor surfactants bound to the interface and controlling the oil/water-specific surface. Note that octanol does not play the role of a surfactant here, because the interface is enriched in ethanol.
Therefore, the main questions are:
In the absence of electrostatic repulsion, what prevents water-rich as well as octanol-rich nanodomains from coalescence?
What kind of force balance determines the size of these microemulsions?
To obtain insight into the stability of the pre-Ouzo phase, we model the key contributions to the free energy with the structure obtained by a level cut of a random Gaussian field with the OZ spectrum (37, 38). This structure (Fig. 4A) is consistent with the scattering spectrum and morphologically similar to the simulation results (Fig. 2), although the interfaces of the domains are unrealistically sharp. Because our purpose is to illustrate the physical principles behind the observed results, the resulting semiquantitative model is, nevertheless, indicative of the force balance responsible for the stability of these microemulsions that we introduce (for the first time to our knowledge) in this work. Within the model, we look at possible contributions to the free energy:
Mixing Entropy Contribution.
The major influence determining the system structure is the entropy of the dispersion. It always drives the system toward smaller domains (i.e., more mixing between the phases). In the monophasic domain, close to phase separation, molecules are not randomly dispersed, and the free energy minimum is obtained for an optimal-length scale of the dynamic clusters. In the case of standard microemulsions, Gaussian random field entropy together with the bending elasticity explained the formation of different bicontinuous microstructures (37, 39). A Gaussian random field with the same OZ spectrum as observed in the experiments results in the maximally disordered configuration (and hence, the highest entropy) consistent with the data. Alternatively, the more ordered matched hard sphere fluid gives the lower bound for the entropy (SI Materials and Methods, Energetic Aspects).
Free Energy of Hydration.
The contribution to the free energy resulting from the hydration force between surfaces could be positive or negative, depending on the details of the water structure surrounding ethanol clusters. In the case of hydrophilic surfaces that induce solvent orientation, the interaction is normally repulsive, and the associated free energy is the integral of the hydration pressure
where λ is the decay length associated with the hydration (40). The contact pressure Π0 depends on the binding and positioning of water and ethanol molecules at the interface. The average thickness h of water-rich slabs is obtained using the surface to volume ratio of the leveled Gaussian random field (41). Alternatively, h can be estimated by the tessellation of facetted polyhedrons (42), leading to a similar result: h is close to 1.5 nm for the sample described in Table S2.
The hydration force is significant near the interface, even in the absence of salts (43, 44). The results are consistent with the Marčelja–Radić approach: a structured layer of solvent, with an experimental decay of an order parameter and a slight excess of ethanol at the interface, produces a net repulsion of the aggregates (45).
van der Waals Contribution.
The van der Waals term is associated with attractive dispersion forces between octanol-rich domains. Using the average thickness of water domains h mentioned above and the Hamaker constant of the order of 10−1–10−2 kBT, we find that the van der Waals term is negligibly small: at least two to three orders of magnitude smaller than the two other terms.
The equation used for the energy minimization is given in SI Materials and Methods, Energetic Aspects. In Fig. 4B, we illustrate the contributions from the hydration force (Πhydration = 1.5 × 10¹⁰ Pa and λ = 0.27 nm), the entropy contribution to the free energy, and the sum of the two terms expressed as the free energy per unit volume of the sample or the free energy per ethanol molecule present in the sample. The free energy of transfer of ethanol molecules between macroscopic “bulk” octanol and water phase is typically 20 times higher than this value (46). In our view, the small difference explains why pre-Ouzo microemulsion domain thermodynamics have not been evaluated before. Also, nontrivial evaporation paths are observed from the pre-Ouzo region: the paradox is that evaporation does not follow volatility of components (47). It can be expected that similar values of the hydrotrope transfer energy will be obtained in the case of diols and any type of water-insoluble but alcohol-soluble fluids that also form microemulsions. A shallow minimum for droplet sizes around 2 nm allows the formation of a polydisperse microdomain solution. Using the left-hand scale in Fig. 4B, the order of magnitude of the free energy minimum relative to the phase-separated state (when the contributions considered here vanish) is consistent with 5,000 kJ/m3 (i.e., of the order of 0.2 kBT per ethanol molecule), which is even lower than the cost in enthalpy of transfer of one ethanol molecule from octanol to binary water–ethanol bulk. Nevertheless, such a low energy is sufficient to ensure activities of enzymes that require the presence of a defined oil–water interface (48).
It is quite remarkable that a shallow minimum exists for a typical size of 2–3 nm dominated by a competition between entropy of mixing and hydration energy (i.e., the solvation energy of the octanol-rich aggregates). We note that taking into account only mixing entropy and bending energy while fixing the area per molecule corresponds to the de Gennes–Taupin expression for the free energy. Moreover, it is known that surfactants with large head groups and intermediary chains produce a broad bump in scattering in binary solutions, even at less than 20% vol water. The introduction of the repulsive hydration term also provides the explanation for scattering of concentrated microemulsions containing nonionic surfactants. Because the minimum is shallow, micelles fluctuate in volume, and the mass distribution is extremely broad: the common broad peak in scattering of microemulsions is not observed (49). Although the average lifetime of microemulsion domains is presently not experimentally determined, the thermodynamic model is valid independent of the lifetimes of the aggregates (50).
The free energy minimization as derived quantitatively in SI Materials and Methods, Energetic Aspects unifies the description of the surfactant-free and surfactant-containing microemulsions. The electrostatics or steric-repulsive vs. van der Waals attraction balance valid for classical micellar systems has to be replaced by the hydration vs. entropy balance in the case of hydrotrope-based microemulsions.
The model proposed here is analogous to the classical DLVO approach in the sense that the electrostatic repulsion caused by charged surfactant head groups is replaced by short-ranged but nevertheless, significant repulsion because of to the ordering of water near the interface and a much less pronounced, Gouy–Chapman-like ethanol concentration profile. The resulting hydration force is basically caused by the high OH surface density at the interface as shown in Fig. 2.
Moreover, the “thickness” of the water-rich domains corresponds to typically four layers of water when considered within the frame of water ordering as the key parameter of the hydration force. The thickness of the interfacial phase, slightly enriched in ethanol, is here close to one-half of the radius of microemulsion domains. The concept of diffuse counterion layers is, therefore, extended from electrolytes (within the Poisson–Boltzmann theory) to partially adsorbed nonelectrolytes, such as ethanol acting as a hydrotrope. To do so, the Marčelja–Radić theory for hydration forces in pure water (45) must be extended to binary solvents much as it has been extended to the case of concentrated counterion layers in the work by Mitlin and Sharma (51).
It should be noted that there is no geometrical constraint on the fluctuating interface, and therefore, influences of curvature may be present but are not responsible for the observed microdomain formation. As mentioned before, our approach is further supported by recent sophisticated molecular dynamics simulations shown in Fig. 2 that are in agreement with the scattering results.
With increasing ethanol concentration, the microdomains progressively vanish, and the mixture becomes mainly a structureless molecular solution (22). Hydration vs. van der Waals balance may also contribute to the stability of emulsion droplets in the Ouzo regime. However, the competition between these two forces alone does not explain the Ouzo effect or the surprising stability of stable fine emulsions without surfactant (52, 53), where other phenomena may be predominant. Finally, it is interesting to notice the absence of lyotropic phases in the pre-Ouzo region in agreement with the general knowledge about hydrotropes (12).
Ubiquity of the Entropy–Hydration Balance in Ternary Systems
We stress that neither the Ouzo effect nor the pre-Ouzo effect discussed here is restricted to ethanol (SI Materials and Methods, Scattering Data and Interpretation). Although we considered only one particular system for our detailed SANS/small-angle X-ray scattering/wide-angle X-ray scattering study, on the basis of the agreement with the light scattering results, we are confident that the dynamic light scattering/static light scattering results of many other ternary systems hint at a similar structuring and mechanism (Fig. 5). For example, DMSO, acetonitrile, and other solvents can also play the role of the second water-miscible solvent or hydrotrope (13). Even water can be replaced by glycerol and other solvents, such as ionic liquids and deep eutectics. As stated in the introduction, it seems that the only criterion is that two nonmiscible or only slightly miscible liquids are made compatible by a third one. Solvation vs. entropy plus van der Waals probably is responsible for microdomain formation in perfumes, beverages, pharmaceutical formulations, etc. (9).
To further check the generality of the pre-Ouzo structuring phenomenon and our generalized DLVO approach, we have chosen five other ternary systems near the miscibility gap (Fig. 5). For comparison, the scattering curve of 1-octanol/ethanol/water is also included. In the case where a pre-Ouzo structuring is detected, the characteristic size of the domain, ξ, is indicated. As can be seen in Fig. 5, three samples show a visible structuration at high Q values coexisting with OZ-like scattering at low Q. The “surfactant” enriched in the interface is for either ethanol or 1,5-pentanediol. These sizes are those expected for a reasonable decay of hydration forces as well as contact pressures (SI Materials and Methods, Energetic Aspects). In the cases of octane and toluene, no pre-Ouzo structuring as revealed by low Q scattering is observed. Obviously, the ethanol concentration required to get monophasic mixtures is too high, and OZ-like signal can no longer be detected. This behavior is in agreement with our theory, which is further detailed in SI Materials and Methods, Energetic Aspects. Nevertheless, the range in volume fraction of ethanol at which the pre-Ouzo effect is still present depends on the particular system. Octane does not produce any pre-Ouzo microemulsion, because it does not form high surface density of OH groups. At a very similar composition, the octanol-1,5-pentandiol-water ternary system has a high hydroxyl surface density, hence developing a repulsive hydration interaction.
To further investigate this point, the system octane-ethanol-water was chosen as the starting point, and 1-octanol was gradually replaced by octane. As we describe in SI Materials and Methods, Quenching Aggregation by Control of Surface OH Density, the pre-Ouzo structuration disappears below a certain octanol content, in line with predictions from theory (Fig. S8). In all systems exhibiting pre-Ouzo structuration described until now, the bending energy term can be completely neglected compared with the solvation effects, resulting in polydisperse aggregates (SI Materials and Methods, Quenching Aggregation by Control of Surface OH Density). The opposite situation may occur, because highly curved microstructures have been observed very recently by freeze fracture EM in surfactant-free microemulsions, where octanol is replaced by oleic acid (54). Finally, we want to point out that a significant amount of ethanol and even water is solubilized in oil microdomains. This behavior is in analogy to the type of micelles postulated by Menger and Doll (55) and has also be mentioned in the works by Winsor (56) and Lindau (57), which noticed the relation between structuration in detergentless microemulsions and eutectics. Because of the negligible influence of surfactant film bending energy and the ambiguities in the names detergentless or surfactant-free as well as pre-Ouzo or “mesoscopic solubilization,” we propose here to designate these ubiquitous dynamically stable microstructures as “ultraflexible microemulsions,” in contrast to the two previously known types: stiff and flexible microemulsions (1).
Fig. S8.
SWAXS scattering of mixtures of ethanol and water with pure octane, pure 1-octanol, and two mixtures of octane and 1-octanol in the indicated molar ratios. The locations of the points investigated are shown on the phase triangle in Inset, which considers octane/octanol as a pseudocomponent. The ternary-phase diagram gives the composition of the (pseudo)ternary mixtures in volume fractions. All compositions investigated with mixed octane/octanol were chosen to be close to the phase boundaries along a dilution line with ethanol: these experiments show that the presence of surface OH groups is required to obtain a sufficiently strong hydration force, forming a minimum in the free energy and aggregates of typically 100 molecules.
Materials and Methods
The phase diagrams and light scattering experiments were established according to the same methods as in the work in ref. 9 and SI Materials and Methods. The SWAXS and SANS were performed as in the work in ref. 2 and SI Materials and Methods. The surface tensions were determined using a standard spinning drop tensiometer (Krüss Gmbh). The use of Gaussian random fields in modeling is detailed in SI Materials and Methods.
Acknowledgments
We thank Dr. Roland Neueder for the careful preparation of several figures, and Bruno Corso for technical help in small-angle high-resolution X-ray scattering (SWAXS). We also thank L’Oréal and Firmenich Research Departments for constant interest in this work. T.N.Z. acknowledges European Research Council project “Rare earth recycling with low harmful emissions” (REE-CYCLE) 320915, and W.K. acknowledges the support of Laboratory Chemisyst ANR 11-01-05. Laboratoire International Associé (LIA) between CNRS within Institut National de Chimie (INC) provided support to T.L. The COST Action CM1101 supported S.M.
Footnotes
The authors declare no conflict of interest.
This article is a PNAS Direct Submission.
This article contains supporting information online at www.pnas.org/lookup/suppl/doi:10.1073/pnas.1515708113/-/DCSupplemental.
References
- 1.Chevalier Y, Zemb T. The structure of micelles and microemulsions. Rep Prog Phys. 1999;53(3):279–371. [Google Scholar]
- 2.Diat O, et al. Octanol-rich and water-rich domains in dynamic equilibrium in the pre-ouzo region of ternary systems containing a hydrotrope. J Appl Crystallogr. 2013;46(6):1665–1669. [Google Scholar]
- 3.Marcus J, Klossek ML, Touraud D, Kunz W. Nano-droplet formation in fragrance tinctures. Flavour Fragr J. 2013;28(5):294–299. [Google Scholar]
- 4.Vitale SA, Katz JL. Liquid droplet dispersions formed by homogeneous liquid-liquid nucleation: “The ouzo effect.”. Langmuir. 2003;19(10):4105–4110. [Google Scholar]
- 5.Lu Z, Xu H, Zeng H, Zhang X. Solvent Effects on the Formation of Surface Nanodroplets by Solvent Exchange. Langmuir. 2015;31(44):12120–12125. doi: 10.1021/acs.langmuir.5b03303. [DOI] [PubMed] [Google Scholar]
- 6.Shinoda K, Kunieda H. Conditions to produce so-called microemulsions: Factors to increase the mutual solubility of oil and water by solubilizer. J Colloid Interface Sci. 1973;42(2):381–387. [Google Scholar]
- 7.Smith GD, Donelan CE, Barden RE. Oil-continuous microemulsions composed of hexane, water, and 2-propanol. J Colloid Interface Sci. 1977;60(3):488–496. [Google Scholar]
- 8.Keiser BA, Varie D, Barden RE, Holt SL. Detergentless water/oil microemulsions composed of hexane, water and 2-propanol. J Phys Chem. 1979;83(10):1276–1281. [Google Scholar]
- 9.Klossek ML, Touraud D, Kunz W. Eco-solvents--cluster-formation, surfactantless microemulsions and facilitated hydrotropy. Phys Chem Phys. 2013;15(26):10971–10977. doi: 10.1039/c3cp50636c. [DOI] [PubMed] [Google Scholar]
- 10.Arce A, Blanco A, Soto A, Vidal I. Densities, refractive indices, and excess molar volumes of the ternary systems water + methanol + 1-octanol and water + ethanol + 1-octanol and their binary mixtures at 298.15 K. J Chem Eng Data. 1993;39(2):378–380. [Google Scholar]
- 11.Wennerström H, Lindman B. Physical chemistry of surfactant association. Phys Rep. 1979;52(1):1–86. [Google Scholar]
- 12.Friberg S. Microemulsions, hydrotropic solutions and emulsions, a question of phase equilibria. J Am Oil Chem Soc. 1971;48(10):578–588. [Google Scholar]
- 13.Hodgdon TK, Kaler EW. Hydrotropic solutions. Curr Opin Colloid Interface Sci. 2007;12(3):121–128. [Google Scholar]
- 14.Dixit S, Crain J, Poon WC, Finney JL, Soper AK. Molecular segregation observed in a concentrated alcohol-water solution. Nature. 2002;416(6883):829–832. doi: 10.1038/416829a. [DOI] [PubMed] [Google Scholar]
- 15.Khmelnitsky YL, Hilhorst R, Veeger C. Detergentless microemulsions as media for enzymatic reactions. Cholesterol oxidation catalyzed by cholesterol oxidase. Eur J Biochem. 1988;176(2):265–271. doi: 10.1111/j.1432-1033.1988.tb14277.x. [DOI] [PubMed] [Google Scholar]
- 16.Ivanov DA, Winkelmann J. Multiexponential decay autocorrelation function in dynamic light scattering in near-critical ternary liquid mixture. J Chem Phys. 2006;125(10):104507. doi: 10.1063/1.2338312. [DOI] [PubMed] [Google Scholar]
- 17.Corti M, Degiorgio V. Quasi-elastic light scattering study of intermicellarinteractions in aqueous sodium dodecyl sulfate solutions. J Phys Chem. 1981;85(6):711–717. [Google Scholar]
- 18.Arce A, Blanco M, Soto A, Vidal I. Small angle neutron scattering near Lifshitz lines: Transition from weakly structured mixtures to microemulsions. J Chem Eng Data. 1996;38(2):336–340. [Google Scholar]
- 19.Strey R. Phase behavior and interfacial curvature in water-oil-surfactant systems. Curr Opin Colloid Interface Sci. 1996;1(3):402–410. [Google Scholar]
- 20.Tanford C. The Hydrophobic Effect: Formation of Micelles and Biological Membranes. 2nd Ed Wiley; New York: 1980. [Google Scholar]
- 21.Bauduin P, Testard F, Zemb T. Solubilization in alkanes by alcohols as reverse hydrotropes or “lipotropes.”. J Phys Chem B. 2008;112(39):12354–12360. doi: 10.1021/jp804668n. [DOI] [PubMed] [Google Scholar]
- 22.Schöttl S, et al. Emergence of surfactant-free micelles from ternary solutions. Chem Sci. 2014;5(8):2949–2954. [Google Scholar]
- 23.Schöttl S, Horinek D, Kunz W, Zemb T. Consistent definitions of “the interface” in surfactant-free micellar aggregates. Colloids Surf A Physicochem Eng Asp. 2014;480:222–227. [Google Scholar]
- 24.Gazeau DD, Bellocq AM, Roux D, Zemb T. Experimental evidence for random surface structures in dilute surfactant solutions. Europhys Lett. 1988;9(5):447–452. [Google Scholar]
- 25.Lindner P, Zemb T. Neutrons, X-Rays, and Light: Scattering Methods Applied to Soft Condensed Matter. Elsevier; Amsterdam: 2002. [Google Scholar]
- 26.Klossek ML, Touraud D, Zemb T, Kunz W. Structure and solubility in surfactant-free microemulsions. ChemPhysChem. 2012;13(18):4116–4119. doi: 10.1002/cphc.201200667. [DOI] [PubMed] [Google Scholar]
- 27.Corti M, Minero C, Degiorgio V. Cloud point transition in nonionic micellar solutions. J Phys Chem. 1984;88(2):309–317. [Google Scholar]
- 28.Corti M, Degiorgio V. Critical exponents near the lower consolute point of nonionic micellar solutions. Phys Rev Lett. 1985;55(19):2005–2008. doi: 10.1103/PhysRevLett.55.2005. [DOI] [PubMed] [Google Scholar]
- 29.LeNeveu DM, Rand RP, Parsegian VA. Measurement of forces between lecithin bilayers. Nature. 1976;259(5544):601–603. doi: 10.1038/259601a0. [DOI] [PubMed] [Google Scholar]
- 30.Helfrich W. Effect of thermal undulations on the rigidity of fluid membranes and interfaces. J Phys France. 1985;46(7):1263–1268. [Google Scholar]
- 31.Safran SA, Roux D, Cates ME, Andelman D. Origin of middle-phase microemulsions. Phys Rev Lett. 1986;57(4):491–494. doi: 10.1103/PhysRevLett.57.491. [DOI] [PubMed] [Google Scholar]
- 32.Israelachvili JN, Mitchell DJ, Ninham BW. Theory of self-assembly of lipid bilayers and vesicles. Biochim Biophys Acta. 1977;470(2):185–201. doi: 10.1016/0005-2736(77)90099-2. [DOI] [PubMed] [Google Scholar]
- 33.Tanford C, Nozaki Y, Rohde MF. Size and shape of globular micelles formed in aqueous solution by n-alkyl polyoxyethylene ethers. J Phys Chem. 1977;81(16):1555–1560. [Google Scholar]
- 34.Zemb TN. The DOC model of microemulsions: Microstructure, scattering, conductivity and phase limits imposed by sterical constraints. Colloids Surf A Physicochem Eng Asp. 1997;129-130:435–454. [Google Scholar]
- 35.Bauduin P, Zemb T. Perpendicular and lateral equations of state in layered systems of amphiphiles. Curr Opin Colloid Interface Sci. 2014;19(1):9–16. [Google Scholar]
- 36.Hayter JB. A self-consistent theory of dressed micelles. Langmuir. 1992;8(12):2873–2876. [Google Scholar]
- 37.Arleth L, Marčelja S, Zemb T. Gaussian random fields with two level-cuts—Model for asymmetric microemulsions with nonzero spontaneous curvature? J Chem Phys. 2001;115(8):3923–3936. [Google Scholar]
- 38.Duvail M, Arleth L, Zemb T, Dufrêche J-F. Predicting for thermodynamic instabilities in water/oil/surfactant microemulsions: A mesoscopic modelling approach. J Chem Phys. 2014;140(16):164711. doi: 10.1063/1.4873357. [DOI] [PubMed] [Google Scholar]
- 39.Duvail M, Dufrêche J-F, Arleth L, Zemb T. Mesoscopic modelling of frustration in microemulsions. Phys Chem Phys. 2013;15(19):7133–7141. doi: 10.1039/c3cp43981j. [DOI] [PubMed] [Google Scholar]
- 40.Parsegian VA, Zemb T. Hydration forces: Observations, explanations, expectations, questions. Curr Opin Colloid Interface Sci. 2011;16(6):618–624. [Google Scholar]
- 41.Teubner M. Level Surfaces of Gaussian Random Fields and Microemulsions. Europhys Lett. 2007;14(5):403–408. [Google Scholar]
- 42.Dubois M, et al. Equation of state of colloids coated by polyelectrolyte multilayers. Phys Rev E Stat Nonlin Soft Matter Phys. 2006;74(5 Pt 1):051402. doi: 10.1103/PhysRevE.74.051402. [DOI] [PubMed] [Google Scholar]
- 43.Marčelja S, Mitchell DJ, Ninham BW, Sculley MJ. Role of solvent structure in solution theory. J Chem Soc Faraday Trans II. 1977;73(5):630–646. [Google Scholar]
- 44.Marčelja S. Hydration in electrical double layers. Nature. 1997;385(6618):689–690. [Google Scholar]
- 45.Marčelja S. Hydration forces near charged interfaces in terms of effective ion potentials. Curr Opin Colloid Interface Sci. 2011;16(6):579–583. [Google Scholar]
- 46.Moriyoshi T. Liquid-liquid equilibria water ethanol octanol. J Chem Thermodyn. 1989;21(9):947–954. [Google Scholar]
- 47.Tchakalova V, Zemb T, Benczédi D. Evaporation triggered self-assembly in aqueous fragrance-ethanol mixtures and its impact on fragrance performance. Colloids Surf A Physicochem Eng Asp. 2014;460(6):414–421. [Google Scholar]
- 48.Zoumpanioti M, Karali M, Xenakis A. Lipase biocatalytic processes in surfactant free microemulsion-like ternary systems and related organogels. Enzyme Microb Technol. 2006;39(4):531–539. [Google Scholar]
- 49.De Gennes PG, Taupin C. Microemulsions and the flexibility of oil/water interfaces. J Phys Chem. 1982;86(13):2294–2304. [Google Scholar]
- 50.Aniansson E, Wall SN, Almgren M. Theory of the kinetics of micellar equilibria and quantitative interpretation of chemical relaxation studies of micellar solutions of ionic surfactants. J Phys Chem. 1976;80(9):905–922. [Google Scholar]
- 51.Mitlin VS, Sharma MM. A local gradient theory for structural forces in thin fluid films. J Colloid Interface Sci. 1993;157(2):447–464. doi: 10.1016/j.jcis.2004.05.022. [DOI] [PubMed] [Google Scholar]
- 52.Roger K, Cabane B, Olsson U. Emulsification through surfactant hydration: The PIC process revisited. Langmuir. 2011;27(2):604–611. doi: 10.1021/la1042603. [DOI] [PubMed] [Google Scholar]
- 53.Onuki A, Okamoto R. Selective solvation effects in phase separation in aqueous mixtures. Curr Opin Colloid Interface Sci. 2011;16(6):525–533. [Google Scholar]
- 54.Xu J, Yin A, Zhao J, Li D, Hou W. Surfactant-free microemulsion composed of oleic acid, n-propanol, and H2O. J Phys Chem B. 2013;117(1):450–456. doi: 10.1021/jp310282a. [DOI] [PubMed] [Google Scholar]
- 55.Menger FM, Doll DW. On the structure of micelles. J Am Chem Soc. 1984;106(4):1109–1113. [Google Scholar]
- 56.Winsor PA. Hydrotropy, solubilisation and related emulsification processes. Trans Faraday Soc. 1948;44:376–398. [Google Scholar]
- 57.Lindau G. Zur Erklaerung der Hydrotropie. Die Naturwissenschaften. 1932;23:396–401. [Google Scholar]
- 58.Ornstein LS, Zernike F. Accidental deviations of density and opalescence at the critical point of a single substance. Proc Akad Sci Amsterdam. 1914;17:793–806. [Google Scholar]
- 59.Teubner M, Strey R. Origin of the scattering peak in microemulsions. J Chem Phys. 1987;87(5):3195–3200. [Google Scholar]
- 60.Tomšič M, Jamnik A, Fritz-Popovski G, Glatter O, Vlček L. Structural properties of pure simple alcohols from ethanol, propanol, butanol, pentanol, to hexanol: Comparing Monte Carlo simulations with experimental SAXS data. J Phys Chem B. 2007;111(7):1738–1751. doi: 10.1021/jp066139z. [DOI] [PubMed] [Google Scholar]
- 61.Chen B, Siepmann JI. Microscopic structure and solvation in dry and wet octanol. J Phys Chem B. 2006;110(8):3555–3563. doi: 10.1021/jp0548164. [DOI] [PubMed] [Google Scholar]
- 62.Ferru G, et al. Elucidation of the structure of organic solutions in solvent extraction by combining molecular dynamics and X-ray scattering. Angew Chem Int Ed Engl. 2014;53(21):5346–5350. doi: 10.1002/anie.201402677. [DOI] [PubMed] [Google Scholar]
- 63.Qiao B, Ferru G, Olvera de la Cruz M, Ellis RJ. Molecular origins of mesoscale ordering in a metalloamphiphile phase. ACS Cent Sci. 2015;1(9):493–503. doi: 10.1021/acscentsci.5b00306. [DOI] [PMC free article] [PubMed] [Google Scholar]
- 64.Pieruschka P, Marčelja S. Statistical mechanics of random bicontinuous phases. J Phys II France. 1992;2(2):235–247. [Google Scholar]
- 65.Pieruschka P, Marčelja S, Teubner M. Variational theory of undulating multilayer systems. J Phys II France. 1994;4(5):763–772. [Google Scholar]
- 66.Fogden A, Hyde ST, Lundberg G. Bending energy of surfactant films. Faraday Trans. 1991;87(7):949–955. [Google Scholar]
- 67.Zemb T. Flexibility, persistence length and bicontinuous microstructures in microemulsions. C R Chim. 2009;12(1-2):218–224. [Google Scholar]
- 68.Kunz W, Testard F, Zemb T. Correspondence between curvature, packing parameter, and hydrophilic-lipophilic deviation scales around the phase-inversion temperature. Langmuir. 2009;25(1):112–115. doi: 10.1021/la8028879. [DOI] [PubMed] [Google Scholar]
- 69.Franks NP, Abraham MH, Lieb WR. Molecular organization of liquid n-octanol: An X-ray diffraction analysis. J Pharm Sci. 1993;82(5):466–470. doi: 10.1002/jps.2600820507. [DOI] [PubMed] [Google Scholar]
- 70.Schubert KV, Strey R, Kline SR, Kaler EW. Small angle neutron scattering near Lifshitz lines: Transition from weakly structured mixtures to microemulsions. J Chem Phys. 1994;101(6):5343–5749. [Google Scholar]
- 71.Gradzielski M, Langevin D, Sottmann T, Strey R. Small angle neutron scattering near the wetting transition: Discrimination of microemulsions from weakly structured mixtures. J Chem Phys. 1996;104(10):3782–3787. [Google Scholar]


