Significance
Improving survival of patients with glioblastoma (GBM) using antiangiogenic therapy remains a challenge. In this study we show that dual blockade of angiopoietin-2 and vascular endothelial growth factor delays tumor growth and enhances survival benefits through reprogramming of tumor-associated macrophages toward an antitumor phenotype as well as by pruning immature tumor vessels. The antitumor immunomodulatory potential of this dual blockade supports clinical testing of this approach for GBM with other immunotherapeutic approaches such as checkpoint blockers.
Keywords: anti-angiogenic therapy, tumor microenvironment, anti-tumor immunity, macrophage polarization, microglia reprogramming
Abstract
Inhibition of the vascular endothelial growth factor (VEGF) pathway has failed to improve overall survival of patients with glioblastoma (GBM). We previously showed that angiopoietin-2 (Ang-2) overexpression compromised the benefit from anti-VEGF therapy in a preclinical GBM model. Here we investigated whether dual Ang-2/VEGF inhibition could overcome resistance to anti-VEGF treatment. We treated mice bearing orthotopic syngeneic (Gl261) GBMs or human (MGG8) GBM xenografts with antibodies inhibiting VEGF (B20), or Ang-2/VEGF (CrossMab, A2V). We examined the effects of treatment on the tumor vasculature, immune cell populations, tumor growth, and survival in both the Gl261 and MGG8 tumor models. We found that in the Gl261 model, which displays a highly abnormal tumor vasculature, A2V decreased vessel density, delayed tumor growth, and prolonged survival compared with B20. In the MGG8 model, which displays a low degree of vessel abnormality, A2V induced no significant changes in the tumor vasculature but still prolonged survival. In both the Gl261 and MGG8 models A2V reprogrammed protumor M2 macrophages toward the antitumor M1 phenotype. Our findings indicate that A2V may prolong survival in mice with GBM by reprogramming the tumor immune microenvironment and delaying tumor growth.
Glioblastoma (GBM) is the most common primary malignant brain tumor in adults. Even after maximal safe resection and chemoradiation, most patients survive little more than 1 y (1, 2). Bevacizumab, a humanized monoclonal antibody against vascular endothelial growth factor (VEGF), was conditionally approved in 2009 in the United States for treatment of recurrent GBM (rGBM) (2–5). Adding bevacizumab to the standard regimen of radiotherapy and alkylating chemotherapy with temozolomide confers an increase in progression-free survival (PFS) but does not improve overall survival in newly diagnosed GBM (nGBM) patients (6, 7). Similarly, cediranib, an oral pan-VEGF receptor tyrosine kinase inhibitor, fails to improve overall survival in patients with rGBM (8). Most recently a European Organization for the Research and Treatment of Cancer randomized phase III trial (EORTC 26101) showed that bevacizumab plus lomustine does not improve survival in patients with progressive GBM, although it prolongs progression-free survival (9). We previously have shown that angiopoietin-2 (Ang-2) is a resistance pathway to anti-VEGF therapy in a preclinical model of GBM (10). Ang-2 competes with angiopoietin-1 (Ang-1) in binding to the TEK receptor tyrosine kinase (Tie-2) receptor (11, 12). In physiological settings, Ang-1 activates Tie-2 and stabilizes blood vessels, whereas Ang-2 inhibits Tie-2 signaling, destabilizes blood vessels, and facilitates VEGF-induced angiogenesis in a context-dependent manner (13). In tumors, however, Ang-2 may act as a partial Tie-2 agonist, conferring therapy resistance by protecting endothelial cells (EC) from therapeutic VEGF withdrawal (14). The tumor growth-supportive role of Ang-2 in GBMs is not confined to the vascular compartment. Ang-2 also has been shown to mediate the homing of Tie-2+ macrophages to human GBMs (15, 16). In the tumor microenvironment, the macrophage population then is reprogrammed to a protumor (17–19), proangiogenic phenotype (20–22) in an Ang-2–dependent manner (22). Tumor-associated macrophages (TAMs) have a broad phenotypic spectrum, and their polarization can change in response to their microenvironment. The two extremes of the phenotypic spectrum of TAMs are defined as the alternatively activated protumor (M2) versus classically activated antitumor (M1) states (23–25). We previously have shown that the degree of TAM infiltration in GBM patients treated with anti-VEGF therapy is inversely correlated with survival (26). These data point to the role of TAMs as potential mediators of resistance to anti-VEGF therapy in GBM. Here we used a dual Ang-2/VEGF-inhibiting antibody (A2V) in orthotopic syngeneic (Gl261 graft) and patient-derived cell line (MGG8 xenograft) models of GBM. We show that A2V treatment can reprogram TAMs to the antitumor M1 state. Moreover, we further dissect the reprogramming effects in the overall TAM population and show that both recruited macrophages and resident microglia can be therapeutically altered by dual Ang-2/VEGF inhibition. Combined anti–Ang-2/VEGF therapy was shown to delay tumor growth and prolong survival in a number of extracranial tumor models (27–30). Although anti–Ang-2/VEGF therapy is being tested in GBM patients (NCT01609790, NCT01248949, NCT01290263) and in other solid malignancies (Table S1). The bispecific antibody A2V has been shown to be safe in a first-in-human study (NCT01688206) in patients with locally advanced or metastatic solid tumors (31). Here we show that the murinized Ang-2/VEGF–neutralizing antibody A2V (CrossMab) is effective in two different GBM models and delays tumor growth through vascular and/or immunomodulatory effects.
Table S1.
Current clinical trials investigating anti–Ang-2 therapies in cancer
| Clinical trial no. | Biological (chemotherapeutic) | Target(s) | Disease(s) | Sponsor | Phase | Status |
| NCT01210222 | AMG 386 | Ang1/2 | Endometrial cancer | Gynecologic Oncology Group | II | Ongoing |
| NCT01623869 | AMG 386 | Ang1/2 | Angiosarcoma | NCI | II | Ongoing |
| NCT01538095 | AMG 386 | Ang1/2 | Solid childhood CNS cancer and other tumors | NCI | I | Ongoing |
| NCT01548482 | AMG 386 | Ang1/2 | Solid tumors | NCI | I | Ongoing |
| NCT01538095 | AMG 386 | Ang1/2 | Solid CNS and other tumors | NCI | I | Ongoing |
| NCT00511459 | AMG 386 (paclitaxel) + bevacizumab | Ang1/2, VEGF | Breast cancer | Amgen | II | Completed |
| NCT01553188 | AMG 386, (abiraterone) | Ang1/2 | Prostate cancer | NCI | II | Recruiting |
| NCT01281254 | AMG 386, (doxorubicin) | Ang1/2 | Ovarian cancer | Amgen | III | Ongoing |
| NCT01137552 | AMG 780 | Ang1/2 | Solid tumors | Amgen | I | Completed |
| NCT01609790 | AMG386 + bevacizumab | Ang1/2, VEGF | Recurrent brain tumors | NCI | II | Ongoing |
| NCT01249521 | AMG386 + bevacizumab | Ang1/2, VEGF | Colorectal cancer | Austin Health | II | Unknown |
| NCT01664182 | AMG386 + bevacizumab, pazopanib, sorafenib, or sunitinib | Ang1/2, VEGF, VEGFR, PDGFR, c-KIT, FGFR | Renal cell carcinoma | NCI | II | Recruiting |
| NCT00872014 | AMG386 + sorafenib | Ang1/2, VEGFR, PDGFR | Hepatocellular carcinoma | Amgen | II | Completed |
| NCT00467025 | AMG386 + sorafenib | Ang1/2, VEGFR, PDGFR | Renal cell carcinoma | Amgen | II | Completed |
| NCT00853372 | AMG386 + sunitinib | Ang1/2, PDGFR, VEGFR | Renal cell carcinoma | Amgen | II | Ongoing |
| NCT01441414 | CVX-060 + axitinib | Ang-2, VEGFR, PDGFR, c-kit | Renal cell carcinoma | Pfizer | II | Terminated 3/2014* |
| NCT01004822 | CVX-241 | Ang-2, VEGF | Solid tumors | Pfizer | I | Terminated 5/20142† |
| NCT00982657 | CVX060 + sunitinib | Ang-2, PDGFR, VEGFR | Renal cell carcinoma | Pfizer | II | Completed |
| NCT00879684 | CVX-60 | Ang-2 | Advanced solid tumors | Pfizer | I | Completed |
| NCT01248949 | MEDI3617 + bevacizumab, (different chemotherapeutics) | Ang-2, VEGF | Glioma, ovarian cancer | MedImmune LLC | I | Ongoing |
| NCT01271972 | REGN910 | Ang-2 | Solid tumors | Regeneron | I | Completed |
| NCT01688960 | REGN910, aflibercept | Ang-2, VEGF | Solid tumors | Regeneron | I | Completed |
| NCT01688206 Part I | Vanucizumab | Ang-2/VEGF | Solid tumors | Roche | I | Completed |
| NCT01688206 Part II | Vanucizumab | Ang-2/VEGF | Solid tumors | Roche | I | Completed |
| NCT01688206 Part III | Vanucizumab | Ang-2/VEGF | Platinum-resistant ovarian cancer | Roche | I | Completed |
| NCT01688206 Part IV | Vanucizumab + atezolizumab | Ang-2/VEGF + PD-L1 | Platinum-resistant ovarian cancer | Roche | I | Ongoing |
| NCT02141295 | Vanucizumab + mFOLFOX6 and bevacizumab + mFOLFOX-6 | Ang-2/VEGF-A VEGF-A | 1L metastatic colorectal cancer | Roche | II | Ongoing |
Terminated because of the unexpected frequency of arterial thrombotic events and venous thrombotic events.
Terminated because of the absence of significant pharmacological effects (safety/pharmacodynamics/efficacy).
Results
Ang-2/VEGF Inhibition Delays Tumor Growth and Prolongs Survival.
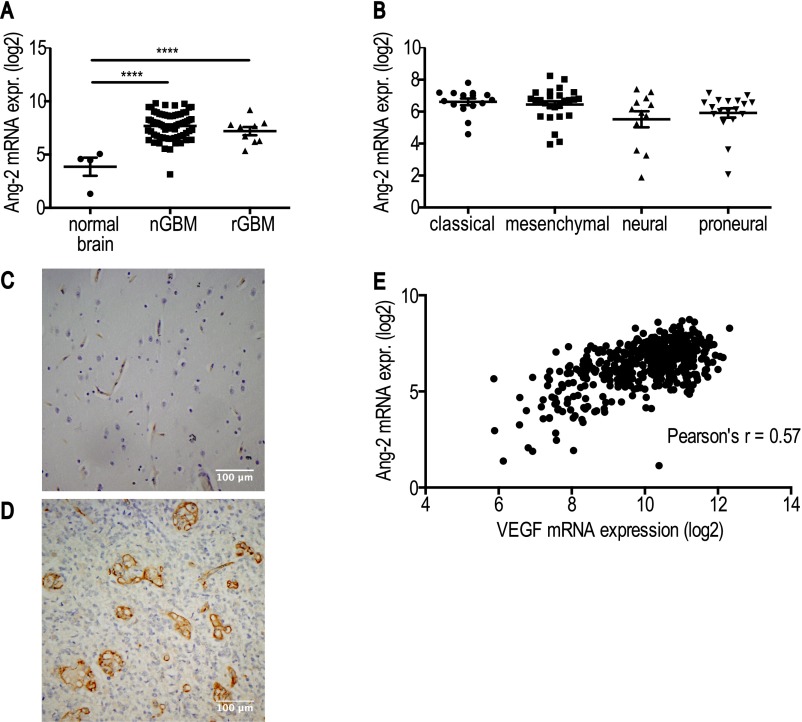
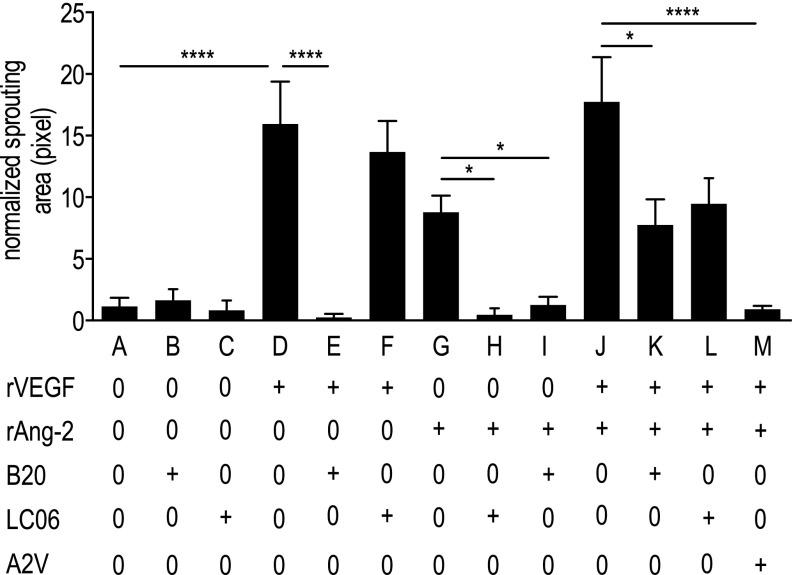
We first validated Ang-2 as a potential target in GBM patients by analyzing publicly available data portals, i.e., The Cancer Genome Atlas (TCGA) and Gene Expression Omnibus (32–34). We found that Ang-2 is expressed in newly diagnosed GBM [nGBM] and rGBM (Fig. S1A) across molecular subtypes (Fig. S1B), significantly correlates with VEGF expression (Fig. S1E), and is predominantly expressed in GBM blood vessels in patients (Fig. S1 C and D). Next we investigated the effects of blocking Ang-2 and VEGF alone or in combination with Ang-2 in an orthotopic syngeneic murine GBM model (Gl261 in C57BL/6 mice). The Gl261 model recapitulates abnormal GBM tumor vessels and the presence of intratumoral foci of necrosis and displays a moderate degree of invasion into the surrounding brain. We treated Gl261-bearing animals with IgG control or with antibodies inhibiting Ang-2 (LC06), VEGF (B20), or Ang-2/VEGF (A2V) and found that all experimental therapies increased survival compared with IgG control (Fig. 1A). In addition, we found that A2V treatment significantly extended median survival compared with either LC06 or B20 alone (Fig. 1A). Next we tested if the effects we observed in the Gl261 model were conserved in the MGG8 model. The MGG8 model is characterized by extensive single-cell invasion but a tumor vasculature that is less abnormal than seen with Gl261. In the MGG8 model, both LC06 and B20 failed to confer a survival benefit compared with IgG, but A2V prolonged survival compared with all treatment groups (Fig. 1B). To assess the antiangiogenic potential of LC06, B20, and A2V, we next measured the effects of these antibodies on primary ECs (human umbilical vein ECs, HUVECs) in a microfluidic chamber assay (Fig. S2). We found that the combination of recombinant VEGF (rVEGF) plus recombinant Ang-2 (rAng-2) strongly induced sprouting in HUVECs. HUVEC sprouting induced by exogenous rVEGF alone was significantly inhibited by B20 but not by LC06 (Fig. S2 A–F). HUVEC sprouting induced by rVEGF plus rAng-2 (Fig. S2J) also was significantly inhibited by B20 (Fig. S2 K and L) but was not decreased by LC06 and was completely abrogated by A2V (Fig. S2M). Importantly, exogenous rAng2-induced EC sprouting was completely abolished not only by LC06 but also by B20 in the absence of exogenous rVEGF (Fig. S2 G–I). The angiogenic effect of Ang-2 appears to be dependent on VEGF signaling, which may contribute to the context-dependent functions of Ang-2. Based on these data and our observation that LC06 did not confer a survival benefit in the MGG8 model, we determined that Ang-2 blockade requires additional VEGF inhibition to inhibit angiogenesis effectively. Therefore we focused all further analyses on B20 and A2V compared with control.
Fig. S1.
Ang-2 is expressed in human nGBM and rGBM, independent of the molecular subtype. (A) Ang-2 is overexpressed in human nGBM and rGBM compared with normal human brain (****P < 0.0001, n = 70, 9, 4, respectively). No difference in Ang-2 expression was detectable between human nGBM and rGBM. (B) TCGA subgroup-specific analyses revealed that Ang-2 is expressed across all GBM subtypes [no significant differences between groups; P = 0.06 (ANOVA); classical n = 15, mesenchymal n = 26, neural n = 12, proneural n = 18]. (C and D) Ang-2 is expressed in abnormal human GBM vessels but is not detectable in GBM tumor cells (n = 12). Shown are representative Ang-2 immunohistochemical images of human nGBM in low-power (C) and high-power (D) magnification. (E) Ang-2 expression correlates with VEGF expression in human GBM (PCC r = 0.57, ****P < 0.0001, n = 482). Log2 represents logarithm to base 2.
Fig. 1.
Treatment with A2V prolongs survival and delays tumor growth in the orthotopic Gl261 and the MGG8 models. (A) In the Gl261 model, treatment with A2V (n = 10) led to a survival benefit compared with IgG [hazard ratio (HR) 3.93, 95% confidence interval (CI) 4.15–35.97, ***P = < 0.001, n = 10], LC06 (HR 2.99, 95% CI 1.6–13.49, **P = 0.0098, n = 9), and B20 (HR 2.35, 95% CI, 1.31–9.12, *P = 0.03, n = 10) treatment. LC06 prolonged survival compared with IgG treatment (HR 2.32, 95% CI 1.31–8.98, *P = 0.03, n = 9), and B20 increased survival compared with IgG treatment (HR 2.68, 95% CI 2.03–14.58, **P = 0.005, n = 10). (B) In the MGG8 model treatment with LC06 (n = 9) or B20 (n = 9) did not prolong survival compared with IgG treatment (n = 10). Therapy with B20 significantly prolonged survival compared with LC06 therapy (HR 2.48, 95% CI 1.47–11.31, *P = 0.02, n = 9). Therapy with A2V (n = 10) prolonged survival compared with IgG (HR 3.83, 95% CI 4.07–35.39, ***P < 0.001), LC06 (HR 4.14, 95% CI 4.76–49.81, ****P = < 0.001, n = 9), and B20 (HR 2.28, 95% CI 1.51–11.13, *P = 0.03, n = 9) therapy. Time represents days post treatment initiation. Animals were treated once weekly i.p. with 10 mg/kg of IgG control, B20, LC06, or A2V.
Fig. S2.
A2V reduced HUVEC sprouting in vitro to a greater extent than B20. The normalized area of HUVEC sprouting into the 3D collagen gel region of microfluidic devices was quantified after 3 d of treatment. Bar A: the baseline level of invasion without treatment. Bars B and C: treatment with B20 (Bar B) or LCO6 (Bar C) did not affect invasion compared with control. Bar D: Treatment with rVEGF induced invasion compared with control (***P < 0.001) and was abrogated by B20 (****P < 0.001). Bar E: LC06 did not influence VEGF-induced sprouting. Bars G–I: Ang-2–induced sprouting was inhibited by both LC06 (*P = 0.05) and B20 (*P = 0.03). Bars J–M: Invasion induced by rAng-2 + VEGF was reduced by B20 (Bar K) (*P = 0.04), but not by LC06 (Bar L) and was completely blocked by A2V (Bar M) (P < 0.001). “+” indicates a concentration of 50 ng/mL for rVEGF and rAng-2 and 50 μg/mL for B20, LC06, and A2V. n = 21–35 per condition.
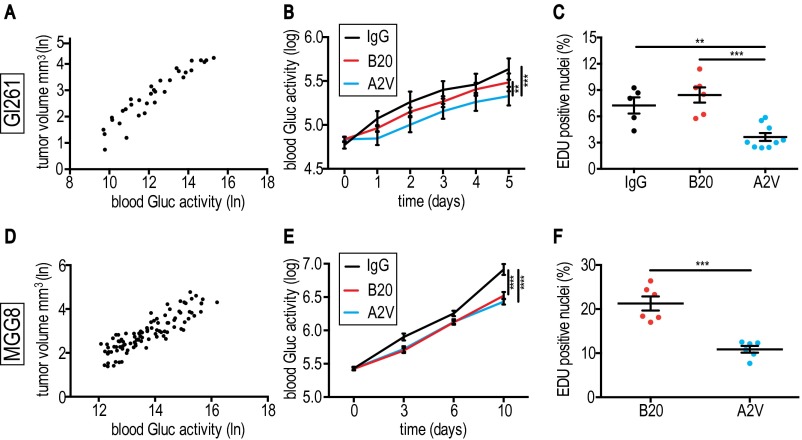
In additional animal experiments we harvested GBM specimens for histological analyses in a time-matched fashion at a time point when viable tumor burden—as a surrogate of viable tumor burden (Fig. S3 A and D)—was significantly different from control: Gl261 tumors were harvested on day 5, and MGG8 tumors at day 10 after treatment initiation. To determine if antiangiogenic treatments with B20 and A2V decrease tumor burden, we monitored blood Gaussia luciferase (Gluc) activity (35–37) daily in Gl261-GFP-Gluc–bearing mice treated with IgG, B20, or A2V. Reduced blood Gluc activity in A2V-treated animals suggested lower tumor burden as compared with IgG or B20 treatment (Fig. S3B). Moreover, using the 5-ethynyl-2′-deoxyuridine (EdU) incorporation assay, we found that Gl261 tumors of A2V-treated animals exhibited reduced proliferation compared with IgG control or B20 therapy (Fig. S3C).
Fig. S3.
A2V treatment slows tumor growth and decreases proliferation in both Gl261 and MGG8 tumors. (A) Gl261-GFP-Gluc and tumor volume in cubic millimeters as measured by in vivo micro ultrasound with Gluc blood activity. ln, natural logarithm. (B) A2V treatment (n = 15) delayed tumor growth (represented by blood Gluc activity; log represents logarithm to base 10) compared with IgG (n = 9) (***P < 0.001) and B20 (n = 14) (**P < 0.01). (C) In Gl261 tumors the percentage of EdU+ proliferating tumor cells was lower in A2V-treated tumors (n = 9) than in IgG-treated tumors (n = 5) (**P < 0.006) or B20-treated tumors (n = 6) at day 5 post treatment initiation (***P < 0.001). (D) MGG8-GFP-Gluc levels and tumor volume in cubic millimeters measured by in vivo micro ultrasound. (E) A2V therapy (n = 16) delayed tumor growth compared with IgG treatment (n = 8) (****P < 0.001). B20 treatment delayed tumor growth compared with IgG treatment (****P < 0.001). Comparisons of tumor growth in B20 and A2V treatments did not reach significance at day 10. (F) In MGG8 tumors the percentage of EdU+ cells was decreased by A2V treatment compared with B20 treatment (both n = 6) (***P < 0.001).
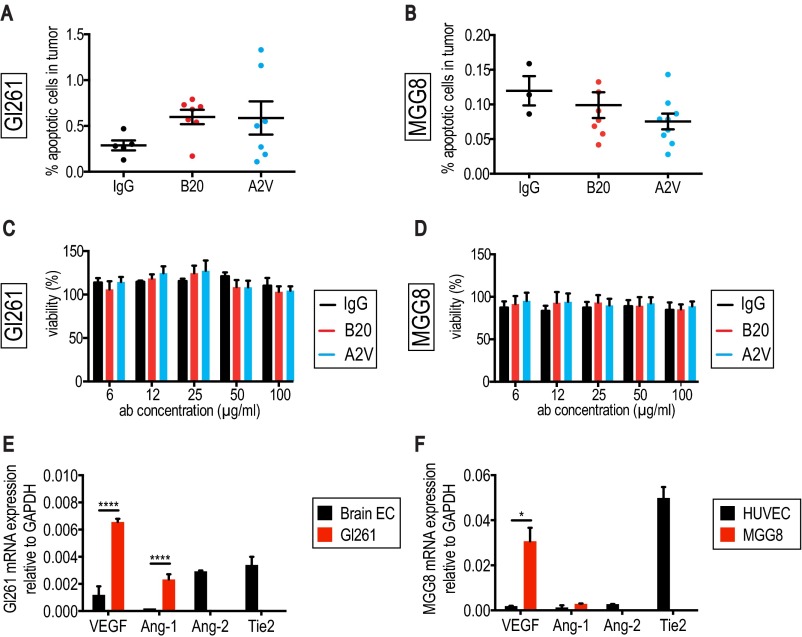
In the MGG8 model, levels of blood Gluc activity were lower in B20- and A2V-treated animals than in animals treated with IgG, suggesting therapy-induced reduction of viable tumor burden (Fig. S3E). Comparisons in the kinetics of tumor burden between B20- and A2V-treated MGG8-bearing animals failed to reach significance (Gluc assay). However, we measured significantly reduced tumor proliferation (EdU assay) in A2V- compared with B20-treated tumors (Fig. S3F). We detected no significant difference in apoptosis between the treatment groups in either Gl261 or MGG8 tumors (Fig. S4 A and B). Further in vitro experiments showed that neither B20 nor A2V had a direct effect on GBM cell viability in these models (Fig. S4 C and D), as is consistent with the absence of Tie-2 expression on the tumor cells (Fig. S4 E and F). Taken together our results demonstrate that A2V prolongs the survival of mice bearing Gl261 and MGG8 tumors by reducing in vivo tumor burden.
Fig. S4.
No significant treatment effects on apoptosis were seen in the Gl261 or MGG8 models in vivo or in vitro. (A) No significant changes in the percentage of apoptotic cells were observed between treatment groups in the Gl261 model at day 5 post treatment initiation. IgG, n = 5; B20, n = 7; A2V, n = 7. (B) No differences in apoptosis were seen in the MGG8 model at day 10 post treatment start. B20, n = 6; A2V, n = 6. (C and D) Gl261 (C) or MGG8 (D) cells were grown in nonadherent culture conditions and treated with IgG, B20, and A2V at doses ranging from 6.25–100 µg/mL. Cell viability was measured using the MTT assay 72 h after treatment start. Neither Gl261 (C) nor MGG8 (D) cell viability was affected by the antibody treatment 72 h after treatment start. (E) Characterization of factors relevant to our studies showed that Gl261 cells express high levels of VEGF (****P ≤ 0.0001) and Ang-1 (****P < 0.0001) compared with mouse brain endothelial cells. Expression of Ang-2 and the Tie-2 receptor was at nondetectable levels. (F) MGG8 cells express higher levels of VEGF than HUVECs (*P = 0.02), comparable levels of Ang-1, and nondetectable levels of Ang-2 and Tie-2. mRNA expression was normalized to GAPDH.
A2V Enhances Vessel Pruning as Compared with VEGF Inhibition Alone in the Gl261 Model.
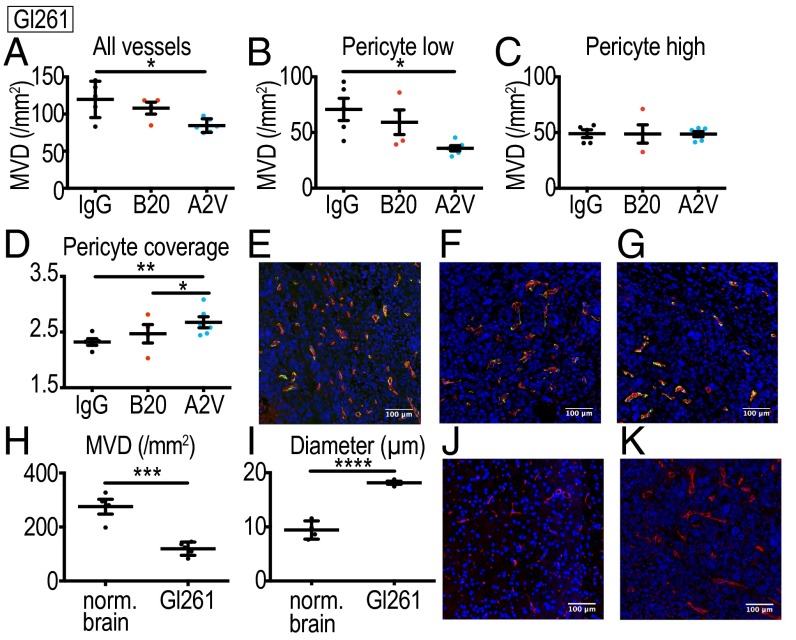
To determine if vessel-modulating effects are responsible for the prolonged survival and reduced tumor burden in the A2V group, we studied the effects of A2V on Gl261 tumor vessels (Fig. 2 A–G). The vasculature of Gl261 tumors is characterized by lower microvessel density (MVD) (Fig. 2H) and larger vessel diameters (Fig. 2I) than seen in the vasculature of the normal brain (Fig. 2 H–K). Using immunohistochemistry in Gl261 tumor tissues, we found that A2V-treated tumors displayed a lower MVD than IgG-treated tumors at day 5 after treatment initiation (Fig. 2A). Perivascular cells stabilize tumor vessels and can confer resistance to antiangiogenic treatment (38, 39). We found that the MVD of immature vessels with low pericyte coverage was significantly decreased (Fig. 2B). In contrast, the MVD of mature vessels with high pericyte coverage was similar across treatment groups (Fig. 2C). Interestingly, A2V treatment in the Gl261 model further increased pericyte coverage of the remaining pericyte-high vessels, as compared with IgG and B20 treatments (Fig. 2 D–G). Collectively, our experiments show that in Gl261 tumors more potent antiangiogenic effects on immature pericyte-low vessels are seen with A2V treatment than with B20 treatment.
Fig. 2.
A2V decreases tumor vessel density in Gl261 tumors. (A) A2V (n = 6) reduces total MVD (vessels/mm2) compared with IgG (*P = 0.01, n = 5). (B) A2V treatment (n = 6) reduces MVD of blood vessels with low pericyte coverage compared with IgG treatment (*P = 0.02, n = 5). (C) No difference in the MVD of vessels with high pericyte coverage was detectable between treatment groups (IgG, n = 6; B20, n = 6; A2V, n = 4). (D) Pericyte coverage in pericyte-high vessels was higher with A2V (n = 6) compared to treatment with B20 (*P = 0.03) and IgG (**P = 0.001, n = 5). (E–G) Representative immunofluorescence images of IgG-, B20-, and A2V-treated tumors. Shown are tumor vessels (red), pericytes (green), and DAPI-stained nuclei (blue). (H) IgG-treated Gl261 tumors (day 5 post treatment initiation, n = 5) display lower MVD than seen in the normal brain (nl brain) of 10-wk-old C57BL/6 mice (***P < 0.001, n = 4). (I) The mean vessel diameter in IgG-treated Gl261 tumors (n = 4) is larger than that in normal C57BL/6 brain vessels (****P < 0.0001, n = 4). (J and K) Gl261 vessels are inhomogeneously distributed, dilated, and irregularly shaped as compared with normal brain vessels of C57BL/6 mice. Shown are representative immunofluorescence images of the normal brain (J) and Gl261 tumor vessels (K) stained for CD31 (red). MVD represents vessels/mm2 tumor area; pericyte coverage represents desmin-positive pixels per vessel perimeter (pixels). (Scale bars, 100 µm.)
A2V Reduces Tumor Burden in the MGG8 Model Without Vessel Pruning.
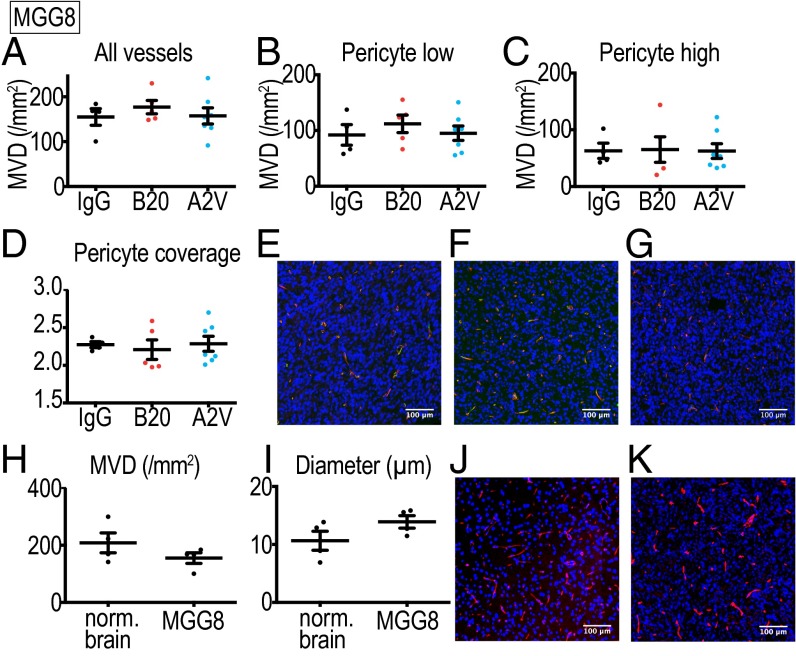
Next, we tested if the vascular effects observed in the Gl261 model (Fig. 2 A–G) could also be observed in the MGG8 model (Fig. 3 A–H). The MGG8 vasculature showed a lower degree of abnormality, with vessel architecture resembling the normal mouse brain (Fig. 3 H–K). MGG8 tumors have a higher MVD than the Gl261 model (Fig. 3H), and vessels are homogeneously distributed, less tortuous, and smaller in diameter (Fig. 3 I–K). Immunohistochemical analyses showed that, in contrast to the Gl261 model, A2V treatment induced no significant changes in MVD or pericyte coverage compared with B20- or IgG-treated MGG8 tumors (Fig. 3 A–D). These results indicate that the reduction of tumor burden after A2V treatment in the MGG8 model is mediated by effects other than vessel modulation.
Fig. 3.
Treatment with A2V and B20 had no vascular effects in the MGG8 model. (A–D) IgG, n = 4; B20 n = 5; A2V, n = 7. (A) No differences between treatment groups were detected in total MVD (vessels/mm2) or in the MVD of vessels with low (B) or high (C) pericyte coverage. There were no differences in tumor vessel pericyte coverage (D). (E–G) Representative immunofluorescence images of IgG- (E), B20- (F), and A2V- (G) treated tumors. Shown are tumor vessels (red), pericytes (green), and DAPI-stained nuclei (blue). (H) No significant difference in MVD was seen between IgG-treated MGG8 tumors (at day 10 post treatment initiation, n = 4) and the normal brain (nl brain) of 10-wk-old mice (n = 4). (I) Mean vessel diameter in IgG-treated MGG8 tumor vessels (n = 4) is similar to that in the normal SCID brain (n = 4). (J and K) MGG8 vessels are homogeneously distributed throughout the tumor and display a regular shape, similar to normal brain vessels of SCID mice. Shown are representative immunofluorescence images of MGG8 tumor vessels stained for CD31 (red) and nuclei stained with DAPI (blue). MVD represents vessels/mm2 tumor area; pericyte coverage represents desmin-positive pixels per vessel perimeter (pixels). (Scale bars, 100 µm.)
A2V Treatment Promotes an Antitumor Macrophage Phenotype.
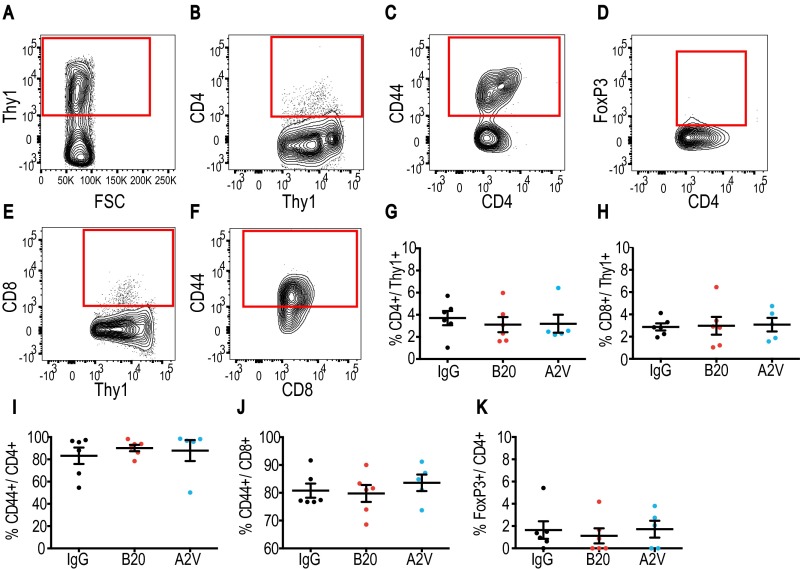
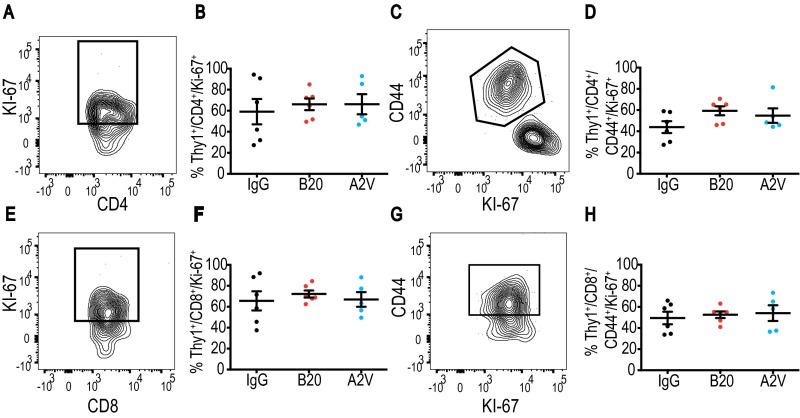
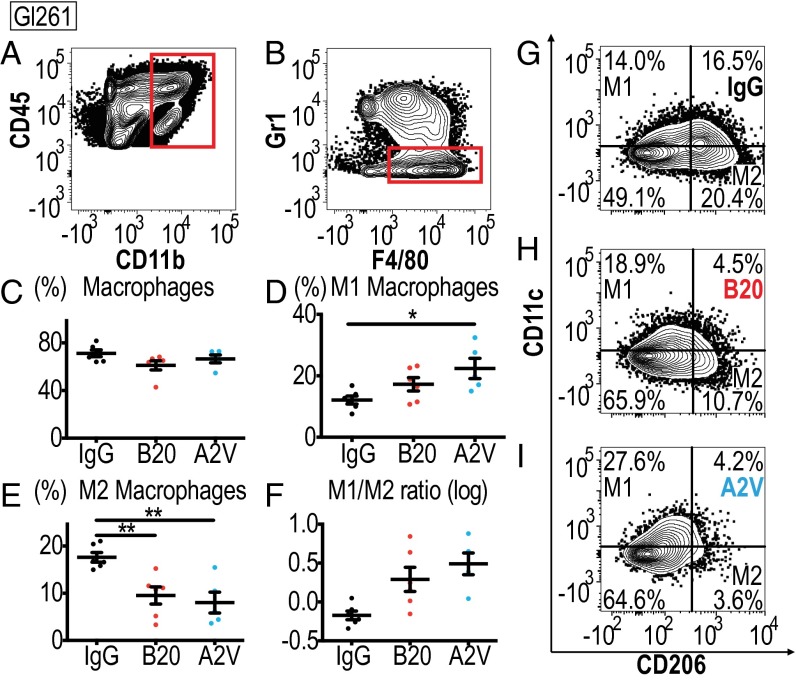
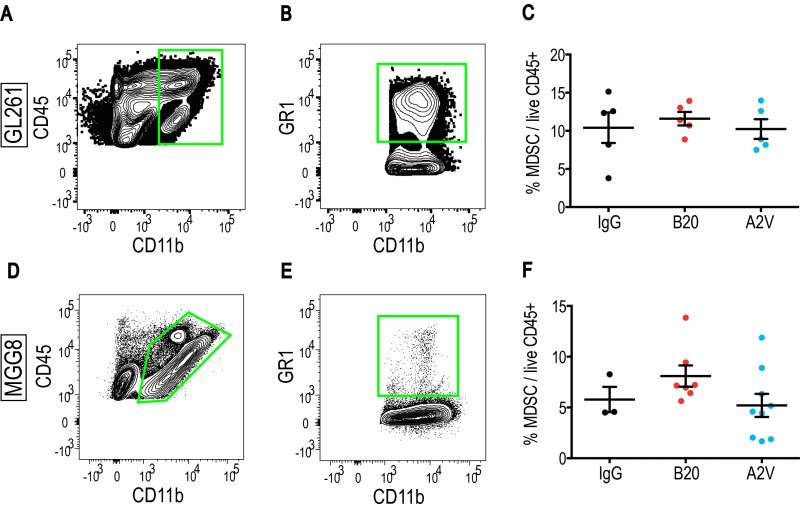
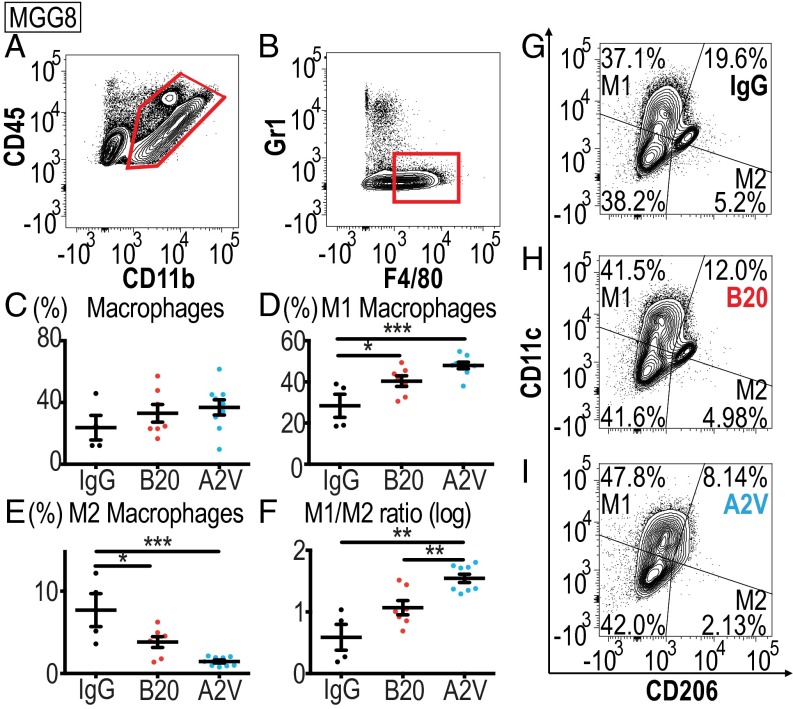
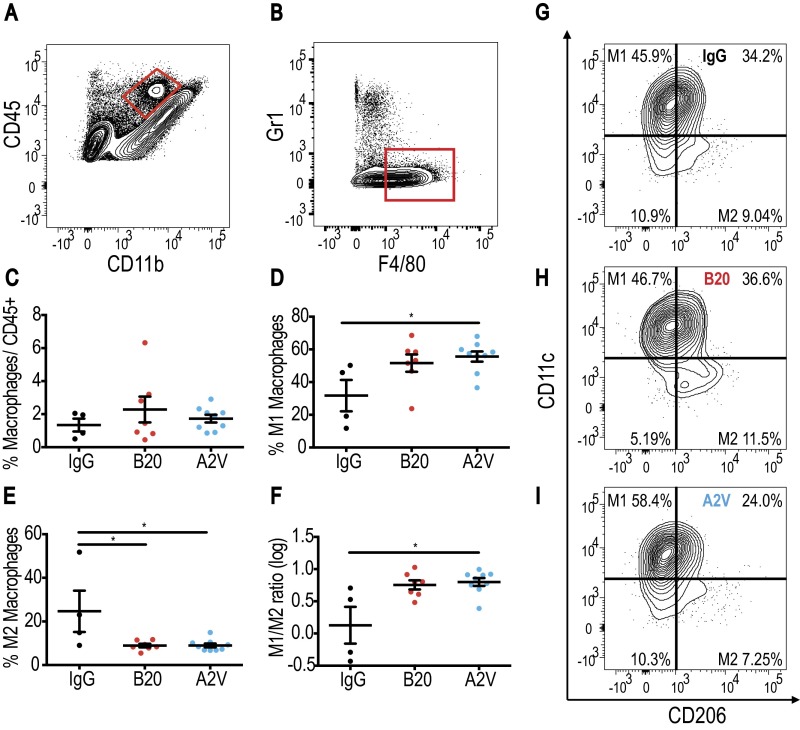
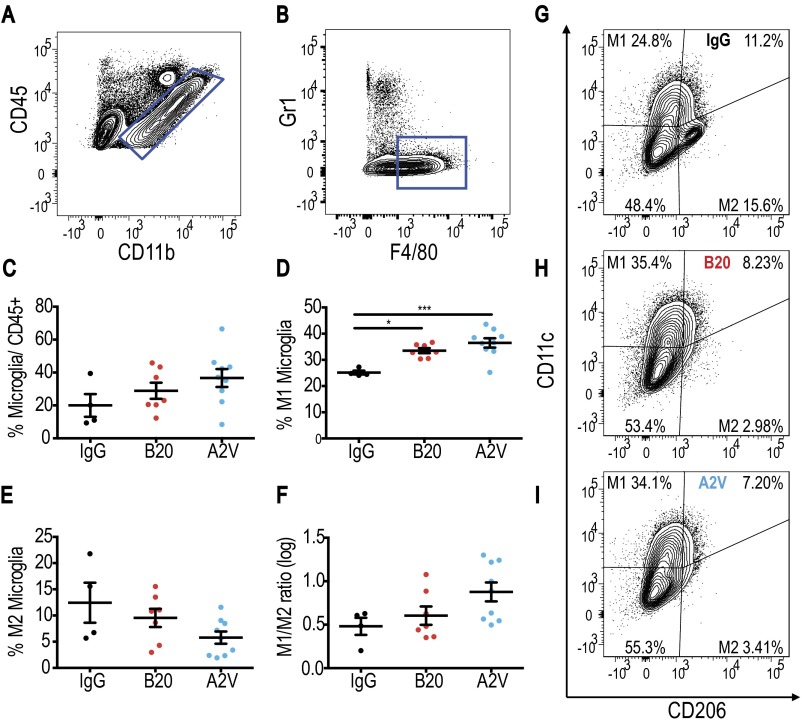
Glioma-associated immune cell populations have the potential to create and maintain tumor progression and immunosuppression. To study the impact of antiangiogenic therapy on the tumor immune microenvironment, we analyzed cellular compartments of Gl261 tumors. First, we measured the presence and activation status of CD4+ and CD8+ T cells of Gl261 tumors treated for 10 d with IgG, B20, or A2V (Fig. S5). Next, we analyzed the presence and quantity of CD4+ and CD8+ T cells among lymphocytes and assessed their state of activation. In further analyses we measured the presence of the T-regulatory suppressive phenotype (Fig. S5) and the activation and proliferation state of CD4+ and CD8+ cells (Fig. S6). Our data indicate that treatment with B20 or A2V did not induce changes in the number, proliferation, or activation state in T-cell subsets within tumors. In further analyses, we measured the number and phenotype of TAMs. Our data indicate no significant changes in the presence of TAMs (as a percentage of total CD45+ cells) among the treatment groups (Fig. 4). However, the percentage of M1-polarized antitumor TAMs (defined as CD206low/CD11chigh and shown as a percentage of total macrophages) was significantly higher in A2V-treated tumors than in controls (Fig. 4 D and G–I). Moreover, the percentage of protumor M2 TAMs (defined as CD206high/CD11clow) was decreased by both B20 and A2V treatment (Fig. 4 E and G–I). The resulting ratio of M1/M2 TAMs was skewed toward the antitumor M1 phenotype (Fig. 4F). Within the total TAM population we distinguished between TAMs recruited from the blood circulation versus resident microglia populations. Our data indicate that changes in the overall TAM population were mediated chiefly by a phenotypic shift in recruited TAMs (Figs. S7 and S8). In agreement with these data, we found gene expression changes in TAMs suggestive of enhanced M1 (Cxcl9, Il6) and reduced M2 (CD206) polarization (Fig. S9). We observed no changes in the percentage of CD45+/CD11b+/GR1+ myeloid-derived suppressor cells (MDSCs) after treatment with B20 or A2V in the tumors (Fig. S10 A–C). Consistent with the data from the Gl261 model, flow cytometric analyses of MGG8 tumors after 10 d of treatment showed that therapy with IgG, B20, or A2V did not change the percentage of TAMs (Fig. 5). Moreover, A2V therapy and, to a lesser extent, B20 therapy also increased the percentage of M1 TAMs in MGG8 tumors as compared with IgG treatment (Fig. 5 D and G–I). Importantly, treatment with A2V reduced the percentage of protumor M2 macrophages as compared with IgG treatment. Treatment with B20 induced a similar reduction in M2 TAMs compared with IgG treatment (Fig. 5 E and G–I). The M1/M2 TAM ratio was significantly increased by A2V therapy (Fig. 5F). We observed significant reprogramming effects toward the M1 phenotype in both the recruited TAMs and the microglia after treatment with B20 and A2V (Figs. S11 and S12). As seen in the Gl261 model, MDSC infiltration was not affected by treatment with either B20 or A2V (Fig. S10 C–E).
Fig. S5.
The T-cell infiltration and activation state in Gl261 tumors does not change under treatment. In all panels, IgG, n = 6; B20, n = 6; A2V, n = 5. (A–D) Viable CD4 T-cells were identified by gating through CD4+/Thy1+/CD44+ (A–C), and the activation state was assessed by further gating through FoxP3 (D). (E and F) CD8 cells were measured by gating through CD8+/Thy1+/CD44+. (G and H) No differences were observed in the percentage of CD4+ cells or CD8+ cells (both shown as percentage of Thy1pos). (I–K) There were no differences among therapy groups in CD44+ or FoxP3+ CD4 or CD8 cells.
Fig. S6.
T-cell proliferation and activation states in Gl261 tumors do not change under treatment. In all panels, IgG, n = 6; B20, n = 6; A2V, n = 5. (A and B) Proliferating CD4+ cells were identified by gating through CD4+/Thy1+/Ki-67, and no differences between the treatment groups were measured. (C and D) CD4+/Thy1+/CD44+/Ki-67–activated and proliferating CD4+ T cells were unchanged by treatment. (E–H) Gating through CD8+/Thy1+/Ki-67 (E and F) and CD8+/Thy1+/CD44+/Ki-67 (G and H) showed no difference in CD8+ T-cell proliferation or activation.
Fig. 4.
In the Gl261 model treatment with A2V shifts TAMS toward the M1 state. In all panels, IgG, n = 6; B20, n = 6; A2V, n = 5. (A and B) Gating through CD45high/CD11b+ and F4/80+/GR1− identified macrophages. (C) Treatment with A2V or B20 did not lead to significant changes in the total percentage (percent of all CD45pos cells) of Gl261 tumor-infiltrating macrophages compared with IgG control. (D) The percentage of CD206low/CD11chigh M1-polarized macrophages (as a percentage of total macrophages) was increased in A2V-treated Gl261 tumors as compared with IgG-treated tumors (*P = 0.02). (E) CD206high/CD11clow M2 macrophages were decreased by A2V treatment compared with IgG treatment (**P = 0.004). B20 therapy decreased M2 macrophages compared with IgG therapy (**P = 0.01). (F) The M1/M2 ratio showed a trend toward the M1 polarization state in A2V-treated animals compared with IgG-treated animals. (G–I) Representative gates for IgG (G), B20 (H), and A2V (I) to identify M1 and M2 macrophages.
Fig. S7.
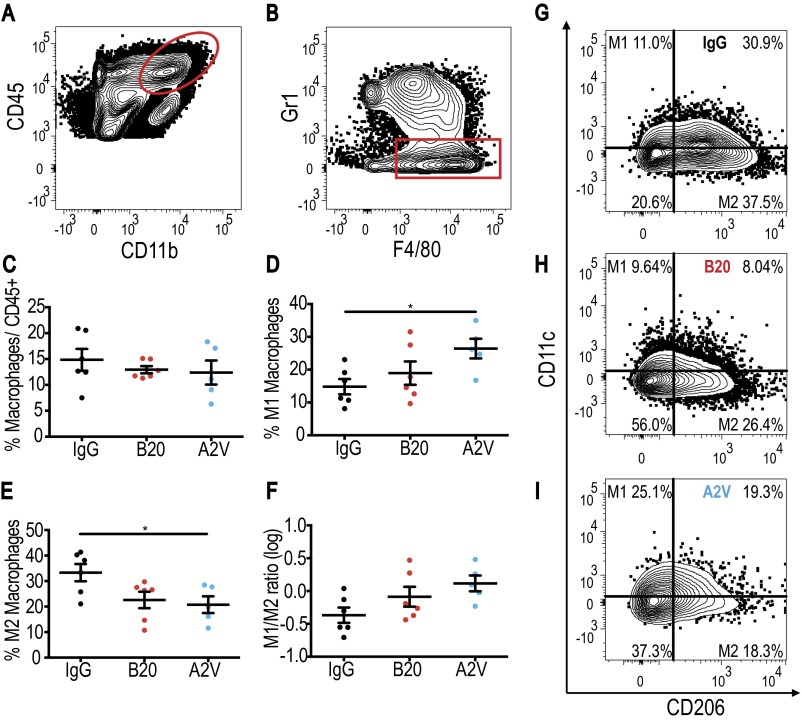
Treatment with B20 and A2V skews macrophages toward the M1 phenotype in Gl261 tumors. In all panels, IgG, n = 6; B20, n = 6; A2V, n = 5. (A and B) Gating through CD45high/CD11b+ (A) and F4/80+/GR1− (B) identified macrophages. (C) The total percentage of macrophages was not changed by treatment. (D) M1 macrophages were increased by A2V treatment compared with IgG treatment (*P = 0.05). (E) M2 macrophages were reduced by treatment with A2V compared with IgG treatment (*P = 0.05). (F) The M1/2 macrophage ratio trended toward an increase in M1 under A2V treatment as compared with IgG treatment. (G–I) Representative gates for IgG (G), B20 (H), and A2V (I).
Fig. S8.
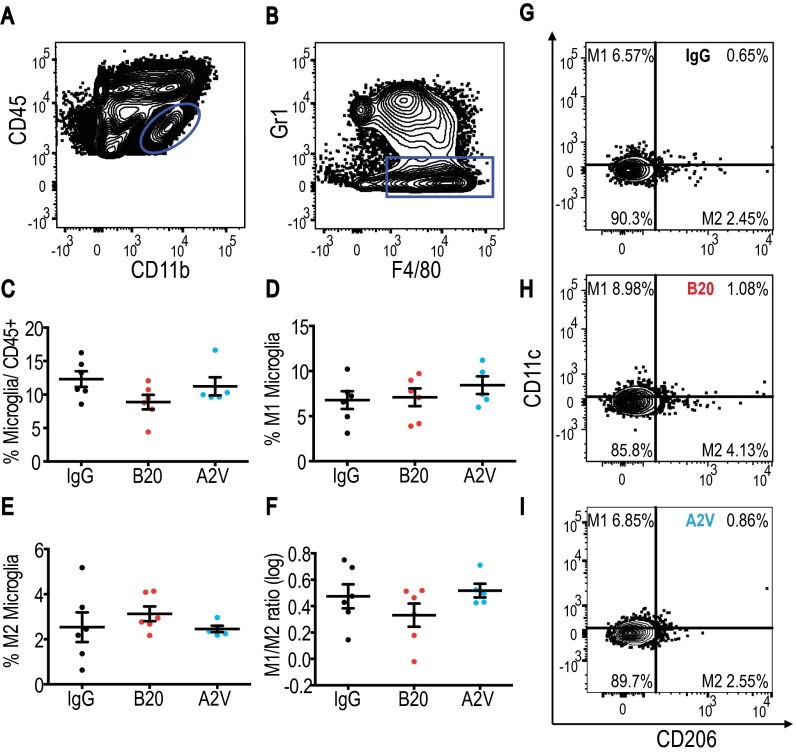
A trend toward increased M1 microglia is seen in Gl261 tumors treated with A2V. In all panels, IgG, n = 6; B20, n = 6; A2V, n = 5. (A and B) Gating through CD45low/CD11b+ (A) and then F4/80+/GR1− (B) identified microglia. (C) The total percentage of microglia was not changed by treatment with either B20 or A2V treatment as compared with control. (D) A trend toward an increase in M1 microglia was seen with A2V treatment as compared with IgG treatment. (E and F) The presence of M2 microglia and the ratio of M1 to M2 microglia were unchanged under treatment. (G–I) Representative gates for IgG (G), B20 (H), and A2V (I).
Fig. S9.
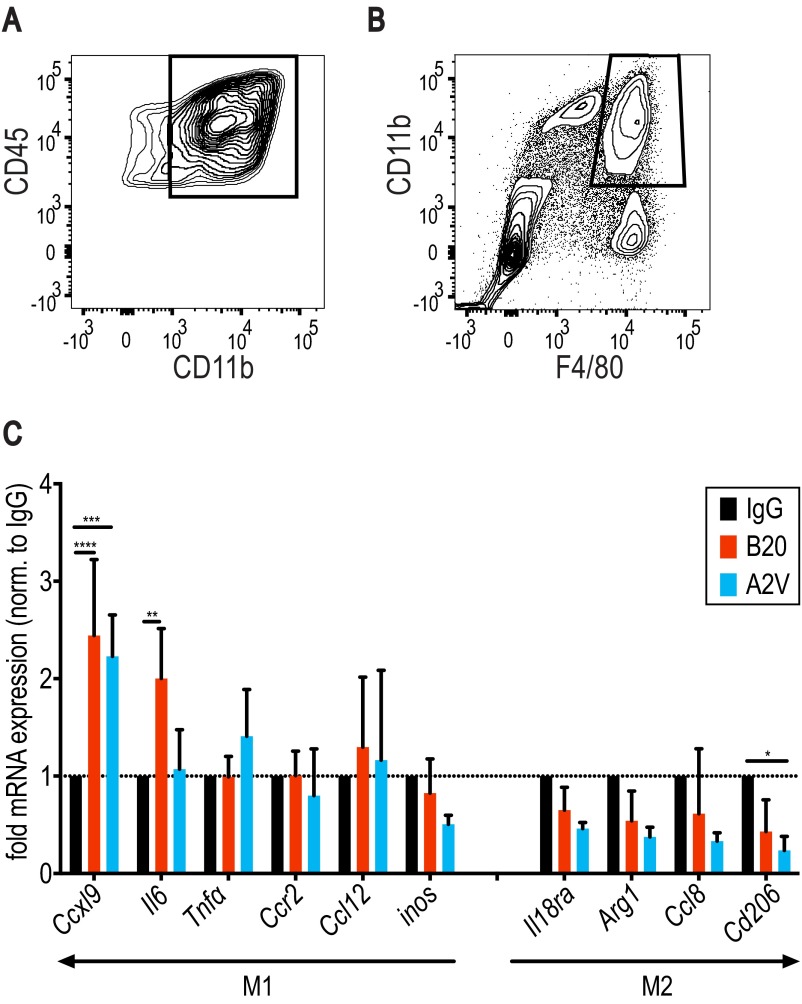
Gene expression in TAMs isolated from Gl261 tumors suggests a treatment-induced increase in M1 function-related genes and decreased expression of M2 TAM-associated genes. In all panels, IgG, n = 3; B20, n = 3; A2V, n = 3. (A and B) Gl261 TAMs were identified by gating through CD45 and CD11b (A) and further gating through CD11b and F4/80 (B). (C) Cxcl9 gene expression was increased in B20-treated (****P = <0.0001) and in A2V-treated (***P ≤ 0.0001) tumors as compared with IgG-treated tumors. Il6 expression was increased in B20-treated tumors compared with control (**P = 0.003). Compared with control, expression of the M2 marker CD206 was reduced by A2V treatment (*P = 0.03). Gene expression was normalized to gene expression levels in IgG-treated tumors (dotted horizontal line).
Fig. S10.
Treatment with B20 or A2V does not affect the presence of MDSCs in Gl261 or MGG8 tumors as compared with IgG treatment. In all Gl261 panels, IgG, n = 6; B20, n = 6; A2V, n = 5. (A and B) MDSCs were defined as CD45+/CD11bpos/GR1+/CD11b+. (C) No changes in MDSC presence were seen in Gl261 tumors. In all MGG8 panels, IgG, n = 4; B20, n = 7; A2V, n = 9. (D and E) Representative MDSC gates in the MGG8 tumor model. (F) The presence of MDSCs was not changed by treatment in the MGG8 model.
Fig. 5.
Treatment with A2V increases MGG8-tumor associated M1 macrophages and reduces M2 macrophages. In all panels, IgG, n = 4; B20, n = 7; A2V, n = 9. (A and B) Gating through CD45high/CD11b+ and F4/80+/GR1− identified macrophages. (C) Macrophage presence was not affected by treatment with B20 or A2V compared with IgG treatment. (D) The percentage of CD206low/CD11chigh M1-positive macrophages (as a percentage of total macrophages) in A2V-treated tumors was increased compared with percentages in IgG-treated tumors (***P < 0.001). Treatment with B20 increased M1 macrophages compared with IgG treatment (*P = 0.04). (E) The percentages of CD206high/CD11clow M2 macrophages was reduced by A2V treatment compared with IgG (***P < 0.001). B20 reduced M2 macrophages as compared with IgG treatment (*P = 0.02). (F) The ratio of M1/M2 macrophages was skewed by A2V treatment toward the M1 phenotype as compared with IgG treatment (**P = 0.002) and B20 treatment (**P = 0.008). (G–I) Representative gates for IgG (G), B20 (H), and A2V (I) to identify M1 and M2 macrophages.
Fig. S11.
Treatment with A2V increases M1-polarized TAMs, and treatment with B20 or A2V decreases M2 TAMs in MGG8 tumors. In all panels, IgG, n = 4; B20, n = 7; A2V, n = 9. (A and B) Gating through CD45high/CD11b+ (A) and F4/80+/GR1− (B) identified macrophages. (C) The total percentage of macrophages was not changed by treatment. (D) M1 macrophages were increased by A2V treatment compared with IgG treatment (*P = 0.02). (E) M2 macrophages were reduced by treatment with B20 compared with treatment with IgG (*P = 0.02) or A2V (*P = 0.02). (F) A2V treatment led to an increase in the M1/M2 macrophage ratio compared with IgG treatment (*P = 0.02). (G–I) Representative gates for IgG (G), B20 (H), and A2V (I).
Fig. S12.
Treatment with B20 or A2V increases M1 microglia in MGG8 tumors. In all panels, IgG, n = 4; B20, n = 7; A2V; n = 9. (A and B) Microglia were defined as CD45low/CD11b+/F4/80+/GR1−. (C) The total percentage of microglia trended toward an increase under treatment with either B20 or A2V compared with control. (D) A2V treatment increased M1 microglia compared with IgG treatment (***P ≤ 0.001). B20 increased M1 microglia compared with IgG treatment (*P = 0.01). (E) The presence of M2 microglia trended toward a decrease with A2V treatment compared with IgG treatment. (F) There was a trend toward an increased M1/M2 microglia ratio under treatment with A2V compared to IgG. (G–I) Representative gates for IgG (G), B20 (H), and A2V (I).
Discussion
To date, targeting the VEGF pathway has failed to prolong overall survival in GBM patients (2, 6, 7, 9). We and others have shown previously that the elevation of Ang-2 levels may compromise the benefits of anti-VEGF therapy in preclinical GBM models (10, 14). Here, we tested whether dual inhibition of VEGF (with B20) and Ang-2 (with LC06) with a bispecific antibody (A2V) could improve therapy outcome over antiangiogenic monotherapy. Our study shows that A2V inhibits tumor growth and prolongs the survival of mice bearing syngeneic or human xenograft tumors as compared with anti–Ang-2 or VEGF therapy alone. These results are consistent with the effects of anti–Ang-2/VEGF therapy in extracranial tumor models (14, 27–30, 40). We further demonstrate in the Gl261 model that A2V prunes pericyte-low immature vessels, reducing microvascular density. In addition, A2V may reduce microvessel density by inhibiting EC sprouting. HUVEC sprouting was induced by rVEGF and by rAng-2, and sprouting was abrogated by the neutralization of both factors with A2V. Importantly, sprouting induced by rAng-2 plus rVEGF was inhibited by B20 and was completely abrogated by A2V but not by LC06 monotherapy. Surprisingly, B20-mediated neutralization of VEGF abrogated the sprouting induced by VEGF as well as that induced by Ang-2. The efficacy of B20 in reducing Ang-2–induced sprouting is in line with the codependent function of Ang-2 and VEGF in this angiogenic process (11, 14).
Although A2V delays tumor growth, it fails to achieve long-term inhibition of Gl261 tumor growth. Our data suggest that pericyte-high (mature) vessels are resistant to B20 and A2V therapy and therefore may support sustained tumor growth (39, 41, 42). These results are in line with the effects of VEGF pathway inhibition described in preclinical tumors in our companion paper (43) and by others (42, 44), as well as our observations in breast cancer patients (45) that bevacizumab pruned vessels and normalized the remaining vasculature.
Many of the effects of dual anti–Ang-2/VEGF therapy—including the delay in tumor growth—were seen in a human GBM xenograft model (MGG8). In the MGG8 model, however, the benefits were more limited and occurred in the absence of any apparent antivascular effects. The differential vascular response to A2V in the Gl261 and the MGG8 models may be related to the structural differences in their vasculature; although Gl261 vessels are highly abnormal, MGG8 vessels are homogeneously distributed, and their architecture more closely resembles that of the normal mouse brain. Previously, it has been proposed that different blood vessel phenotypes exhibit differential susceptibility to anti-VEGF therapy (12, 46). Our results suggest that the tumor vessel phenotype also may be an important determinant of vascular response to dual anti–Ang-2/VEGF blockade, with immature vessels being most susceptible to therapy. Importantly, vascular phenotypes could be studied by imaging in GBM patients. For example, we demonstrated in clinical trials that vessel architectural imaging (VAI) could characterize the vascular phenotype and identify GBM patients who respond to anti-VEGF pathway inhibition (47, 48). Thus, VAI potentially may identify patients likely to benefit from the vascular component of dual anti–Ang-2/VEGF therapy.
In histological studies we detected no effects of either B20 or A2V on the rate of cancer cell apoptosis in either Gl261 or MGG8 tumors. This finding is confirmed further by the viability assays we conducted, showing no direct cytotoxic or cytostatic effects of A2V, and by data showing that the inhibition of the Tie2 pathway alone does not have cytotoxic effects in multiple tumor models (49). Indeed, neither Gl261 nor MGG8 express Tie2 (Fig. S4). However, A2V therapy reduced tumor cell proliferation as compared with B20 therapy both in Gl261 and MGG8 tumors, despite the differences in antivascular effects in these tumors.
Resident and infiltrating immune cells comprise a major component of the tumor microenvironment. Depending on the state of the disease or treatment, the immune compartment can either promote or inhibit tumor growth (50, 51). Among immune cells, the ability of T cells to eradicate tumor cells has been studied extensively (50). Treating tumors with mono (B20) or dual antiangiogenic therapy (A2V) did not alter the presence of T cells or the specific functional T-cell phenotype (effector versus regulatory) in the tumors (Fig. S5). These CD4+ and CD8+ T cells were highly proliferative and were in an activated state regardless of the treatment (Fig. S6), suggesting that these T cells did not specifically differ in their exhaustion/anergy. It also should be noted that natural killer (NK) cells can impart antitumor functions independent of CD8+ T-cell activation, although a previous report documented that NK cells have a lesser antitumor effect than CD8+ T cells in Gl261 tumors (52). In addition, we studied TAMs as an abundant immune cell component in GBMs that may home to tumors in an Ang-2–dependent manner (15, 16) and promote tumor growth (18, 53, 54). Our finding that A2V treatment reprograms TAMs along the M1–M2 continuum toward the M1 phenotype in both Gl261 and MGG8 tumors may explain the survival benefit observed in these preclinical models, including the benefits seen with anti–Ang-2 monotherapy. This finding could have implications for the sequencing of potential combinatorial regimens of antiangiogenic agents with immunotherapy, because M1-polarized macrophages and microglia may hamper the efficacy of oncolytic herpes simplex virus-1 GBM therapy (55). The role of TAMs in GBM progression is highlighted further by the data presented in our companion paper (43), in which we demonstrate that TAM depletion with anti–CSF-1 antibody compromises the survival benefit of dual antiangiogenic therapy (Table S2).
Table S2.
Summary of the complementary and distinct features of the two back-to-back articles
| Variables | Complementary features | Distinct features of ref. 43 | Distinct features of this article | Key points |
| Agents | These two complementary studies show the utility of Ang-2 inhibition – potentiation of anti-VEGF therapy and extension of the animal survival – irrespective of the mode of VEGF pathway inhibition or the specificity of the inhibitory agents. | In this study, we used an Angiopoietin-2 neutralizing antibody in combination with the VEGF-TKI cediranib, which also targets other kinases, such as, c-kit, PDGFRβ, and fibroblast growth factor receptor (FGFR)-1. | In this study, we used a bispecific antibody that neutralizes both VEGF and Angiopoietin-2 (A2V). This particular therapeutic approach is a highly targeted method with limited possibility of interaction with other pathways. | The results are important for the clinical translation of both approaches (i.e., antibody versus TKI blockade of VEGF pathway), which showed distinct activity in clinical trials in other disease settings. |
| GBM models | The GL261 tumor model was used in both studies because it is a syngeneic tumor model. In this manner, the studies showed comparable effects of the treatments tested. | In this study, we confirmed the results in the U87 xenograft model, which shows highly abnormal tumor vessels but virtually no invasion. | In this study, we confirmed the results in the patient-derived cell line MGG8, a “stem cell-like” highly invasive GBM model that displays little vascular abnormality. | Taken together, the data from these two studies address the key issue of GBM heterogeneity, by covering a broad spectrum of malignant behavior and vascular pathophysiology in GBMs. |
| Immunological studies | The two approaches of dual VEGF/Ang-2 targeting confirmed the change in the tumor-associated macrophage (TAM) phenotype along the M1-M2 continuum. | The anti-Ang2/VEGFR TKI combination therapy led to a change in TAM phenotype. | Bispecific antibody A2V reprograms TAMs clearly polarized toward the anti-tumor phenotype, and decreases M2 macrophages thereby alleviating immunosuppression. Also, this study shows that these effects extend to resident microglia. | Irrespective of the approach to dual VEGF/Ang-2 inhibition, this therapy can alter the phenotype of TAMs along the M1-M2 continuum. Taken together, the results from these studies reveal the range of TAM and microglia polarization in GBM. |
| This study demonstrates the causal role of TAMs in achieving a survival benefit of dual therapy. Using a CSF1 neutralizing Ab to block TAM infiltration, we show that dual therapy looses its efficacy against GBM. | This study demonstrates that achieving a survival benefit is independent of T cells by analyzing and depleting T cell population. | The two studies distinctly define two separate and complementary mechanisms involving anti-tumor immunity imparted by dual inhibition of VEGF and Ang-2 in GBM. |
Interestingly, reprogramming of the overall TAM population by A2V was largely attributable to recruited TAMs in Gl261 tumors and not to resident microglia. In contrast, we observed reprogramming of resident microglia-derived TAMs in the MGG8 tumors in SCID mice. The reprogramming may be caused by the large presence of microglia populations in SCID mice bearing MGG8 tumors as compared with C57BL mice bearing Gl261 tumors, in line with published data (56).
In summary, we show that dual Ang-2/VEGF blockade can increase the survival of mice bearing GBM over anti-VEGF therapy alone. This increased survival may be the result of the reprogramming of GBM-associated TAMs from the protumor M2 phenotype toward the antitumor M1 phenotype, as observed in both syngeneic murine tumors and human tumor xenografts. In GBMs with a high degree of vascular abnormality, this dual blockade approach also caused antivascular effects. These data support the development of anti–Ang-2/VEGF blockade for GBM alone or with immunotherapy (49, 57).
Materials and Methods
C57BL/6 mouse-syngeneic Gl261 cells (Frederick National Laboratory, National Cancer Institute) and human MGG8 GBM cells (58) were stereotactically implanted in the brains of male C57BL/6 mice and SCID mice, respectively. Tumor size was assessed by measuring circulating Gluc (35) activity in the blood. Treatment was initiated at a predefined Gluc blood activity (Fig. S3 A and D), and tumor burden was measured over time by serial blood Gluc measurements. Animals were treated with IgG, LC06 (Ang-2 antibody), B20 (VEGF antibody), or A2V (bispecific Ang-2/VEGF, CrossMab;) once weekly i.p. at 10 mg/kg. Brains were harvested at the described time points after injection of EdU and were paraffin embedded for histological analyses. The tissues were assessed for cell proliferation (EdU), microvessel density (CD31), and pericyte coverage (desmin). All animal procedures followed Public Health Service Policy on Humane Care of Laboratory Animals guidelines and were approved by the Massachusetts General Hospital Institutional Animal Care and Use Committee. The use of patient samples was approved by the internal review board of Massachusetts General Hospital. Experimental procedures and methods are described in detail in SI Materials and Methods.
SI Materials and Methods
Reagents, Cell Lines, and Animal Models.
The murine Gl261 GBM cell line (Gl261-WT) was provided by the Frederick National Laboratory (National Cancer Institute, NCI). MGG8, a cell line derived from a GBM patient, was previously established in the Department of Neurosurgery at Massachusetts General Hospital (MGH) (58). All tumor cell lines were grown in serum-free conditions using the NeuroCult NS-A proliferation kit (Stemcell Technologies) in a humidified atmosphere of 5% CO2 and 95% air at 37 °C. All cell lines were repeatedly tested and were negative for mycoplasma using the Mycoalert Plus Mycoplasma Detection Kit (Lonza) and were authenticated before use by IDEXX Laboratories. HUVECs were acquired from the Center for Excellence in Vascular Biology, Brigham and Women’s Hospital, Harvard Medical School, and were maintained in EGM medium [2% FBS, brain bovine extract, heparin, human EGF (hEGF), and hydrocortisone] (Lonza)]. Gl261- Discosoma red fluorescent protein (dsRed), Gl261-GFP-Gluc, and MGG8-GFP-Gluc cell lines were generated by transducing WT cells with a lentiviral construct of either dsRed or GFP and Gluc (35), provided by the MGH vector core. To generate orthotopic tumors, ∼500,000 tumor cells were implanted stereotactically into the left striatum of 8- to 10-wk-old male C57BL/6 mice (for Gl261-GFP-Gluc) or male SCID mice (for MGG8-GFP-Gluc) 2 mm left of the sagittal suture, 0.1 mm rostral of the bregma, and at a depth of 2 mm from the brain surface.
Tumor Size Monitoring and Treatment Protocols.
Tumor growth in vivo was assessed using the established Gluc blood activity assay (35–37). Blood Gluc activity was measured with a Promega GloMax 96 microplate luminometer (Fisher Scientific) and was correlated with tumor volume as measured by an sVevo 2100 micro ultrasound unit (VisualSonics) through cranial windows in tumor-bearing mice (59). For experiments with Gl261-GFP-Gluc and MGG8-GFP-Gluc, treatment was initiated at a blood Gluc activity of 50,000 relative light units (RLU)/s and 250,000 RLU/s, respectively, both corresponding to tumor volumes of ∼8–12 mm3 (Fig. S3 A and D) when tumor growth is angiogenesis dependent (60). Gl261 tumors reached treatment initiation size at a median of 12 days after implantation and MGG8 tumors reached treatment initiation size after a median of 26 days. Tumor-bearing mice were treated with omalizumab (IgG, Xolair; Genentech/Novartis), B20-4.1 (B20, anti-VEGF-A mAb; Genentech/Hoffmann La-Roche) (61), or the newly generated murine IgG2a-chimeric variant of an Ang-2/VEGF bispecific antibody (A2V; Hoffmann La-Roche) (28). All antibodies neutralize human and murine target proteins and were administered i.p. at a dose of 10 mg/kg based on previously published data (28, 62). Animals were treated until they were killed because of the occurrence of lethargy, body weight loss of >20%, or impairing neurological symptoms or when the predetermined study end point was reached.
The murine-chimeric anti-Ang2/VEGF bispecific antibody is a derivate of the previously described human anti-Ang2/VEGF CrossMab (63). Because the human bispecific antibody is not mouse cross-reactive regarding the Avastin-based VEGF binding moiety (28), a surrogate CrossMab with mouse VEGF reactivity was generated. The VEGF binding moiety of the surrogate was based on the antibody B20-4.1 (61). The surrogate CrossMab was created using a stepwise domain-exchange approach. First, the Avastin antibody-variable domains of the lead were exchanged for the variable domains of B20-4.1. In the next step, the constant human IgG1 domains of the Fc part and the Fab part of the VEGF-binding moiety of the lead were exchanged for mouse IgG2a constant domains. The knob-into-hole mutations in the human CH3 domains were transferred into the mouse IgG2a sequence following sequence and structure alignment of the human IgG1 and mouse IgG2a CH3 domains. As a last step, the crossed CH1 and Cκ domains of the angiopoietin-binding moiety were exchanged for murine CH1 and Cκ domains in a crossed orientation. The resulting chimeric CrossMab molecule with human variable domains and murine constant domains was mouse angiopoietin and VEGF reactive and was used in the in vivo studies described here.
Antibody genes were ordered as gene syntheses and cloned via unique restriction sites using standard cloning procedures into separate expression vectors enabling secretory expression in HEK cells growing in suspension. HEK293-F cells (Invitrogen) were transfected according to the cell supplier’s instructions using Maxiprep (Qiagen) preparations of the antibody vectors, Opti-MEM I medium (Invitrogen), and 293fectin (Invitrogen). Then the recombinant antibodies were produced in serum-free FreeStyle 293 expression medium (Invitrogen) over 6 d.
For transient expression of murine-chimeric anti-Ang2/VEGF, transfected HEK cells were cultivated in stirred 10-L fermenters. Antibody-containing cell-culture supernatants were harvested by centrifugation and sterile filtrated. The protein was purified from supernatants referring to standard protocols; Protein A, hydrophobic interaction, and ion exchange chromatography were applied. Purified murine-chimeric CrossMab was concentrated and diafiltrated by membrane-based tangential flow filtration. The protein concentration was determined by measuring the OD at 280 nm, using a molar extinction coefficient calculated according to Pace et al. (64). The bispecific antibody was characterized analytically by SDS/PAGE, size-exclusion chromatography, and mass spectrometry. In addition, surface plasmon resonance analysis was used to demonstrate the target specificity and high affinity of the murine-chimeric anti-Ang2/VEGF CrossMab (63). The bispecific antibody was stored in 20 mM histidine, 140 mM NaCl (pH 6.0) at −80 °C at a concentration of 3 mg/mL. Endotoxin levels of the stock solution were below 0.2 E U/mL.
In Silico Analysis of Ang-2 and VEGF mRNA Expression.
To assess Ang-2 and VEGF mRNA expression in antiangiogenic therapy-naive human GBM and normal brain tissue, we analyzed two publicly available gene-expression datasets: TCGA dataset 540 (33) and GSE 7696 (32). The R2 microarray analysis and visualization tool provided by the Department of Human Genetics of the Academic Medical Centre, Amsterdam (r2.amc.nl) was used to assess gene expression.
Clinical Tissue Specimens.
Twelve clinical specimens of treatment-naive nGBM were obtained from the Department of Pathology and/or from the neuro-oncology repository at MGH after obtaining informed consent. Ang-2 staining was performed, and tissue samples were reviewed by a neuropathologist (M.S.). De-identified clinical information was gathered from the patients’ medical records. Analyses were approved by the Institutional Review Board at MGH.
Microfluidic Sprouting Assay.
The microfluidic device was comprised of poly(dimethylsiloxane) (Sylgard 184; Dow Corning) and was fabricated as previously described (65) using soft lithography (66) to produce monolithic microchannels that are 50 µm in height. Briefly, the center channel contains a localized region of a mixture of 3D collagen gel (3 mg/mL, pH = 7.4; type I, rat tail, pH = 7.4) and fibronectin (10 mg/mL) (both from BD Biosciences) in the central channel. The collagen/fibronectin solution (henceforth referred to as “collagen gel solution”) was allowed to polymerize at 37 °C for 48–72 h under hydrated conditions.
HUVECs were maintained in EGM medium (2% FBS, brain bovine extract, heparin, hEGF, and hydrocortisone) (Lonza) and were stably transduced with GFP (67). Following collagen gel polymerization and before cell seeding, the two parallel channels directly adjacent to the central collagen channel (“HUVEC channels”) were coated with fibronectin (10 mg/mL) for 3 h. Subsequently, a concentrated solution (∼10 million cells/mL) of HUVECs at passage number 5–10 was introduced into the entire length of both HUVEC channels. HUVECs attach to the channel walls and then spread and migrate to cover all surfaces of the channels, including the collagen exposed in the multiple perpendicular apertures that are 100 µm wide and spaced 500 µm apart center-to-center (67); it is at these interfaces that sprouting can occur. The HUVECs were grown to confluence 24–48 h after seeding. To stimulate sprouting of HUVECs into the 3D collagen gel, we treated the cells with recombinant human VEGF or Ang-2 (both from R&D Systems) alone or in combination and at a concentration of 50 ng/mL. To neutralize VEGF and/or Ang-2 activity, we treated with the cells with B20 or A2V at 50 ng/mL. Three days after sprouting was stimulated, images were acquired with an epifluorescence microscope (Olympus IX70, 10× objective, PRIOR automated stage). To visualize the entire area of the device at high resolution, 10× images from multiple adjacent fields were spliced together automatically using Adobe Photoshop to form a mosaic image used for quantification using ImageJ (67).
Histology and Immunohistochemistry.
Whole brains were harvested after intracardiac perfusion with 4% formaldehyde in PBS. Tissue then was fixed overnight in 4% formaldehyde/PBS, embedded in paraffin, and mounted on glass in 5-μm-thick sections. Before immunohistochemistry, tissue was deparaffinized, and antigen retrieval was performed in a pH 9 solution (DAKO) at 96 °C. To prevent nonspecific staining, sections were incubated with 5% normal donkey serum in PBS (Jackson ImmunoResearch) before incubation with the respective primary and secondary antibodies.
Endothelial cells were detected with an anti-CD31 mAb (DIA-310, 1:20; DIANOVA), and desmin-positive pericytes were detected using the mAb AF3844 (1:500; R&D Systems). Secondary fluorescent antibodies were used at a concentration of 1:200 (Jackson ImmunoResearch). Proliferation was measured using the Click-iT EdU Alexa Fluor 647 Imaging Kit (Invitrogen). For the EdU Click-iT method, animals were injected with EdU i.p. 2 h before they were killed. Apoptotic cells were detected using the ApopTag Red In Situ Apoptosis Detection Kit (EMD Millipore). EdU/DAPI double-positive cells were defined as proliferating cells. ApopTag/DAPI double-positive cells were defined as apoptotic cells. Digitization of whole tumor sections was performed with a Zeiss Axio Imager 2 upright microscope with a motorized Ludl stage (Zeiss). Mosaic TIFF images of immunofluorescently stained tissue sections were generated using the TissueFAXS software (TissueGnostics, Vienna, Austria). All histological analyses were performed using ImageJ software, version 1.48 (NIH).
To measure vessel diameter, thresholds were set for tumor sections stained for CD31, and regions of interest (ROIs) were generated around CD31+ vessels. Minimum Feret’s diameter was used as an approximation for vessel diameter. Vessel pericyte coverage analysis was based on CD31/desmin costaining. Briefly, thresholds were set for both the CD31 and the desmin channels, and binary images and ROIs around CD31+ vessels were generated. Following dilation steps, enlarged CD31 ROIs were superposed on desmin binary images, and the desmin-positive area in each vessel ROI was measured. Pericyte coverage was measured for each individual tumor vessel in one tumor cross-section and was defined as the total number of desmin-positive pixels per vessel perimeter (pixel); average pericyte coverage (pixel/pixel) was plotted. Low vs. high vessel pericyte coverage was defined based on IgG-treated tumors: The mean vessel pericyte coverage in IgG tumors was used as a threshold. Across treatment groups, vessels with pericyte coverage above this threshold were defined as high pericyte, and vessels with pericyte coverage below this threshold were defined as low pericyte.
In Vitro Testing of Direct Antibody Effects.
Gl261 GFP-Gluc cells were grown in nonadherent conditions using the NeuroCult NS-A proliferation kit (Stemcell Technologies) under standard cell-culture conditions, in a humidified atmosphere of 5% CO2 and 95% air at 37 °C. Cell aggregates were mechanically dissociated to produce a single-cell solution, and 10,000 cells per well were plated in 50 µL neurocult media in a standard 96-well plate. Antibody solutions were prepared in NeuroCult complete medium (Stemcell Technologies), and 50 µL was added to each well to produce the desired final antibody solution. After 72 h of incubation in culture conditions, 75 µL of the 3-[4,5-dimethylthiazol-2-yl]-2,5-diphenyltetrazolium bromide] (MTT) assay solution (Sigma) was added to each well, at a final concentration of 15%. Cells were kept under culture conditions for 3.5 h, and the assay was stopped by the addition of 100 µL DMSO to each well. Plates were kept at room temperature in darkness, and UV emission at 562 nm was measured within 24 h.
Flow Cytometry Analysis.
Gl261 and MGG8 tumors were stereotactically and orthotopically implanted and treated as described above. On day 10 after treatment start, brains were harvested, and tumors were microsurgically isolated under a stereo-fluorescent microscope (Stereo Discovery V20; Zeiss). Tumors were placed immediately in HBSS (Thermo Fisher Scientific), and a single-cell suspension was produced by manual mincing, followed by 60 min of enzymatic digestion at room temperature with Accumax (Innovative Stem Cell Technologies) enzyme solution. Samples then were individually filtered through 70-μm nylon strainers (Fisher Scientific) and incubated for 10 min on ice with rat anti-mouse CD16/CD32 mAb (1:500, clone 2.4G2/93) (BioLegend) in PBS containing 2% BSA (Sigma). After cell counting, samples were incubated for 45 min on ice in darkness with the following conjugated antibodies: Thy1 BV605 (clone 53-2.1; eBioscience), CD4 APC Cy7 (clone GK1.5; eBioscience), CD8a BV650 (clone 53-6.7; BioLegend), CD44 PercP Cy5.5 (clone IM7; eBioscience), FoxP3 eF450 (clone FJK-165; eBioscience), PercP-Cy5 CD45 (clone D7; eBioscience), BV510 CD11b (clone M1/70; BioLegend), PE-F4/80 (clone BM8; BioLegend), BUV 395 GR1 (clone RB6-8C5; BD Biosciences), APC-Cy7 CD11c (clone HL3; BD Biosciences), MRC1 (CD206), and BV421 (clone C068C2; R&D Systems). Intracellular staining for FoxP3 and Ki-67 was performed after cellular permeabilization. Briefly, cells were fixed using a Foxp3/Transcription Factor Staining Buffer Set (eBioscience) for 15 min, followed by the addition of permeabilization buffer. Cells were recovered by centrifugation, and FoxP3 antibody, diluted (1:100) in permeabilization buffer, was added to cells for 20 min. After washing steps with 2% BSA, the cells were filtered, and flow cytometry was performed on 1–1.5 million cells per individual sample on an LSRII (BD Biosciences). Intracellular staining was carried out using a primary antibody against Ki-67 (BD Biosciences) and counterstaining with Alexa Fluor 700 streptavidin conjugate (Thermo Fisher Scientific). All flow cytometric analyses were performed post hoc using FlowJo software version 10.0.7. Viable cells were identified based on side and forward scatter. CD4 cells were defined as CD4+/Thy1+/CD44+, and CD8 cells were defined as CD8+/Thy1+/CD44+s. FoxP3+ cells were defined as activated CD4 cells. Gating through CD45high/CD11b+ and F4/80+/GR1− cells defined macrophages, and percentages were normalized to CD45+ cells. M1 macrophages were defined as CD11chigh/CD206low, and M2 macrophages were defined as CD11clow/CD206high and were normalized to the total number of macrophages. Resident microglia were defined as CD45low/CD11b+/F4/80+/GR1−, and percentages were calculated over CD45+ cells. M1-type microglia were defined as CD11chigh/CD206low, and M2-type microglia were defined as CD11clow/CD206high and were displayed as the percentage of total microglia. For macrophage gene expression analyses from Gl261 tumors treated for 10 d, CD45high/CD11b+/F4/80+ macrophages were sorted into lysis buffer (Qiagen). Following RNA extraction using the RNeasy kit (Qiagen), TaqMan PCR was performed for the indicated genes, and mRNA expression was normalized to the expression levels in IgG-treated tumors. MDSCs were defined as CD45+/CD11b+/GR1+/CD11b+ and were normalized to total CD45+ cells.
Statistical Analysis.
Data are expressed as mean ± SEM. All statistical tests were two-sided, and results were considered statistically significant at P < 0.05. Significant outliers were detected using the robust regression and outlier removal (ROUT) method with a set false-discovery rate of 1%. In survival analyses, HRs and CIs were calculated using the nonparametric log-rank test. The Pearson correlation coefficient (PCC) r was calculated to analyze a linear relationship between two variables. Mixed models with fixed and random effects were used for tumor growth analyses. Statistical analyses for all other experiments were performed using unpaired t tests or, when more than two groups were assessed, by ANOVA followed by Tukey’s post hoc tests for multiple comparisons. Statistical analyses were performed using SAS (SAS Institute Inc.) or Prism (GraphPad Software Inc.) software in collaboration with a biostatistician (A.M.).
Acknowledgments
We thank T. J. Diefenbach and the Ragon Institute Imaging Core (Harvard Center for AIDS Research Immunology Core) for technical and instrumental support for microscopy; B. A. Tannous for technical support with the Gluc-GFP reporter system; M. Duquette, S. Roberge, P. Huang, A. Khachatryan, M. Tedy, O. Pulluqi, I. Gorr, S. Imhof-Jung, H. Dürr, T. v. Hirschheydt, M. Molhoj, H. Kettenberger, J. Moelleken, and H. Auer for outstanding technical assistance; and S. Chatterjee, M. Badeaux, S. Babykutty, T. Hato, D. Kodack, G. B. Ferraro, S. S. Islam, T. Mempel, T. Padera, Y. Huang, T. Peterson, S. M. Chin, S. Kozin, M. Thomas, K. Munro, M. Weidner, and H. J. Mueller for invaluable suggestions and experimental assistance. The study was supported in part by NIH Grants P50CA165962 (to T.T.B and R.K.J.), P01CA080124 (to R.K.J., D.G.D., D.F., and L.L.M.), KCA125440 (to T.T.B.), R01CA126642 and R35CA197743 (to R.K.J.), R01CA159258 (to D.G.D.), R01CA096915 (to D.F.), R01HL106584 (to L.L.M.), and S10-RR027070 (to D.F.); National Cancer Institute/Federal Share Proton Beam Program Income (R.K.J.); Department of Defense Breast Cancer Research Innovator Award W81XWH-10-1-0016 and National Foundation for Cancer Research Fellow Award (to R.K.J.); and a research grant from Hoffmann-La Roche. N.D.K. was supported by NIH Training Grant T32-CA073479. M.S., C.L.-E., and J.W.T. were supported by NIH Training Grant K12CA090354. J.K. received fellowships from the German Research Foundation (DFG) and the Solidar-Immun Foundation. L.R. received a Mildred Scheel Fellowship (Deutsche Krebshilfe). Z.A. received a fellowship from the Aid for Cancer Research Foundation. G.S. was supported by Susan G. Komen Postdoctoral Fellowship PDF14301739. M.S. received research support from Affymetrix. V.A. received financial support from the DFG.
Footnotes
Conflict of interest statement: R.K.J. received consultant fees from Ophthotech, SPARC, SynDevRx, and XTuit. R.K.J. owns equity in Enlight, Ophthotech, SynDevRx, and XTuit and serves on the Board of Directors of XTuit and on the Boards of Trustees of Tekla Healthcare Investors, Tekla Life Sciences Investors, Tekla Healthcare Opportunities Fund, and Tekla World Healthcare Fund. No reagents or funding from these companies was used in these studies. T.T.B. received consultant fees from Merck, Roche, Kirin Pharmaceuticals, Spectrum Pharmaceuticals, Novartis, and Champions Biotechnology. K.G.S. and O.K. are employees of Roche.
This article contains supporting information online at www.pnas.org/lookup/suppl/doi:10.1073/pnas.1525360113/-/DCSupplemental.
References
- 1.Stupp R, et al. European Organisation for Research and Treatment of Cancer Brain Tumor and Radiotherapy Groups; National Cancer Institute of Canada Clinical Trials Group Radiotherapy plus concomitant and adjuvant temozolomide for glioblastoma. N Engl J Med. 2005;352(10):987–996. doi: 10.1056/NEJMoa043330. [DOI] [PubMed] [Google Scholar]
- 2.Lu-Emerson C, et al. Lessons from anti-vascular endothelial growth factor and anti-vascular endothelial growth factor receptor trials in patients with glioblastoma. J Clin Oncol. 2015;33(10):1197–1213. doi: 10.1200/JCO.2014.55.9575. [DOI] [PMC free article] [PubMed] [Google Scholar]
- 3.Cohen MH, Shen YL, Keegan P, Pazdur R. FDA drug approval summary: Bevacizumab (Avastin) as treatment of recurrent glioblastoma multiforme. Oncologist. 2009;14(11):1131–1138. doi: 10.1634/theoncologist.2009-0121. [DOI] [PubMed] [Google Scholar]
- 4.Kreisl TN, et al. Phase II trial of single-agent bevacizumab followed by bevacizumab plus irinotecan at tumor progression in recurrent glioblastoma. J Clin Oncol. 2009;27(5):740–745. doi: 10.1200/JCO.2008.16.3055. [DOI] [PMC free article] [PubMed] [Google Scholar]
- 5.Friedman HS, et al. Bevacizumab alone and in combination with irinotecan in recurrent glioblastoma. J Clin Oncol. 2009;27(28):4733–4740. doi: 10.1200/JCO.2008.19.8721. [DOI] [PubMed] [Google Scholar]
- 6.Gilbert MR, et al. A randomized trial of bevacizumab for newly diagnosed glioblastoma. N Engl J Med. 2014;370(8):699–708. doi: 10.1056/NEJMoa1308573. [DOI] [PMC free article] [PubMed] [Google Scholar]
- 7.Chinot OL, et al. Bevacizumab plus radiotherapy-temozolomide for newly diagnosed glioblastoma. N Engl J Med. 2014;370(8):709–722. doi: 10.1056/NEJMoa1308345. [DOI] [PubMed] [Google Scholar]
- 8.Batchelor TT, et al. Phase III randomized trial comparing the efficacy of cediranib as monotherapy, and in combination with lomustine, versus lomustine alone in patients with recurrent glioblastoma. J Clin Oncol. 2013;31(26):3212–3218. doi: 10.1200/JCO.2012.47.2464. [DOI] [PMC free article] [PubMed] [Google Scholar]
- 9.Wick W, et al. LB-05 * phase III trial exploring the combination of bevacizumab and lomustine in patients with first recurrence of a glioblastoma: The EORTC 26101 trial. Neuro-oncol. 2015;17(suppl 5):v1–v1. [Google Scholar]
- 10.Chae S-S, et al. Angiopoietin-2 interferes with anti-VEGFR2-induced vessel normalization and survival benefit in mice bearing gliomas. Clin Cancer Res. 2010;16(14):3618–3627. doi: 10.1158/1078-0432.CCR-09-3073. [DOI] [PMC free article] [PubMed] [Google Scholar]
- 11.Maisonpierre PC, et al. Angiopoietin-2, a natural antagonist for Tie2 that disrupts in vivo angiogenesis. Science. 1997;277(5322):55–60. doi: 10.1126/science.277.5322.55. [DOI] [PubMed] [Google Scholar]
- 12.Sitohy B, Nagy JA, Dvorak HF. Anti-VEGF/VEGFR therapy for cancer: Reassessing the target. Cancer Res. 2012;72(8):1909–1914. doi: 10.1158/0008-5472.CAN-11-3406. [DOI] [PMC free article] [PubMed] [Google Scholar]
- 13.Augustin HG, Koh GY, Thurston G, Alitalo K. Control of vascular morphogenesis and homeostasis through the angiopoietin-Tie system. Nat Rev Mol Cell Biol. 2009;10(3):165–177. doi: 10.1038/nrm2639. [DOI] [PubMed] [Google Scholar]
- 14.Daly C, et al. Angiopoietin-2 functions as a Tie2 agonist in tumor models, where it limits the effects of VEGF inhibition. Cancer Res. 2013;73(1):108–118. doi: 10.1158/0008-5472.CAN-12-2064. [DOI] [PubMed] [Google Scholar]
- 15.Venneri MA, et al. Identification of proangiogenic TIE2-expressing monocytes (TEMs) in human peripheral blood and cancer. Blood. 2007;109(12):5276–5285. doi: 10.1182/blood-2006-10-053504. [DOI] [PubMed] [Google Scholar]
- 16.Gabrusiewicz K, et al. Anti-vascular endothelial growth factor therapy-induced glioma invasion is associated with accumulation of Tie2-expressing monocytes. Oncotarget. 2014;5(8):2208–2220. doi: 10.18632/oncotarget.1893. [DOI] [PMC free article] [PubMed] [Google Scholar]
- 17.Kostianovsky AM, Maier LM, Anderson RC, Bruce JN, Anderson DE. Astrocytic regulation of human monocytic/microglial activation. J Immunol. 2008;181(8):5425–5432. doi: 10.4049/jimmunol.181.8.5425. [DOI] [PubMed] [Google Scholar]
- 18.Li W, Graeber MB. The molecular profile of microglia under the influence of glioma. Neuro-oncol. 2012;14(8):958–978. doi: 10.1093/neuonc/nos116. [DOI] [PMC free article] [PubMed] [Google Scholar]
- 19.Coffelt SB, et al. Angiopoietin 2 stimulates TIE2-expressing monocytes to suppress T cell activation and to promote regulatory T cell expansion. J Immunol. 2011;186(7):4183–4190. doi: 10.4049/jimmunol.1002802. [DOI] [PubMed] [Google Scholar]
- 20.De Palma M, et al. Tie2 identifies a hematopoietic lineage of proangiogenic monocytes required for tumor vessel formation and a mesenchymal population of pericyte progenitors. Cancer Cell. 2005;8(3):211–226. doi: 10.1016/j.ccr.2005.08.002. [DOI] [PubMed] [Google Scholar]
- 21.Pucci F, et al. A distinguishing gene signature shared by tumor-infiltrating Tie2-expressing monocytes, blood “resident” monocytes, and embryonic macrophages suggests common functions and developmental relationships. Blood. 2009;114(4):901–914. doi: 10.1182/blood-2009-01-200931. [DOI] [PubMed] [Google Scholar]
- 22.Coffelt SB, et al. Angiopoietin-2 regulates gene expression in TIE2-expressing monocytes and augments their inherent proangiogenic functions. Cancer Res. 2010;70(13):5270–5280. doi: 10.1158/0008-5472.CAN-10-0012. [DOI] [PubMed] [Google Scholar]
- 23.Sica A, Mantovani A. Macrophage plasticity and polarization: In vivo veritas. J Clin Invest. 2012;122(3):787–795. doi: 10.1172/JCI59643. [DOI] [PMC free article] [PubMed] [Google Scholar]
- 24.Noy R, Pollard JW. Tumor-associated macrophages: From mechanisms to therapy. Immunity. 2014;41(1):49–61. doi: 10.1016/j.immuni.2014.06.010. [DOI] [PMC free article] [PubMed] [Google Scholar]
- 25.Mantovani A, Allavena P. The interaction of anticancer therapies with tumor-associated macrophages. J Exp Med. 2015;212(4):435–445. doi: 10.1084/jem.20150295. [DOI] [PMC free article] [PubMed] [Google Scholar]
- 26.Lu-Emerson C, et al. Increase in tumor-associated macrophages after antiangiogenic therapy is associated with poor survival among patients with recurrent glioblastoma. Neuro-oncol. 2013;15(8):1079–1087. doi: 10.1093/neuonc/not082. [DOI] [PMC free article] [PubMed] [Google Scholar]
- 27.Brown JL, et al. A human monoclonal anti-ANG2 antibody leads to broad antitumor activity in combination with VEGF inhibitors and chemotherapy agents in preclinical models. Mol Cancer Ther. 2010;9(1):145–156. doi: 10.1158/1535-7163.MCT-09-0554. [DOI] [PubMed] [Google Scholar]
- 28.Kienast Y, et al. Ang-2-VEGF-A CrossMab, a novel bispecific human IgG1 antibody blocking VEGF-A and Ang-2 functions simultaneously, mediates potent antitumor, antiangiogenic, and antimetastatic efficacy. Clin Cancer Res. 2013;19(24):6730–6740. doi: 10.1158/1078-0432.CCR-13-0081. [DOI] [PubMed] [Google Scholar]
- 29.Rigamonti N, et al. Role of angiopoietin-2 in adaptive tumor resistance to VEGF signaling blockade. Cell Reports. 2014;8(3):696–706. doi: 10.1016/j.celrep.2014.06.059. [DOI] [PubMed] [Google Scholar]
- 30.Hashizume H, et al. Complementary actions of inhibitors of angiopoietin-2 and VEGF on tumor angiogenesis and growth. Cancer Res. 2010;70(6):2213–2223. doi: 10.1158/0008-5472.CAN-09-1977. [DOI] [PMC free article] [PubMed] [Google Scholar]
- 31.Hidalgo M, et al. 2014. Results from the first-in-human (FIH) phase I study of RO5520985 (RG7221), a novel bispecific human anti-ANG-2/anti-VEGF-A antibody, administered as an intravenous infusion to patients with advanced solid tumors. ASCO Meeting Abstracts 32(15_suppl):2525.
- 32.Murat A, et al. Stem cell-related “self-renewal” signature and high epidermal growth factor receptor expression associated with resistance to concomitant chemoradiotherapy in glioblastoma. J Clin Oncol. 2008;26(18):3015–3024. doi: 10.1200/JCO.2007.15.7164. [DOI] [PubMed] [Google Scholar]
- 33.Lambiv WL, et al. The Wnt inhibitory factor 1 (WIF1) is targeted in glioblastoma and has a tumor suppressing function potentially by induction of senescence. Neuro-oncol. 2011;13(7):736–747. doi: 10.1093/neuonc/nor036. [DOI] [PMC free article] [PubMed] [Google Scholar]
- 34.Barrett T, et al. NCBI GEO: Archive for functional genomics data sets--update. Nucleic Acids Res. 2013;41(Database issue):D991–D995. doi: 10.1093/nar/gks1193. [DOI] [PMC free article] [PubMed] [Google Scholar]
- 35.Wurdinger T, et al. A secreted luciferase for ex vivo monitoring of in vivo processes. Nat Methods. 2008;5(2):171–173. doi: 10.1038/nmeth.1177. [DOI] [PMC free article] [PubMed] [Google Scholar]
- 36.Tannous BA. Gaussia luciferase reporter assay for monitoring biological processes in culture and in vivo. Nat Protoc. 2009;4(4):582–591. doi: 10.1038/nprot.2009.28. [DOI] [PMC free article] [PubMed] [Google Scholar]
- 37.Kodack DP, et al. Combined targeting of HER2 and VEGFR2 for effective treatment of HER2-amplified breast cancer brain metastases. Proc Natl Acad Sci USA. 2012;109(45):E3119–E3127. doi: 10.1073/pnas.1216078109. [DOI] [PMC free article] [PubMed] [Google Scholar]
- 38.Carmeliet P, Jain RK. Principles and mechanisms of vessel normalization for cancer and other angiogenic diseases. Nat Rev Drug Discov. 2011;10(6):417–427. doi: 10.1038/nrd3455. [DOI] [PubMed] [Google Scholar]
- 39.Jain RK. Antiangiogenesis strategies revisited: From starving tumors to alleviating hypoxia. Cancer Cell. 2014;26(5):605–622. doi: 10.1016/j.ccell.2014.10.006. [DOI] [PMC free article] [PubMed] [Google Scholar]
- 40.Keskin D, et al. Targeting vascular pericytes in hypoxic tumors increases lung metastasis via angiopoietin-2. Cell Reports. 2015;10(7):1066–1081. doi: 10.1016/j.celrep.2015.01.035. [DOI] [PMC free article] [PubMed] [Google Scholar]
- 41.Carmeliet P, Jain RK. Molecular mechanisms and clinical applications of angiogenesis. Nature. 2011;473(7347):298–307. doi: 10.1038/nature10144. [DOI] [PMC free article] [PubMed] [Google Scholar]
- 42.Dvorak HF. Tumor Stroma, Tumor Blood Vessels, and Antiangiogenesis Therapy. Cancer J. 2015;21(4):237–243. doi: 10.1097/PPO.0000000000000124. [DOI] [PubMed] [Google Scholar]
- 43.Peterson TE, et al. Dual inhibition of Ang-2 and VEGF receptors normalizes tumor vasculature and prolongs survival in glioblastoma by altering macrophages. Proc Natl Acad Sci USA. 2016;113:4470–4475. doi: 10.1073/pnas.1525349113. [DOI] [PMC free article] [PubMed] [Google Scholar]
- 44.Dvorak HF, Nagy JA, Dvorak JT, Dvorak AM. Identification and characterization of the blood vessels of solid tumors that are leaky to circulating macromolecules. Am J Pathol. 1988;133(1):95–109. [PMC free article] [PubMed] [Google Scholar]
- 45.Tolaney SM, et al. Role of vascular density and normalization in response to neoadjuvant bevacizumab and chemotherapy in breast cancer patients. Proc Natl Acad Sci USA. 2015;112(46):14325–14330. doi: 10.1073/pnas.1518808112. [DOI] [PMC free article] [PubMed] [Google Scholar]
- 46.Benjamin LE, Golijanin D, Itin A, Pode D, Keshet E. Selective ablation of immature blood vessels in established human tumors follows vascular endothelial growth factor withdrawal. J Clin Invest. 1999;103(2):159–165. doi: 10.1172/JCI5028. [DOI] [PMC free article] [PubMed] [Google Scholar]
- 47.Emblem KE, et al. Vessel architectural imaging identifies cancer patient responders to anti-angiogenic therapy. Nat Med. 2013;19(9):1178–1183. doi: 10.1038/nm.3289. [DOI] [PMC free article] [PubMed] [Google Scholar]
- 48.Emblem KE, et al. Vessel caliber--a potential MRI biomarker of tumour response in clinical trials. Nat Rev Clin Oncol. 2014;11(10):566–584. doi: 10.1038/nrclinonc.2014.126. [DOI] [PMC free article] [PubMed] [Google Scholar]
- 49.Grenga I, Kwilas AR, Donahue RN, Farsaci B, Hodge JW. Inhibition of the angiopoietin/Tie2 axis induces immunogenic modulation, which sensitizes human tumor cells to immune attack. J Immunother Cancer. 2015;3:52. doi: 10.1186/s40425-015-0096-7. [DOI] [PMC free article] [PubMed] [Google Scholar]
- 50.Gajewski TF, Schreiber H, Fu Y-X. Innate and adaptive immune cells in the tumor microenvironment. Nat Immunol. 2013;14(10):1014–1022. doi: 10.1038/ni.2703. [DOI] [PMC free article] [PubMed] [Google Scholar]
- 51.Quail DF, Joyce JA. Microenvironmental regulation of tumor progression and metastasis. Nat Med. 2013;19(11):1423–1437. doi: 10.1038/nm.3394. [DOI] [PMC free article] [PubMed] [Google Scholar]
- 52.Wu J, Waxman DJ. Metronomic cyclophosphamide eradicates large implanted GL261 gliomas by activating antitumor Cd8(+) T-cell responses and immune memory. OncoImmunology. 2015;4(4):e1005521. doi: 10.1080/2162402X.2015.1005521. [DOI] [PMC free article] [PubMed] [Google Scholar]
- 53.Wagner S, et al. Microglial/macrophage expression of interleukin 10 in human glioblastomas. Int J Cancer. 1999;82(1):12–16. doi: 10.1002/(sici)1097-0215(19990702)82:1<12::aid-ijc3>3.0.co;2-o. [DOI] [PubMed] [Google Scholar]
- 54.Zhai H, Heppner FL, Tsirka SE. Microglia/macrophages promote glioma progression. Glia. 2011;59(3):472–485. doi: 10.1002/glia.21117. [DOI] [PMC free article] [PubMed] [Google Scholar]
- 55.Meisen WH, et al. The impact of macrophage- and microglia-secreted TNFα on oncolytic HSV-1 therapy in the glioblastoma tumor microenvironment. Clin Cancer Res. 2015;21(14):3274–3285. doi: 10.1158/1078-0432.CCR-14-3118. [DOI] [PMC free article] [PubMed] [Google Scholar]
- 56.Lorke DE, Ip CW, Schumacher U. Increased number of microglia in the brain of severe combined immunodeficient (SCID) mice. Histochem Cell Biol. 2008;130(4):693–697. doi: 10.1007/s00418-008-0463-2. [DOI] [PubMed] [Google Scholar]
- 57.Ott PA, Hodi FS, Buchbinder EI. Inhibition of immune checkpoints and vascular endothelial growth factor as combination therapy for metastatic melanoma: An overview of rationale, preclinical evidence, and initial clinical data. Front Oncol. 2015;5:202. doi: 10.3389/fonc.2015.00202. [DOI] [PMC free article] [PubMed] [Google Scholar]
- 58.Wakimoto H, et al. Human glioblastoma-derived cancer stem cells: Establishment of invasive glioma models and treatment with oncolytic herpes simplex virus vectors. Cancer Res. 2009;69(8):3472–3481. doi: 10.1158/0008-5472.CAN-08-3886. [DOI] [PMC free article] [PubMed] [Google Scholar]
- 59.Yuan F, et al. Vascular permeability and microcirculation of gliomas and mammary carcinomas transplanted in rat and mouse cranial windows. Cancer Res. 1994;54(17):4564–4568. [PubMed] [Google Scholar]
- 60.Folkman J. Tumor angiogenesis: Therapeutic implications. N Engl J Med. 1971;285(21):1182–1186. doi: 10.1056/NEJM197111182852108. [DOI] [PubMed] [Google Scholar]
- 61.Liang W-C, et al. Cross-species vascular endothelial growth factor (VEGF)-blocking antibodies completely inhibit the growth of human tumor xenografts and measure the contribution of stromal VEGF. J Biol Chem. 2006;281(2):951–961. doi: 10.1074/jbc.M508199200. [DOI] [PubMed] [Google Scholar]
- 62.Thomas M, et al. A novel angiopoietin-2 selective fully human antibody with potent anti-tumoral and anti-angiogenic efficacy and superior side effect profile compared to Pan-Angiopoietin-1/-2 inhibitors. PLoS One. 2013;8(2):e54923. doi: 10.1371/journal.pone.0054923. [DOI] [PMC free article] [PubMed] [Google Scholar]
- 63.Schaefer W, et al. Immunoglobulin domain crossover as a generic approach for the production of bispecific IgG antibodies. Proc Natl Acad Sci USA. 2011;108(27):11187–11192. doi: 10.1073/pnas.1019002108. [DOI] [PMC free article] [PubMed] [Google Scholar]
- 64.Pace CN, Vajdos F, Fee L, Grimsley G, Gray T. 1995. How to measure and predict the molar absorption coefficient of a protein. Protein Sci 4(11):2411–2423. [DOI] [PMC free article] [PubMed]
- 65.Song JW, Bazou D, Munn LL. Anastomosis of endothelial sprouts forms new vessels in a tissue analogue of angiogenesis. Integr Biol (Camb) 2012;4(8):857–862. doi: 10.1039/c2ib20061a. [DOI] [PMC free article] [PubMed] [Google Scholar]
- 66.Duffy DC, McDonald JC, Schueller OJ, Whitesides GM. Rapid prototyping of Microfluidic Systems in Poly(dimethylsiloxane) Anal Chem. 1998;70(23):4974–4984. doi: 10.1021/ac980656z. [DOI] [PubMed] [Google Scholar]
- 67.Song JW, Munn LL. Fluid forces control endothelial sprouting. Proc Natl Acad Sci USA. 2011;108(37):15342–15347. doi: 10.1073/pnas.1105316108. [DOI] [PMC free article] [PubMed] [Google Scholar]


