Significance
Eukaryotic chemotactic cells can recognize chemical gradients over a wide range of concentrations. This ability is physiologically important for numerous biological processes; however, its underlying mechanism is unknown. Here we report that the dynamic range of chemotaxis is extended to higher concentrations by gradient sensing achieved via regulation of trimeric G-protein shuttling between the cytosol and plasma membrane. G protein-interacting protein 1 (Gip1) regulates this intracellular G-protein translocation, which redistributes cytosolic G proteins to the plasma membrane along chemical gradients at high chemoattractant concentrations. This dynamic spatiotemporal regulation of trimeric G protein yields proper processing of receptor-mediated signaling.
Keywords: eukaryotic chemotaxis, gradient sensing, dynamic range extension, heterotrimeric G protein
Abstract
Chemotactic eukaryote cells can sense chemical gradients over a wide range of concentrations via heterotrimeric G-protein signaling; however, the underlying wide-range sensing mechanisms are only partially understood. Here we report that a novel regulator of G proteins, G protein-interacting protein 1 (Gip1), is essential for extending the chemotactic range of Dictyostelium cells. Genetic disruption of Gip1 caused severe defects in gradient sensing and directed cell migration at high but not low concentrations of chemoattractant. Also, Gip1 was found to bind and sequester G proteins in cytosolic pools. Receptor activation induced G-protein translocation to the plasma membrane from the cytosol in a Gip1-dependent manner, causing a biased redistribution of G protein on the membrane along a chemoattractant gradient. These findings suggest that Gip1 regulates G-protein shuttling between the cytosol and the membrane to ensure the availability and biased redistribution of G protein on the membrane for receptor-mediated chemotactic signaling. This mechanism offers an explanation for the wide-range sensing seen in eukaryotic chemotaxis.
Chemotaxis in eukaryotic cells is observed in many physiological processes including embryogenesis, neuronal wiring, wound healing, and immune responses (1, 2). Chemotactic cells share basic properties including high sensitivity to shallow gradients and responsiveness to a wide dynamic range of chemoattractants (3, 4). For instance, human neutrophils and Dictyostelium cells can sense spatial differences in chemoattractant concentration across the cell body in shallow gradients as low as 2% and exhibit chemotaxis over a 105–106-fold range of background concentrations (5–7). Thus, wide-range sensing and adaptation are critical features of chemotaxis as well as other sensory systems such as visual signal transduction (8). However, the underlying regulatory mechanisms in eukaryotic chemotaxis remain unclear.
The molecular mechanisms of chemotaxis are evolutionarily conserved among many eukaryotes that use G protein-coupled receptors (GPCRs) and heterotrimeric G proteins to detect chemoattractant gradients (3, 4). In Dictyostelium cells, extracellular cAMP works as a chemoattractant, and binding to its receptor cyclic AMP receptor 1 (cAR1) activates G proteins (Gα2Gβγ) along the concentration gradient, leading to the activation of multiple signaling cascades including the PI3K–PTEN, TorC2–PDK–PKB, phospholipase A2, and guanylyl cyclase pathways. In contrast to the spatial distributions of cAMP/cAR1 association and G-protein activation, downstream signaling pathways are activated in an extremely biased manner at the anterior or posterior of the cell (3, 4). For example, localized patches of phosphatidylinositol 3,4,5-trisphosphate (PIP3) are generated at the plasma membrane by an intracellular signal transduction excitable network (STEN) and function as a cue to control the pseudopod formation of motile cells (9, 10). Because PIP3 patches have a relatively constant size of a few microns in diameter, this excitable mechanism can ensure a constant output of chemotactic responses over a wide range of concentrations. However, it is unclear how chemical gradients are sensed adaptively over a wide range in the signal transduction cascades upstream of STEN.
Insight into this question is provided by bacterial chemotaxis and other sensory systems, such as photoreceptor rhodopsin (8). Chemoreceptor methylation in bacteria confers a broad chemotactic range (11). In light adaptation, the phosphorylation of rhodopsins in the visual system leads to rhodopsin down-regulation by arrestin, which blocks physical interaction with G-protein transducin (12). Phosphorylation-dependent receptor internalization is a feature of other systems for suppressing intracellular responses (13). Overall, in these sensory systems, the chemical modifications of receptors are important for regulating the dynamic range of the response. Consistently, Dictyostelium cells expressing unphosphorylated mutant cAR1 exhibit a narrow chemotactic range (14), and phosphorylated cAR1s have reduced affinity for cAMP (15). Thus, chemical modifications of chemoattractant receptors are also important in eukaryotic chemotaxis as a mechanism to extend the chemotactic range. In addition to the receptor modifications, G proteins are phosphorylated and recruited from the cytosol to the plasma membrane upon receptor stimulation in Dictyostelium cells (16, 17), although the relevance of these actions on wide-range sensing and adaptation is unknown.
Here we report that a novel regulator of G proteins, G protein-interacting protein 1 (Gip1), is essential for the wide-range chemotaxis in Dictyostelium cells. Gip1 regulates G-protein localization between the cytosol and plasma membrane upon receptor activation, which targets cytosolic G proteins to the membrane in a biased manner along chemoattractant gradients at higher chemotactic ranges. These findings provide evidence for a wide-range sensing mechanism in which Gip1-dependent G-protein translocation ensures the availability and biased redistribution of G protein for receptor-mediated signaling at the higher range, which is in contrast to the chemical modification mechanisms underlying adaptation by sensory receptors.
Results
Gip1 Is an Interactor of Trimeric G Protein.
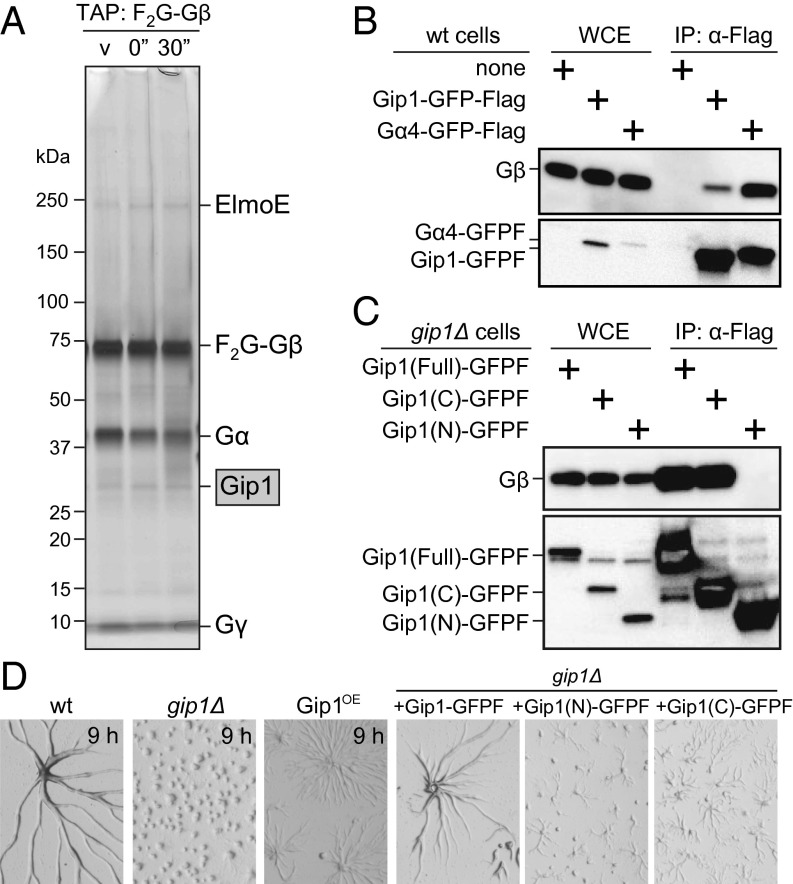
We identified Gip1 by using a tandem affinity purification (TAP) tag of Gβ. For the TAP assay, whole-cell extracts (WCEs) were prepared from cells in vegetative growth and chemotactically competent cells with or without cAMP stimulation. Under these conditions, four bands were observed at around 240, 40, 30, and 9 kDa in addition to the TAP-tagged Gβ protein (Fig. 1A and Fig. S1A). Mass spectrometry (MS) analysis revealed that p40 and p9 were Gα4 and Gγ, respectively; p240 was ElmoE, which is a known Gβ-binding protein (18); and p30 was a previously uncharacterized protein encoded by DDB_G0271086 and designated as Gip1. Gip1 contained a pleckstrin homology (PH) domain at the N terminus between amino acids 1–109 and an unidentified region at the C terminus. Gip1 homologs exist in other protists, such as Entamoeba and Acanthamoeba (Fig. S1 B and C). In addition, the Gip1 C terminus, where there is no similarity to known G-protein interactors including the regulator of G proteins signaling, has weak but significant similarity to tumor necrosis factor α-induced protein 8 (TNFAIP8) in Homo sapiens (Fig. S1 B and C) (19).
Fig. 1.
Gip1 is an interactor of trimeric G protein. (A) TAP using Flag×2-GFP-Gβ (F2G-Gβ) in vegetative growth (v) and before (0'') and 30 s after (30'') cAMP stimulation. Silver staining showed F2G-Gβ copurified with Gip1 along with ElmoE, Gα, and Gγ. (B) Gip1-GFP-Flag (Gip1-GFPF) and Gα4-GFP-Flag (Gα4-GFPF) proteins were expressed in WT cells and immunoprecipitated (IP) with α-Flag antibody from WCE. Copurification of Gβ (Upper) and GFP-Flag (Lower) was evaluated by immunoblotting. Gα4-GFPF was used as a positive control and confirmed the coprecipitation of Gβ. (C) Full-length Gip1 and its C and N termini tagged with GFP-Flag (Gip1-GFPF) were immunoprecipitated with α-Flag antibody from WCE. Copurification of Gβ (Upper) and GFP-Flag (Lower) was evaluated by immunoblotting. (D) Cells were starved on nonnutrient DB agar. Gip1OE cells are WT cells with full-length Gip1 overexpression.
Fig. S1.
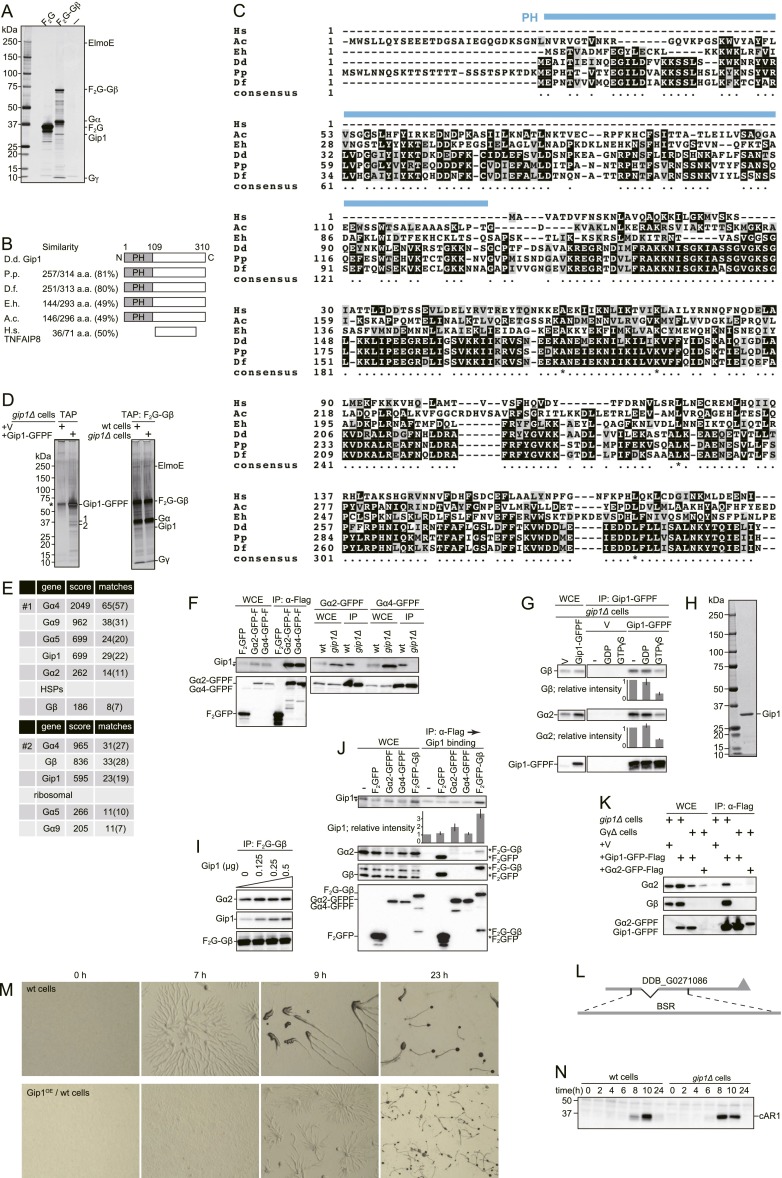
Gip1 is an interactor of trimeric G protein. (A) TAP was carried out using WCEs prepared from WT cells expressing nothing (−), Flag×2-GFP (F2G), or F2G-Gβ in vegetative growth. Silver staining shows F2G-Gβ copurified with Gip1 along with ElmoE, Gα, and Gγ. (B) Schematic representation of Gip1 with an N-terminal PH domain. D. discoideum Gip1 was the query sequence in a BLAST search, and results are presented along with similarity (percentage of similar amino acids in similar regions) for Polysphodylium pallidum (P.p.), Dictyostelium fasciculatum (D.f.), Entamoeba histolytica (E.h.), and Acanthamoeba castellanii (A.c.). TNFAIP8 in Homo sapiens (H.s.) shares homology with the Gip1 C terminus. (C) Amino acid sequences of Gip1 and its homologs were aligned by CLUSTAL W2. BOXSHADE 3 was used to show identical residues and similar ones, which are highlighted in black and gray, respectively. The PH domain of Gip1 is indicated by a blue line. (D) TAP was applied to Gip1-GFP-Flag in gip1Δ cells (Left panel). V, vector control experiment. Bands indicated by 1 and 2 copurified with Gip1-GFP-Flag and included (1) a mixture of Gα4, Gα5, Gα9, and Gα2 subtypes or (2) Gβ. An asterisk denotes a nonspecific band. TAP was applied to F2G-Gβ in WT or gip1Δ cells (Right panel). ElmoE was present in both cell lines according to MS analysis. (E) Proteins from Fig. S1D (bands 1 and 2) were identified by MS; results are summarized in the Upper and Lower panels, respectively. (F) F2GFP, Gα2-GFP-Flag (Gα2-GFPF), and Gα4-GFP-Flag (Gα4-GFPF) proteins were immunoprecipitated with α-Flag antibody from WCEs. Copurification of Gip1 (Upper Left) and GFP-Flag (Lower Left) was evaluated by immunoblotting. Gα2-GFPF and Gα4-GFPF proteins were expressed in WT or gip1Δ cells and immunoprecipitated with α-Flag antibody from WCEs. Copurification of Gip1 (Upper Right) and GFP-Flag (Lower Right) was evaluated by immunoblotting. (G) Gip1-GFPF was immunoprecipitated with α-Flag antibody from WCE in the presence of nothing (−), 50 μM GDP, or 50 μM GTPγS. The indicated proteins were visualized by immunoblotting. V, vector control experiment. (H) Gip1 protein was purified from bacteria and 0.2 μg was stained by Coomassie Brilliant Blue (CBB). (I) F2G-Gβ was purified with α-Flag antibody beads. These beads were incubated with the indicated amount of bacterially purified Gip1 (see H) for 30 min. Then, bound Gα2 and Gip1 were evaluated by immunoblotting. Gα2 proteins bound to the F2G-Gβ beads independently of Gip1 addition, suggesting that Gip1 does not affect the complex formation of G proteins. (J) The indicated proteins were purified with α-Flag antibody beads in RIPA buffer, where G proteins were dissociated into α and βγ subunits as shown by immunoblotting with anti-Gα2 and anti-Gβ antibodies. These beads were incubated with 0.2 μg of bacterially purified Gip1 (see H), and the bound Gip1 was evaluated by immunoblotting. *F2G-Gβ and *F2GFP, degraded F2G-Gβ and F2GFP were nonspecifically cross-reacted by α-Gα2 and –Gβ, respectively. (K) Gip1-GFPF and Gα2-GFPF proteins were immunoprecipitated with α-Flag antibodies from WCEs. Copurification of Gα2 (Top), Gβ (Middle), and GFP-Flag (Bottom) was evaluated by immunoblotting. Binding of Gip1 to G proteins was dependent on Gβγ. (L) Schematic representation of gip1 genomic DNA and the region replaced by the BSR gene. (M) Cells were starved on nonnutrient DB agar. Gip1OE/WT, overexpression of full-length Gip1 in WT cells. Images were acquired at the indicated time. Multicellular structure formation was delayed in Gip1OE/WT cells. (N) WT and gip1Δ cells were starved in DB buffer and allowed to develop, and cAR1 expression level was determined by immunoblotting; both cell types had comparable expression kinetics, indicating a normal developmental program in mutants.
The interaction between Gip1 and Gβ was verified by a pull-down assay using GFP-Flag–tagged Gip1 (Gip1-GFPF), as shown in Fig. 1B. To identify the interaction region, the N-terminal PH domain (amino acids 1–109) and the Gip1 C terminus (amino acids 108–310) were separately expressed and used in the assay. The C but not N terminus bound to Gβ as efficiently as the full-length protein (Fig. 1C). Furthermore, to determine whether G proteins bind Gip1, the proteins that copurified with Gip1-GFPF by TAP were analyzed by MS (Fig. S1 D and E). The two prominent bands at 35 and 40 kDa in Fig. S1D were Gβ and Gα subtypes, respectively, including Gα4, Gα9, Gα5, and Gα2. Together with the additional data in SI Text (Fig. S1 F–K), these results confirmed that Gip1 binds to G proteins via the C terminus.
The physiological roles of Gip1 in the development of Dictyostelium cells were investigated by examining the phenotype of gip1-knockout (gip1Δ) cells (Fig. S1L). Wild-type (WT) cells formed streams that consisted of a collective migration of chemotactic cells upon starvation, whereas gip1Δ cells caused smaller aggregates with reduced stream formation (Fig. 1D). Moreover, Gip1 overexpression in WT cells (Gip1OE cells) delayed progression of the early development, suggesting requirements to maintain the WT expression level for normal development (Fig. S1M). The early developmental defects in gip1Δ cells were rescued by ectopically expressing Gip1-GFPF but not the N or C terminus (Fig. 1D), indicating that normal development depended on the full length of Gip1. gip1Δ cells expressed normal levels of endogenous cAR1, which is a marker of transcriptional regulation in early development, indicating normal transcriptional regulation in gip1Δ cells but defects in cell aggregation (Fig. S1N).
Gip1 Is Essential for Chemotaxis at Higher Concentration Ranges.
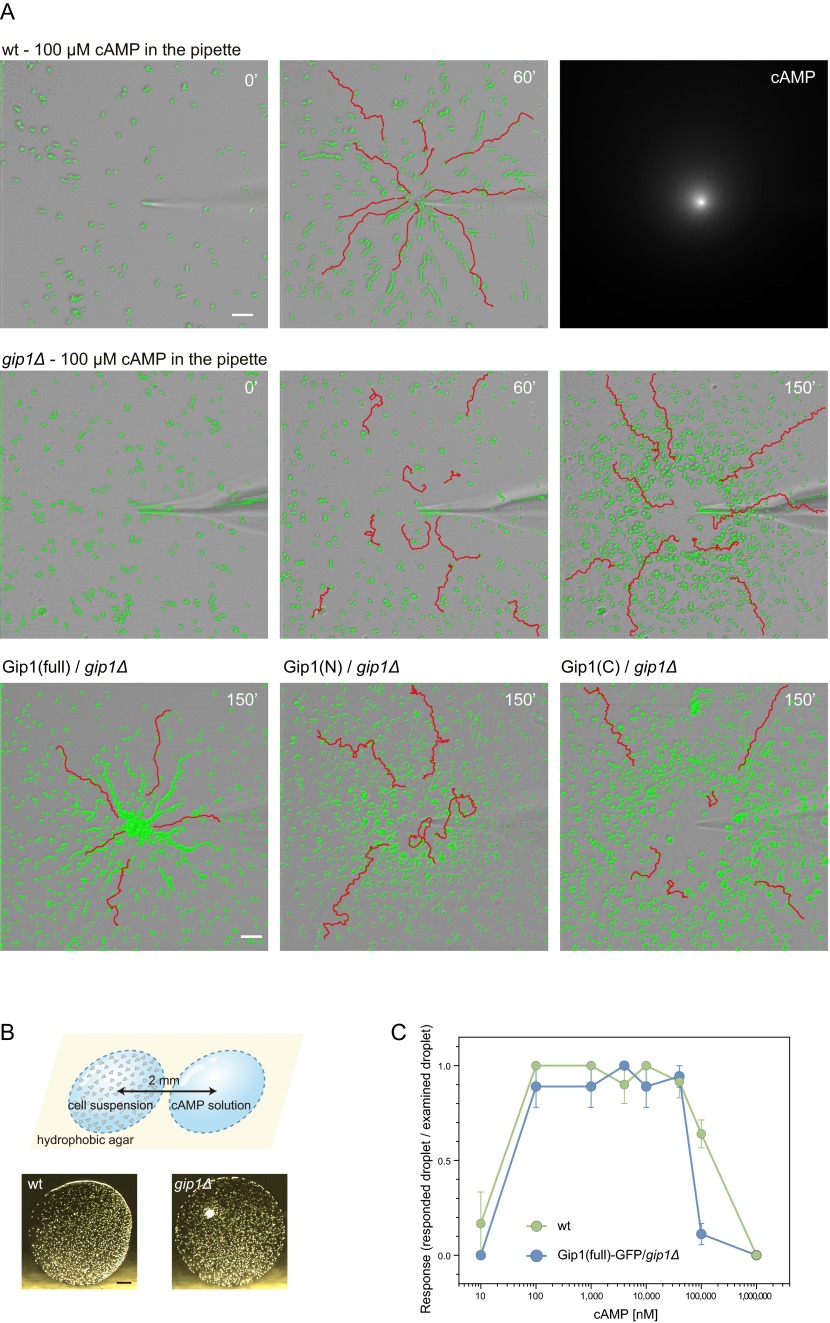
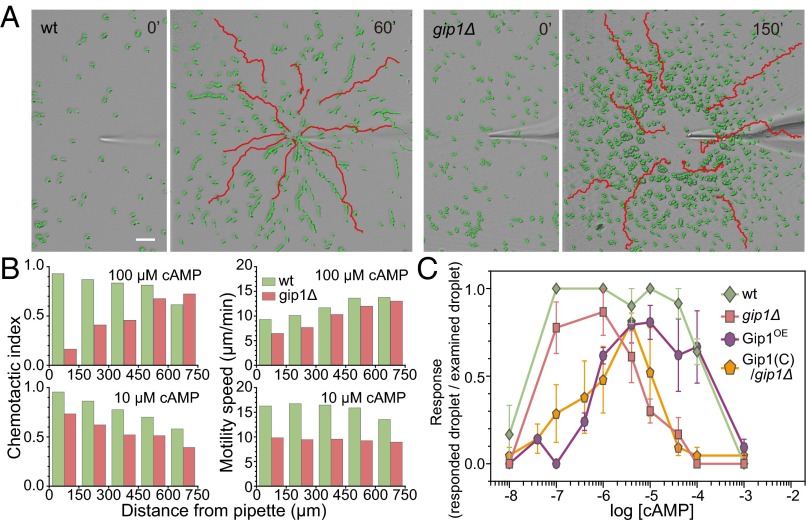
Because chemotaxis is a major event for cell aggregation, we examined the chemotactic ability of gip1Δ cells. Unusual phenotypes of gip1Δ cells showed defects in the chemotactic range. cAMP was applied in a gradient with a micropipette such that the concentration decreased with distance from the tip (Fig. S2A, Upper Right). At 100 µM cAMP in the micropipette, WT cells displayed efficient chemotaxis independent of the distance from the micropipette tip and ultimately reached the tip (Fig. 2A and Movie S1). gip1Δ cells showed efficient chemotaxis at lower cAMP concentration regions, but severe defects were observed at higher concentration regions near the tip, resulting in an area of exclusion there (Fig. 2A and Movie S2). The chemotactic index (CI), which was calculated based on distance from the micropipette tip, increased for WT cells but decreased for gip1Δ cells at higher cAMP concentrations (Fig. 2B, Upper Left panels). gip1Δ cells had slightly reduced motility compared with WT cells that had similar dependence on distance from the tip. At 10 µM cAMP in the micropipette, however, gip1Δ cells exhibited efficient chemotaxis. These chemotactic abilities were confirmed by the small population assay (see Fig. S2B for the method) (20). That is, WT cells exhibited efficient chemotaxis in response to 0.1–100 μM cAMP, whereas gip1Δ cells exhibited reduced chemotaxis at concentrations >10 μM, thus showing a narrower chemotactic range (Fig. 2C and Fig. S2C). These chemotactic defects of gip1Δ cells at higher cAMP concentrations were rescued by the ectopic expression of full-length Gip1, but not of the Gip1 N or C terminus (Fig. S2A and Movies S3–S5).
Fig. S2.
The chemotactic dynamic range is extended to higher concentrations via Gip1. (A) High-resolution images of Fig. 2A (Upper and Middle) and the cAMP gradient visualized by mixing ATTO 532 (ATTO-TEC) with cAMP solution (Upper Right). WT and gip1Δ cells were applied to chemical gradients emitted from a micropipette tip filled with 100 μM cAMP. Representative images of cell trajectories (red lines) are shown before (0') and 60 and/or 150 min after (60' and 150', respectively) the start of the assay (see Movies S1–S5). (Scale bar, 50 µm.) gip1Δ cells expressing the full-length or N or C terminus of Gip1 tagged with GFP-Flag (Gip1-GFPF) were exposed to gradients emitted from a micropipette tip filled with 100 μM cAMP (Bottom). Representative images of cell trajectories are shown 150' after the start of the assay. Chemotactic defects of gip1Δ cells were rescued by full-length Gip1 but not by the N or C terminus. Cells are highlighted in green. (B) Schematic image of the small population assay (Upper). Shown are representative droplets of WT (Lower Left) and gip1Δ (Lower Right) cell suspensions juxtaposed with 100 µM cAMP droplets. cAMP droplets were located to the right of the cell suspension droplets. (Scale bar, 200 µm.) (C) Chemotactic responses of WT and Gip1(full)-GFPF–expressing gip1Δ cells to different cAMP concentrations were evaluated by the small population assay. Data represent the mean ± SEM of three experiments.
Fig. 2.
Chemotactic dynamic range is extended to higher concentrations via Gip1. (A) Chemical gradients were applied to WT and gip1Δ cells from a micropipette tip filled with 100 μM cAMP. Representative images of cell trajectories (red lines) are shown before (0') and 60 or 150 min after (60' and 150', respectively) the start of the assay. Cells are highlighted in green. (Scale bar, 50 µm.) (B) CI and motility speed were calculated from the assay in A following application of 10 or 100 μM cAMP at different distances from the micropipette tip. Each bar represents the average of at least 10 cells. (C) The chemotactic response to different cAMP concentrations was evaluated by the small population assay (Fig. S2B). Data represent the mean ± SEM of three experiments.
Gip1OE and gip1Δ cells had distinct effects on the chemotactic ranges (Fig. 2C). Gip1OE cells had severely impaired chemotaxis at lower cAMP concentrations but exhibited normal chemotaxis at higher concentrations. Overexpression of the Gip1 C terminus also impaired chemotaxis, but differently, as chemotaxis was inhibited at the lower and higher concentration ranges but preserved at concentrations in between (Fig. 2C). These results suggest that full-length Gip1 at a normal expression level is required for wide-range chemotaxis.
Uniform Receptor Stimulation Induced Normal Signaling Responses in gip1Δ Cells.
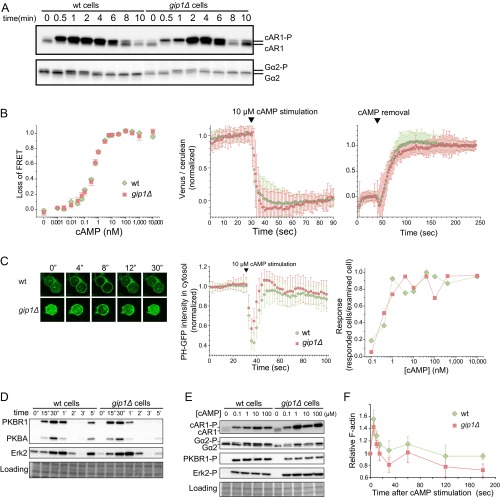
To identify the defects in the chemotactic signaling of gip1Δ cells, we followed the chemoattractant-triggered signaling reactions (3, 4). Cells were uniformly stimulated with cAMP, and the phosphorylation of cAR1, Gα2, PKBR1, PKBA, and Erk2 as well as fluorescence resonance energy transfer (FRET) changes between G-protein subunits, PIP3 production at the plasma membrane, and actin polymerization were evaluated (Fig. S3). As described in detail in SI Text, no obvious differences in these signaling reactions upon uniform cAMP stimulations were observed in gip1Δ or WT cells, showing that the uniform increase of cAMP from the basal level can induce normal activation of chemotactic signaling pathways in gip1Δ cells. Thus, cells can detect the initial increase of cAMP concentrations in a Gip1-independent manner.
Fig. S3.
gip1Δ cells exhibit normal cAMP-related responses. (A) cAR1 and Gα2 phosphorylation in WT and gip1Δ cells upon cAMP stimulation was evaluated by mobility shifts. Proteins were detected by immunoblots with each specific antibody. (B) G-protein activation was monitored by FRET changes between Gα2-Cerulean and Venus-Gβ. The dose–response for cAMP was measured with a fluorometer. Cells were mixed with cAMP at the indicated final concentrations for 1 min, and the loss of FRET, which represents the dissociation or activation of G proteins, was measured. Data represent the mean ± SEM of four experiments (Left). Upon the addition of 10 μM cAMP, FRET was measured at 1-s intervals in cells placed on coverslips. Values represent the mean ± SD of the normalized fluorescence ratio of Venus to Cerulean (n ≥ 40 cells). cAMP triggered a decrease in FRET (Middle). Cells were pretreated with 10 μM cAMP, and upon cAMP removal, FRET recovery was measured. Each value represents the mean ± SD of the normalized fluorescence ratio of Venus to Cerulean (n ≥ 50 cells) (Right). (C) Cells expressing the AKT PH domain fused to GFP (PHAKT-GFP; a live reporter of PIP3) were stimulated with 10 μM cAMP in the presence of 5 μM latrunculin A. Images were acquired at 2-s intervals. (Left) Representative images of PHAKT-GFP translocated from the cytosol to the plasma membrane within 8 s in WT and gip1Δ cells, indicating normal activation of the PIP3 pathway. Cytosolic intensity of PHAKT-GFP was monitored before and after application of 10 μM cAMP. The reduction in fluorescence intensity in the cytosol corresponded to PIP3 production at the plasma membrane (Middle). The dose–response of cells expressing PHAKT-GFP is plotted. Curves were similar for WT and gip1Δ cells, indicating that both cell types were equally sensitive to cAMP (Right). (D) Phosphorylation levels of PKBR1 and PKBA or Erk2 were assessed by immunoblotting with anti-phospho-PKC (pan) and anti-phospho Erk1/2 antibodies, respectively. The blot was stained with Amido Black to visualize the loading control. (E) WT and gip1Δ cells were stimulated by the indicated cAMP concentrations, and the phosphorylated forms of cAR1, Gα2, PKBR1, and Erk2 were assessed. Both cell types responded similarly at each cAMP concentration. (F) Quantitative analysis of F-actin formation triggered by 1 μM cAMP stimulation.
Gip1 Sequesters Trimeric G Protein in Cytosolic Pools.
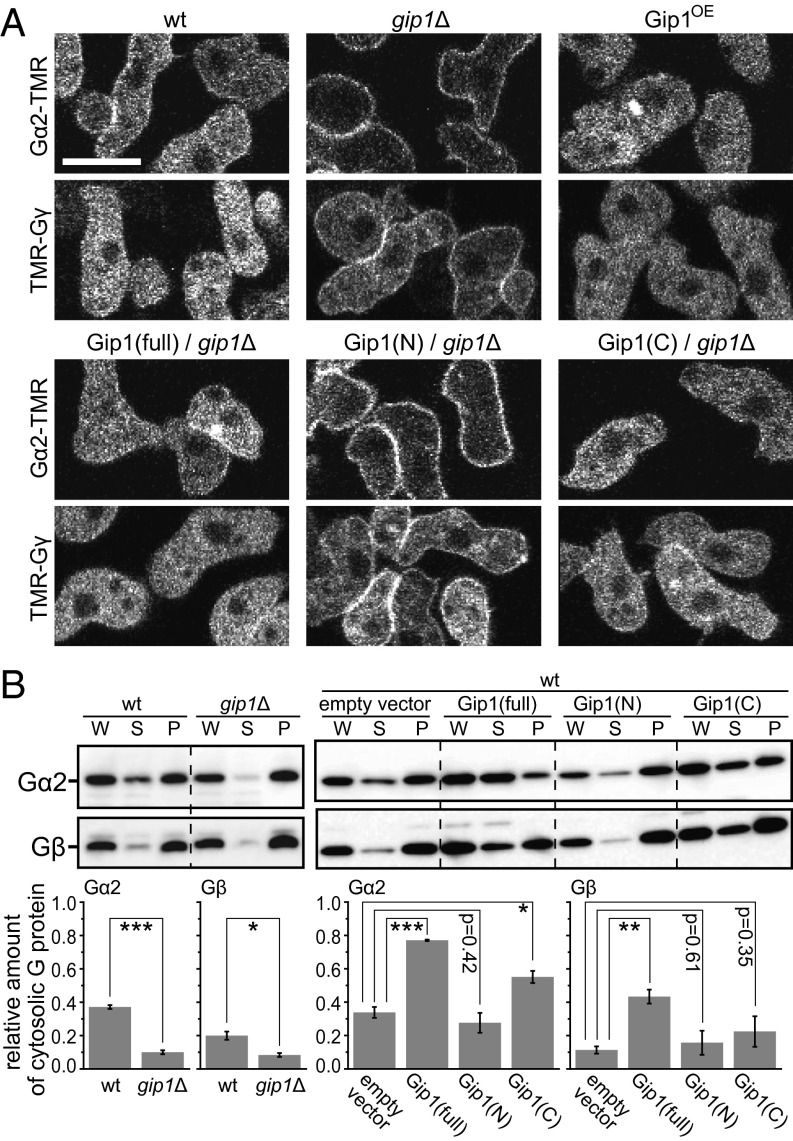
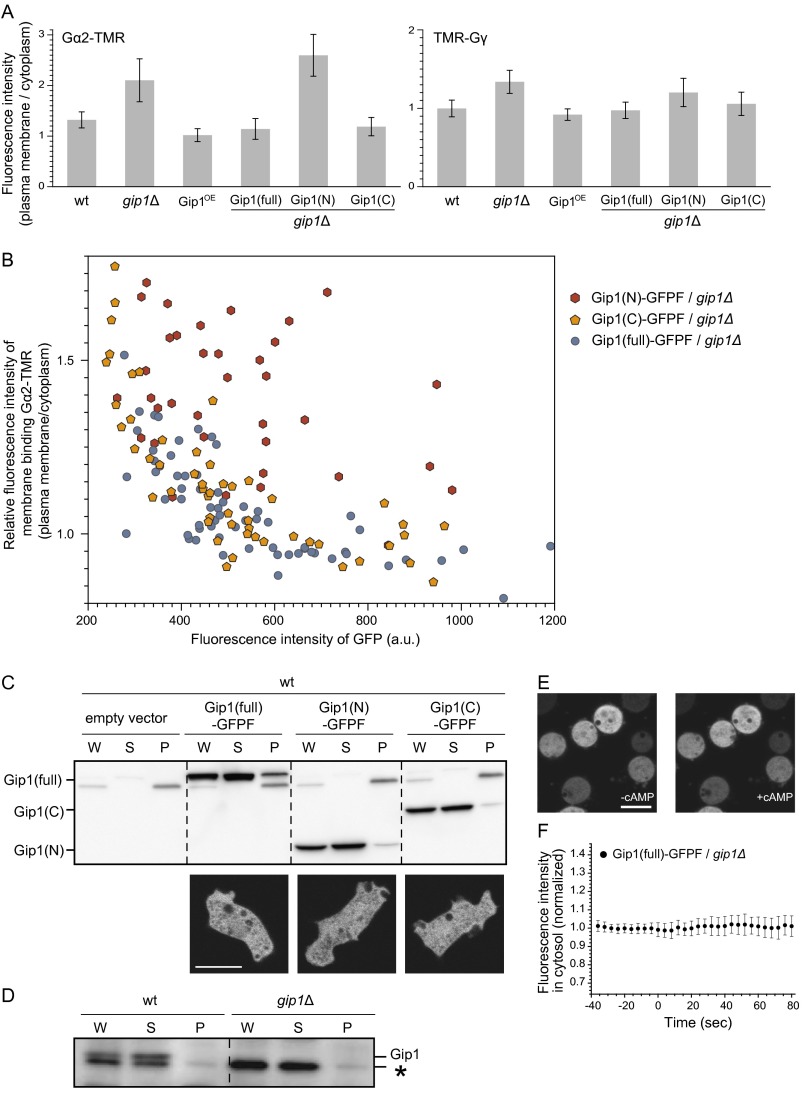
We next investigated the subcellular localization of G proteins, given that they are modified upon cAMP stimulation (17). Gα2 and Gγ conjugated with the fluorescent dye TMR (Gα2-TMR and TMR-Gγ, respectively) via a Halo tag were used for localization analysis. Gα2-TMR and TMR-Gγ were present in both the cytosol and plasma membrane of WT cells, whereas the cytosolic fractions of both proteins were significantly decreased in gip1Δ cells (Fig. 3A and Fig. S4A). Gip1OE cells exhibited an increase in the cytosolic fraction of G proteins, which was also observed by expression of the Gip1 C terminus but not of the Gip1 N terminus. These observations were confirmed for endogenous Gα2 and Gβ by biochemical fractionation into cytosolic and membrane components (Fig. 3B). The cytosolic amounts of Gα2 and Gβ were significantly reduced to about 20% and 40%, respectively, in gip1Δ compared with WT cells. Overexpression of the Gip1 and Gip1 C terminus compared with vector control increased cytosolic Gα2 by 2.3-fold and 1.6-fold, respectively, and cytosolic Gβ by 3.8-fold and 2.0-fold. The lesser effect of Gip1 C terminus compared with full-length Gip1 is attributed to a difference in the expression level of these proteins (Fig. S4B). Thus, the cytosolic localization of G proteins requires Gip1, likely by complex formation via its C terminus in the cytosol (Fig. 1C). Consistently, the full-length and N and C termini of Gip1 were localized mostly in the cytosol (Fig. S4C). The biochemical fractionation assay confirmed that endogenous Gip1 as well as ectopically expressed full-length and the N and C termini of Gip1 were predominantly found in the supernatant fraction (Fig. S4 C and D). Thus, Gip1 is responsible for maintaining the cytosolic pools of G proteins in the absence of chemoattractants.
Fig. 3.
Gip1 regulates shuttling of trimeric G protein between the cytosol and the plasma membrane. (A) Intracellular distribution of Gα2-TMR and TMR-Gγ, respectively. Gip1(full), Gip1(N), and Gip1(C) represent the coexpression of the full-length (full), N terminus, and C terminus of Gip1, respectively. (Scale bar, 10 µm.) (B) WCEs (W) prepared from the indicated cell lines were separated into supernatant (S) and pellet (P) fractions. Endogenous Gα2 and Gβ were detected by immunoblotting (Top). The fraction of the supernatant was calculated by band intensities (Bottom). *P < 0.05, **P < 0.01, ***P < 0.005, t test.
Fig. S4.
Gip1 regulates shuttling of trimeric G protein between the cytosol and the plasma membrane. (A) Ratios of fluorescence intensities at the plasma membrane and in the cytosol for the data shown in Fig. 3A. Data represent the mean ± SD (n = 10 cells) for Gα2-TMR (Left) and TMR-Gγ (Right). The increased ratios signified that the cytosolic localization of these proteins was reduced in gip1Δ cells. (B) Full-length (full; blue), C-terminal (yellow), or N-terminal (red) Gip1 was expressed in gip1Δ cells along with Gα2-Halo proteins. Cells were stained with tetramethylrhodamine (TMR). GFP signal intensity and the ratio of TMR-labeled Gα2-Halo proteins at the plasma membrane and in the cytosol are plotted. The fraction of Gα2 at the plasma membrane was inversely proportional to the expression level of full-length and C-terminal Gip1 but was unrelated to the expression level of N-terminal Gip1, indicating that both full-length and C-terminal Gip1 were sufficient to retain Gα2 proteins in the cytosol. (C) The intracellular distribution of full-length, N-terminal, and C-terminal Gip1-GFPF in WT cells was determined by biochemical fractionation (Top) and GFP imaging (Bottom). (Scale bar, 10 µm.) (D) Localization of Gip1 was determined by cell fractionation. Endogenous Gip1 was detected by immunoblotting. In the WT cell, the upper band represents Gip1, which was absent in gip1Δ. The asterisk denotes a nonspecific band. (E) Gip1-GFPF–expressing cells were stimulated with 10 μM cAMP in the presence of 5 μM latrunculin A. Representative images are presented before and after stimulation. (Scale bar, 10 μm.) (F) The cytosolic fluorescence intensity of the Gip1-GFPF (mean ± SD) of E was quantified at 4-s intervals and showed that the intracellular localization of Gip1 was not affected upon cAMP stimulation.
Gip1 Regulates G-Protein Shuttling upon Receptor Stimulation.
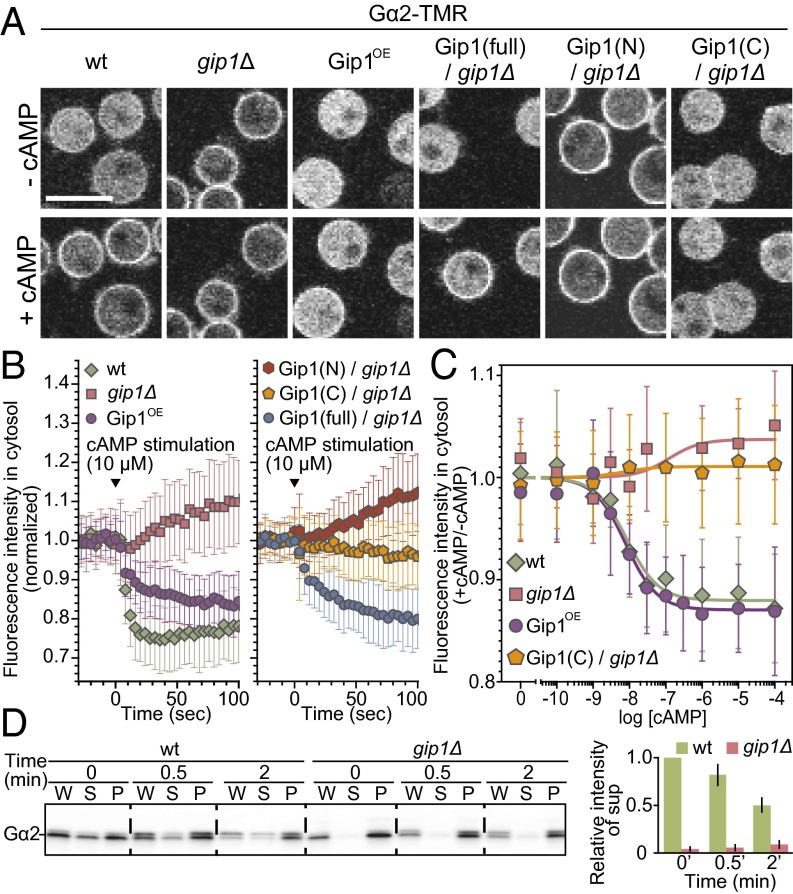
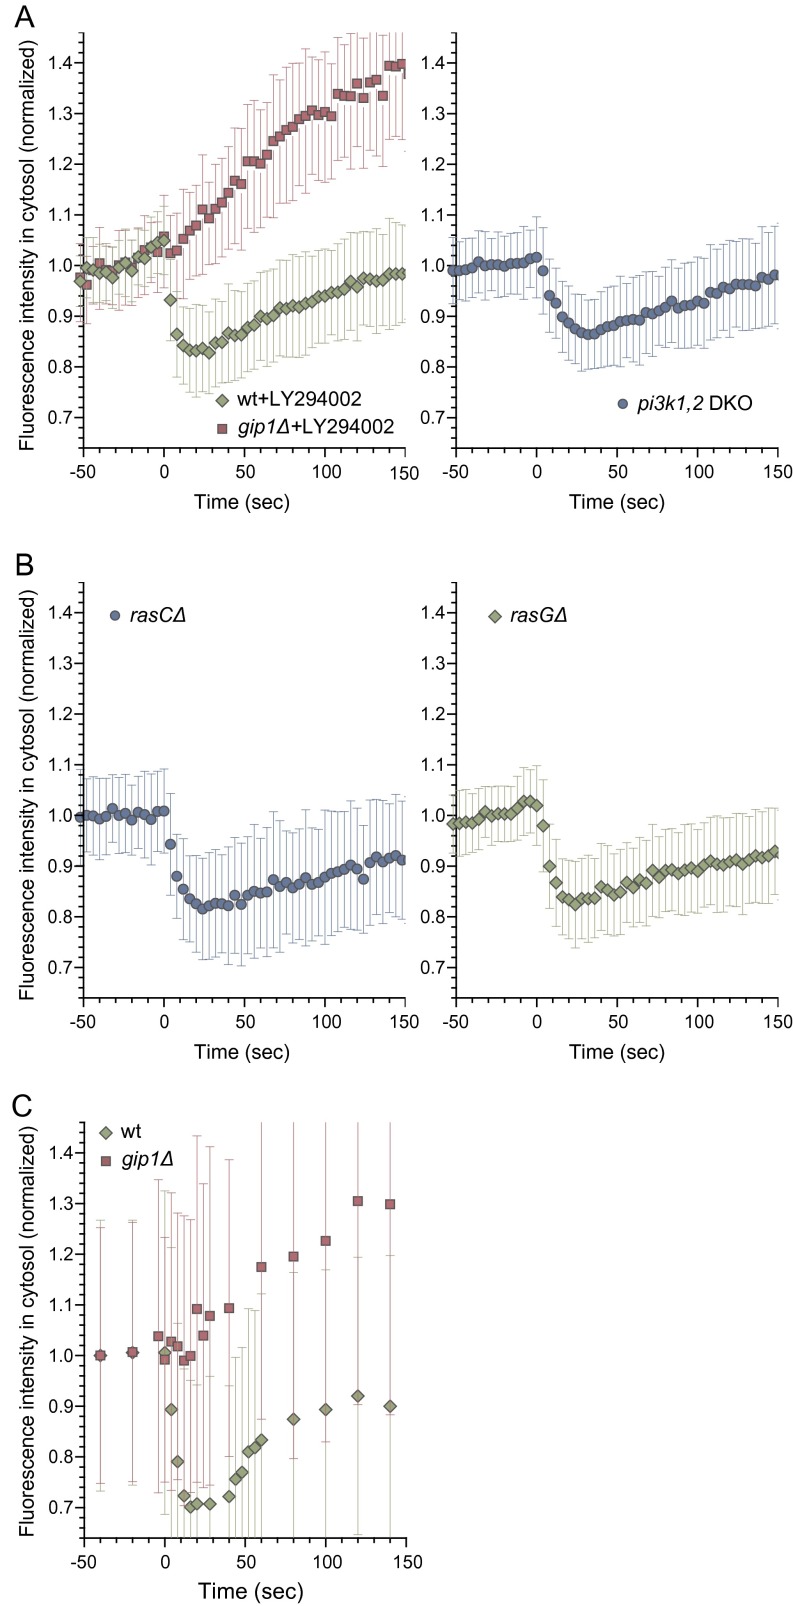
Because chemotaxis-competent cells redirect G proteins from the cytosol to the plasma membrane upon cAMP stimulation (17), we investigated whether Gip1 is involved in this process. In WT cells, Gα2 was clearly recruited to the membrane upon cAMP addition, which was assessed by the decreased levels of cytosolic Gα2-TMR (Fig. 4 A and B, and Movie S6). Gip1OE cells showed similar cAMP-induced Gα2 translocation, with a half-maximum at around 10 nM cAMP (Fig. 4 A–C). However, the same was not true of gip1Δ cells even though there was less Gα2-TMR protein in the cytosol under resting conditions (Fig. 4 A–C). Instead, the amounts of Gα2 on the membrane decreased slightly with the cAMP concentration in gip1Δ cells (Fig. 4 B and C). Biochemical fractionation analysis of Gα2 localization confirmed these observations (Fig. 4D). Additionally, unlike G protein, Gip1 remained in the cytosol upon cAMP addition (Fig. S4 E and F). Together with the detailed characterization described in SI Text, we concluded that cAMP-induced Gα2 translocation depends on Gip1 but not on Ras activation, PIP3 production, or actin polymerization (Fig. S5).
Fig. 4.
Gip1 modulates spatial regulation of trimeric G protein in response to chemoattractants. (A) Fluorescent images of Gα2-TMR. Cells were treated with cAMP in the presence of 5 μM latrunculin A. (Scale bar, 10 μm.) (B) Cells expressing Gα2-TMR were stimulated with cAMP, and fluorescence intensity in the cytosol (mean ± SD) was quantified at 4-s intervals. (C) Translocation of Gα2-TMR to the plasma membrane was assessed quantitatively by the decrease in cytosolic fluorescence intensity. Gα2-TMR protein was expressed in WT and gip1Δ cells harboring Gip1-GFPF (full-length and C terminus). A dose-dependent curve was plotted (mean ± SD). (D) Cells were fractionated before and after stimulation with 1 μM cAMP for 0.5 and 2 min (Left). The signal intensity of the supernatant fraction relative to that of WT cells at 0 min was quantified (Right).
Fig. S5.
Spatial regulation of trimeric G protein in response to chemoattractants is independent of PIP3, Ras activity, and the actin state. (A) Translocation of Gα2-TMR upon 10 μM cAMP was assessed in cells treated with 60 μM LY294002 and pi3k1Δ2Δ cells. A normal response was observed in cells that had PIP3 production inhibited pharmacologically or genetically. (B) Translocation of Gα2-TMR upon 10 μM cAMP stimulation was assessed in rasCΔ and rasGΔ cells. A normal response was observed in these mutant cells. (C) Translocation of Gα2-TMR upon 10 μM cAMP stimulation was assessed in the absence of latrunculin A. F-actin did not influence the translocation response.
Next we sought to identify the region of Gip1 required for G-protein translocation. Full-length Gip1 expression in gip1Δ cells rescued Gα2-TMR translocation upon cAMP stimulation (Fig. 4 A and B and Movie S6). The Gip1 N terminus did not revert Gα2 to the resting-state cytosolic localization, nor did it rescue cAMP-induced Gα2 translocation (Fig. 4 A and B). In contrast, the C terminus caused cytosolic retention of Gα2, an effect that was unaltered by cAMP stimulation (Fig. 4 A–C). The C terminus is therefore sufficient for tethering G proteins in the cytosol but insufficient for inducing G-protein translocation to the membrane upon cAMP stimulation, suggesting regulatory roles of the N-terminal PH domain in G-protein translocation. Sequestration of cytosolic G protein via Gip1 C terminus is inhibitory for chemotaxis because the proteins available for receptor-mediated signaling are depleted from the membrane. Upon receptor stimulations at the higher concentration ranges, G protein translocates to the membrane, probably by releasing from Gip1, thus serving as a possible receptor-mediated signal (see Discussion for details).
gip1Δ Cells Fail to Process Gradient Signals at Higher Ranges.
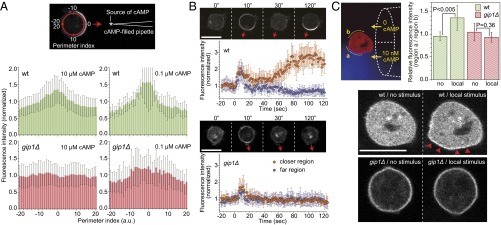
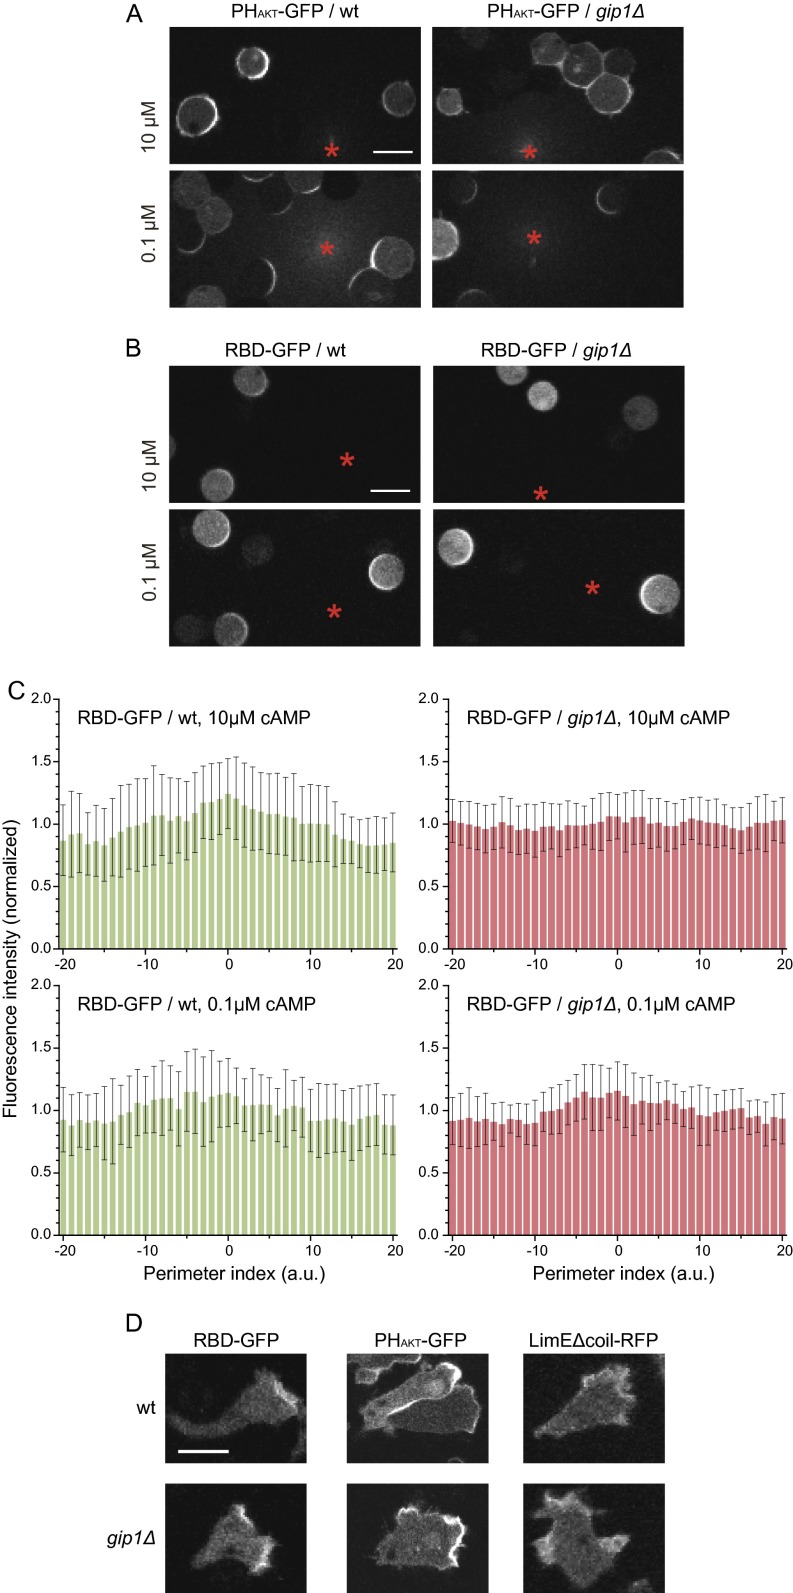
As shown in Fig. 2, gip1Δ cells exhibited decreased chemotaxis without severe motility defects, suggesting that Gip1-dependent G-protein translocation is involved in gradient sensing. To estimate the extent of gradient sensing, PIP3 production was evaluated by using the specific probe PHAKT-GFP (21, 22). When 10 μM cAMP was applied as a gradient by a micropipette to WT cells, a crescent-like accumulation of PHAKT-GFP was observed in areas close to higher cAMP concentrations (Fig. 5A, Fig. S6A, Upper Left, and Movie S7), whereas gip1Δ cells did not exhibit the same bias in PHAKT-GFP localization under cAMP gradients with high background concentrations (Fig. 5A, Fig. S6A, Upper Right, and Movie S8). In lower cAMP concentrations supplied by a micropipette containing 0.1 μM cAMP, crescent-like distributions of PHAKT-GFP near the source were observed in WT cells and also in gip1Δ cells but with less efficiency (Fig. 5A and Fig. S6A, Lower panels). To further confirm the defects in gradient sensing of gip1Δ cells, we used Ras binding domain (RBD)-GFP to detect activated Ras, which is another reporter for the cAMP signaling pathway (4). RBD-GFP behaved similarly to PHAKT-GFP in WT and gip1Δ cells (Fig. S6 B and C). These results indicate that Gip1 is required for gradient sensing at higher chemoattractant concentrations.
Fig. 5.
Gip1 is involved in the signal transduction of chemical gradients. (A) Gradient sensing monitored by a PIP3 probe, PHAKT-GFP. Cells were treated with 5 µM latrunculin A and stimulated with a micropipette tip containing 10 or 0.1 μM cAMP. The cell perimeter was divided into 40 points (Top); relative intensities (mean ± SD) of PHAKT-GFP in WT and gip1Δ cells are shown as histograms in green and red, respectively. (B) Representative temporal changes of PHAKT-GFP localization in WT (Top) and gip1Δ (Bottom) cells when stimulated by a micropipette containing 10 μM cAMP. Red arrows show the direction of the gradient source. Fluorescence intensities at the near (orange diamond) or far (blue circle) side of a cell from the micropipette were plotted over time as the mean ± SD. (Scale bar, 10 µm.) (C) Gα2 localization under steep cAMP gradients. Cells expressing Gα2-TMR were stimulated by a theta micropipette with two separate chambers containing either 0 or 10 nM cAMP (Top Left), and Gα2-TMR localization was visualized (Bottom). The left and right images show pre- and poststimulation, respectively. Ratios of the fluorescence intensities in the regions a and b were measured (Top Right, mean ± SD). (Scale bar, 10 µm.)
Fig. S6.
Gip1 processes chemoattractant gradient information. (A) Shown are 5 µM latrunculin A-treated cells expressing PHAKT-GFP that were exposed to a gradient of 10 (Upper) or 0.1 (Lower) μM cAMP in a micropipette tip (*). The images after 3 min of gradient stimulation are shown. (Scale bar, 10 µm.) (B) The same experiment was performed using the RBD of Raf (RBD)-GFP to detect the active form of Ras proteins. (Scale bar, 10 µm.) (C) The cell perimeter was divided into 40 points as in Fig. 5, and the relative intensities (mean ± SD) of RBD-GFP in WT and gip1Δ cells are shown as histograms in green and red, respectively. (D) Molecular distributions of activated Ras, PIP3, and F-actin were observed by RBD-GFP, PHAKT-GFP, and LimEΔcoil-RFP, respectively, at 3 min after application of the cAMP gradient, which was applied using a micropipette. gip1Δ cells exhibited less polarity and more variations in the direction of activated Ras, PIP3, and F-actin accumulation. (Scale bar, 10 µm.)
We next examined the spatiotemporal dynamics in PHAKT-GFP localization upon gradient stimulation. Gradient stimulation initially caused a uniform increase in PHAKT-GFP signals along the entire contour of WT cells within 10 s, and this effect was followed by an abrupt signal reduction on the membrane (Fig. 5B, Upper panels), which is due to the excitable property of PIP3 production (10, 23, 24). These initial responses were similar in WT and gip1Δ cells (Fig. 5B), which is consistent with the kinetics of PIP3 production upon uniform stimuli (Fig. S3C). Differences between WT and gip1Δ cells were observed after the initial responses, the so-called second response. The restricted accumulation of PHAKT-GFP was induced at the high side of the gradient in WT cells showing gradient sensing but not in gip1Δ cells (Fig. 5B). The diminished signals were never retained in gip1Δ cells. These data indicate that gip1Δ cells can detect information about the initial increase in cAMP but not gradient information with sufficient accuracy at higher chemoattractant ranges.
We further assessed Gip1-dependent Gα2 translocation under cAMP gradients by using a theta glass pipette with two separate chambers containing 0 and 10 nM cAMP solutions, respectively (Fig. 5C, Top Left). In WT cells, Gα2-TMR accumulated in the area stimulated with a higher cAMP concentration (Fig. 5C, arrowheads). The fluorescence intensities of Gα2-TMR in the stimulated region were 1.4-fold higher than in the unstimulated region. In contrast, the uniform distribution of the fluorescence signals along the entire membrane was not changed in gip1Δ cells upon gradient stimulation (Fig. 5C). That is, receptor stimulation induced Gα2 accumulation at the stimulated region of the membrane in a Gip1-dependent manner. Thus, Gip1-dependent G-protein translocation can underlie the availability and biased redistribution of G protein at the membrane under chemical gradients at the higher range. Moreover, the full availability of G protein to the membrane is insufficient for efficient gradient sensing at the higher range, as seen by gip1Δ cells lacking the translocation-mediated redistribution.
Such defects in gradient sensing by gip1Δ cells were also observed in moving cells. F-actin, as monitored by LimEΔcoil-RFP (25), was selectively localized at the higher cAMP gradient in WT cells, but the region of this signal was weakly restricted in gip1Δ cells (Fig. S6D). Similarly, RBD-GFP and PHAKT-GFP were localized much more broadly in gip1Δ than in WT cells (Fig. S6D). These data suggest that Gip1 confines pseudopod formation along chemical gradients through the regulation of G-protein translocation for efficient chemotaxis.
SI Text
Gip1 Is an Interactor of Trimeric G Protein.
TAP of Gip1-GFPF suggested that these proteins bind to G proteins containing various Gα subunits. In fact, two different Gα subunits, Gα2 and Gα4, coimmunoprecipitated with Gip1 (Fig. S1F). Next, we examined the interaction between Gip1 and G proteins in more detail. First, we examined whether or not the interaction is influenced by G-protein activity. GTPγS, a nonhydrolyzable analog of GTP, but not GDP, reduced the interaction between Gip1 and G protein by about 70%, suggesting that Gip1 preferentially binds to the whole G-protein complex (Fig. S1G). Second, we added purified Gip1 protein (Fig. S1H) to G protein but found no change in the stability of the G-protein complex (Fig. S1I). Third, because G proteins are composed of Gα and Gβγ subunits, we determined the subunit specificity for Gip1 binding. Each subunit was separately purified from D. discoideum cells (SI Materials and Methods), and purified Gip1 was added. As shown in Fig. S1J, Gip1 bound to the Gβγ subunit more efficiently than to Gα2 or Gα4. Fourth, coprecipitation of Gα2 or Gβ with Gip1 was not detected in Gγ-deficient (GγΔ) cells, showing that Gβγ was required for the interaction between Gα2 and Gip1 (Fig. S1K). All together, Gip1 binds to G proteins mainly through the Gβγ subunit.
Normal Responses of Signaling Molecules to Uniform Stimulation by Chemoattractants.
Chemotaxis is regulated by multiple signaling pathways downstream of activated G proteins (4). We therefore followed chemoattractant-triggered reactions to identify the precise defect in gip1Δ cells. Cells were uniformly stimulated with cAMP, and the phosphorylation of cAR1, Gα2, PKBR1, PKBA, and extracellular signal-regulated kinase (Erk)2 as well as FRET changes between G-protein subunits, PIP3 production at the plasma membrane, and actin polymerization were evaluated (Fig. S3). As detailed below, changes induced by uniform cAMP were similar for gip1Δ and WT cells.
The phosphorylation of cAR1, which is involved in normal chemotaxis (14), was evaluated by mobility shifts on an SDS gel. Phosphorylation was observed within 30 s upon cAMP stimulation and returned to baseline after 10 min in both WT and gip1Δ cells (Fig. S3A, Upper). Gα2 was also phosphorylated upon cAMP stimulation in both cell types (Fig. S3A, Lower) (16). The activation of G proteins was determined by monitoring FRET change between Gα2-Cerulean and Venus-Gβ (27). Consistent with previous findings, comparable FRET changes were observed in WT and gip1Δ cells at various cAMP concentrations (Fig. S3B, Left). We also examined the kinetics of dissociation and rebinding between Gα2-Cerulean and Venus-Gβ. Upon stimulation with 10 μM cAMP, G proteins dissociated within 10 s in both cell types (Fig. S3B, Middle). The rebinding between Gα2 and Gβ, as determined by the recovery of FRET signals following cAMP removal, had a time constant of about 25 s in both cell types (Fig. S3B, Right).
To detect PIP3 production, cells were transfected with PHAKT-GFP, which specifically binds to and is used as a live reporter of PIP3, followed by cAMP stimulation (28). PHAKT-GFP transiently translocated from the cytosol to the plasma membrane within 10 s of cAMP addition in both WT and gip1Δ cells (Fig. S3C, Left and Middle panels) (21), which also showed comparable PIP3 production in the range of cAMP concentrations from 0.1 nM to 10 μM (Fig. S3C, Right). Moreover, the phosphorylation kinetics of PKBR1 at Thr309 and PKBA at Thr278 were equivalent between WT and mutant cells, suggesting that the TorC2–PKB and PIP3 signaling pathways are activated normally in the absence of Gip1 (Fig. S3D, Upper) (29). Erk2 was also phosphorylated downstream of cAMP but independently of Gα2-Gβγ in both WT and mutant cells (Fig. S3D, Middle), which is consistent with a previous study (30). Finally, in addition to the kinetics of chemoattractant-triggered reactions, gip1Δ cells responded to cAMP concentrations up to 100 μM in a manner similar to WT cells (Fig. S3E).
Chemoattractants ultimately trigger the polymerization of F-actin for directional motility downstream of chemotactic signaling pathways. The kinetics of F-actin polymerization upon cAMP addition was indistinguishable between WT and gip1Δ cells, although the relative amount of F-actin induced by cAMP was slightly lower in the latter (Fig. S3F).
Gip1 Regulates Trimeric G-Protein Shuttling upon Receptor Stimulation.
We examined the contribution of PIP3 to G-protein translocation, as specific PH domains can bind to PIP3 (3, 4). PIP3 production was abolished pharmacologically by LY294002, an inhibitor of PI3 kinases, and genetically by the pi3k1,2 double knockout strain, but no effect on G-protein translocation was observed (Fig. S5A) (31). Further, we considered the effect of Ras activity upstream of PIP3 production and the TorC2–PKB pathway. Cells lacking RasG or RasC, two prominent Ras subtypes, showed normal G-protein translocation (Fig. S5B) (4). In addition, Gα2 responded similarly in the absence or presence of F-actin (Fig. 4A and Fig. S5C). Together, these results indicate that Gα2 translocation depends on Gip1 but not on Ras activation, PIP3 production, or actin polymerization.
Discussion
Identification of Gip1 as a Novel Regulator of Trimeric G Protein.
Using TAP of Gβ, we identified four interacting proteins with high specificity: Gα, Gγ, ElmoE, and Gip1 (Fig. 1A). ElmoE associates with Gβγ and serves as a guanine nucleotide exchange factor for Rac to control F-actin in pseudopods (18). Because the interaction between G proteins and ElmoE was unaffected in gip1Δ cells (Fig. S1D), Gip1 and ElmoE function independently. We found Gip1 can bind to various Gα subtypes, such as Gα2, Gα4, Gα5, and Gα9 (Fig. S1 D and E), although phenotypic defects of gip1Δ cells were obvious only in Gα2-dependent chemotaxis in response to cAMP during early development. As discussed below, our analyses suggest Gip1 functions as a regulator of G-protein localization between the cytosol and the plasma membrane.
Gip1-Dependent G-Protein Translocation for Wide-Range Chemtotaxis.
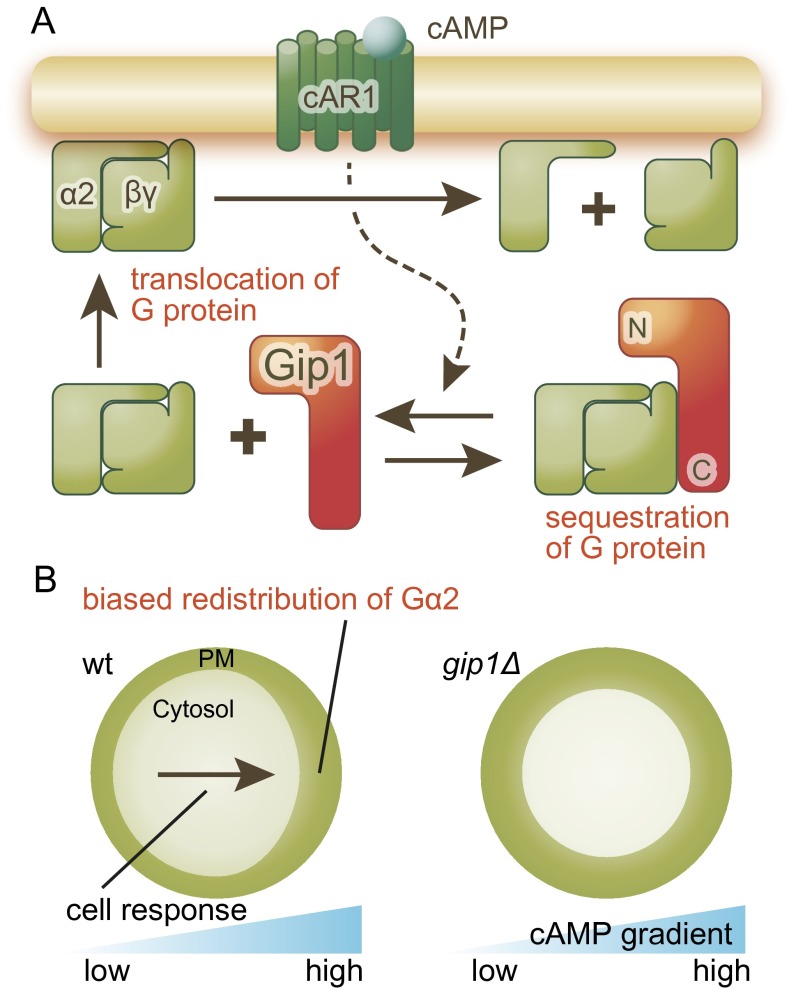
Previous studies have revealed that G proteins undergo translocation to the membrane upon receptor stimulation (17). We found that Gip1 regulates G-protein translocation by its sequestering function (Figs. 3 and 4) and is required for chemotaxis at higher ranges (Figs. 2 and 5). Furthermore, we found that receptor stimulation induced a biased redistribution of G protein under chemical gradients on the membrane in a Gip1-dependent manner (Fig. 5). Based on these observations, we propose a model in which the role of Gip1 in G-protein translocation for wide-range chemotaxis can be explained by the following three steps (Fig. S7). First, Gip1 sequesters the cytosolic pools of G proteins through binding at the C terminus, where cytosolic G proteins are not available for chemotactic signaling on the membrane (Figs. 1 and 3). Second, receptor stimulation facilitates G-protein translocation from the cytosol to the membrane depending on the N-terminal PH domain of Gip1 (Fig. 4). Third, Gip1-dependent translocation supplies a signal transducer for chemoattractant receptors at higher ranges and causes a biased redistribution of G proteins on the membrane along chemical gradients (Fig. 5). This biased redistribution contributes to proper gradient sensing at higher concentration ranges.
Fig. S7.
Model of Gip1-dependent trimeric G-protein shuttling. (A) Gip1 regulates G-protein shuttling by binding to its C terminus in the cytosol. Receptor stimulation causes the dissociation of G protein from Gip1, leading to G-protein translocation to the plasma membrane. (B) Gip1-mediated translocation of G proteins leads to redistribution along the chemical gradient in WT but not in gip1Δ cells. This reaction may be critical for the transduction of gradient information, especially at high chemical concentrations, to expand the range of sensitivity.
Chemotaxis ranges observed in the cells with the knockout, overproduction, and truncation of Gip1 can be explained by G-protein dynamics in G-protein subcellular localizations—that is, sequestering in the cytosol, translocation to the membrane, and biased redistribution on the membrane. Because G protein on the membrane is responsible for chemotactic signaling, its cytosolic sequestering by Gip1 inhibits chemotaxis. G-protein translocation upon receptor stimulation can eliminate the inhibitory effects of Gip1, resulting in fully available G protein on the membrane. Gip1OE cells have impaired chemtotaxis at the lower but not higher ranges because of excessive sequestration but functional translocation of cytosolic G protein. On the other hand, C-terminal Gip1OE cells have impaired chemotaxis at the lower and higher ranges because C-terminal Gip1 loses the translocation activity of G protein but still maintains sequestration activity. In the case of gip1Δ cells, G protein is fully available over a wide range but has an impaired biased redistribution of G protein, leading to chemotactic defects at the higher ranges. Thus, it is likely that the proper regulation of G-protein availability by Gip1 is a prerequisite for gradient sensing over a wide range. Recently, it was reported that the Ric8 homolog in Dictyostelium cells contributes to chemotaxis by amplifying G-protein activity at lower cAMP concentrations (26). Thus, the wide sensitivity to chemical gradients could be achieved by multiple mechanisms, including receptor phosphorylation, Ric8, and Gip1.
Gip1-Dependent Gradient Sensing.
We show evidence that Gip1 is involved in gradient sensing at higher chemotactic ranges (Fig. 5). Under uniform chemoattractant concentrations, gip1Δ cells exhibited receptor-induced reactions almost normally (Fig. S3). Upon gradient stimulations, gip1Δ cells initially distributed PIP3 along the entire plasma membrane (Fig. 5B). These results indicate that a sudden increase of receptor stimulation can be transduced by G protein without Gip1 leading to the excitation of PIP3, suggesting that STEN works normally without Gip1. This excitable reaction was subsequently followed by the biased accumulation of PIP3 along chemical gradients in WT cells, whereas this event was not observed in gip1Δ cells (Fig. 5 A and B). During the biased PIP3 accumulation, cells obtained gradient signals by adapting to the average concentration of the chemoattractant across the cell body, which can be explained by a local excitation and global inhibition (LEGI) model combined with STEN (LEGI–STEN model) (10). LEGI works as an adaptive network that detects gradient signals of various concentrations by combining the excitor and the inhibitor, which reflect the local and the average concentration of the chemical gradient, respectively. STEN works as an amplifier of the LEGI output to generate a localized signal in an all-or-none fashion. According to the LEGI–STEN model, gip1Δ cells likely have defective LEGI but functional STEN, because the initial PIP3 excitation was normal but the biased PIP3 accumulation was not. Our observations also suggest that the Gip1-dependent translocation and redistribution of G protein on the membrane can contribute to a gradual localization of excitor in chemotactic signaling at higher chemotactic ranges, which expands the dynamic range for chemotaxis.
Materials and Methods
Chemotaxis Assay.
Before the assay, cells were treated to proceed with their development as previously described (20). For the small population assay, ∼3,000 developed cells in a 1-µL droplet on the nonnutrient agar plate was placed next to a drop of cAMP solution. The distance between the centers of the two droplets was 2 mm. After 30 min, a responded droplet was assessed by cell accumulation at the edge near a cAMP droplet. For the micropipette assay, 2 × 10⁵ developed cells were seeded on a glass-bottom dish, and cAMP gradients were applied by a Femtotip microcapillary (Eppendorf) containing 10 or 100 µM cAMP and ATTO 532 (AD 532–21; ATTO-TEC GmbH) with a constant pressure of 10 hPa.
Gradient Sensing Assay by PHAKT-GFP Measurements.
Cells expressing PHAKT-GFP were subjected to cAMP gradients by a Femtotip microcapillary containing 100 nM or 10 µM cAMP in the presence of 5 µM latrunculin A. Fluorescence images of PHAKT-GFP were acquired by confocal microscopy at 1- or 10-s intervals. Fluorescence intensities were measured along the plasma membrane of each cell and then normalized by the average intensity of the perimeter.
Trimeric G-Protein Translocation.
Starved cells expressing Gα2-TMR and TMR-Gγ were treated with 5 µM latrunculin A. Cells were stimulated uniformly by adding 200 µL of various concentrations of cAMP solution to 10 µL of a cell suspension droplet in a glass-bottom dish. Fluorescence images were acquired by confocal microscopy at 4-s intervals, and the intensities on the plasma membrane and the cytosol were measured.
Cell Preparations and Other Methods.
Dictyostelium discoideum cells were used for all experiments. Full methods and any associated references are described in SI Materials and Methods.
SI Materials and Methods
Cell Growth and Differentiation.
D. discoideum AX2 was used as the parental strain. Cells were axenically cultured in HL5 medium (Formedium) or grown on a slime mould (SM) plate (Formedium) with a Klebsiella aerogenes lawn at 22 °C. Chemotactic competent cells were prepared as previously described (20). Briefly, exponentially growing cells were collected and developed in developmental buffer (DB) consisting of 5 mM Na/KPO4 buffer (pH 6.5), 2 mM MgSO4, and 0.2 mM CaCl2 after 1 h of starvation, followed by the addition of 60 nM cAMP every 6 min for 4 h.
gip1Δ cells were generated by homologous recombination using a disruption cassette containing the blasticidin S resistance (BSR) gene. The gip1 disruption plasmid was constructed as follows. Two regions of the gip1 genomic DNA—from −332 to +197 and +598 to +1,072—were amplified, and BSR was inserted between them (+1 indicates the first nucleotide of the gip1 gene). A BamHI-digested disruption plasmid was introduced into the cells, which were cultured in HL5 medium and selected with 5 μg/mL blasticidin S. The transformants were cloned on a K. aerogenes lawn and screened by PCR and immunoblotting using homemade anti-Gip1 polyclonal antibodies. BSR-free gip1Δ cells were generated by expressing Cre recombinase from the pDEX-NLS-Cre plasmid. gip1Δ cell phenotypes were identified on the K. aerogenes lawn or by plating on nonnutrient DB agar [1.5% (wt/vol) agar in DB].
Plasmids.
Plasmids were constructed by the In-Fusion technique (Clontech Laboratories Inc.) unless otherwise specified. The C-terminal TAP tag vector pJK1-GFP-Flag was created by inserting the fragment containing the Glycine linker-PreScisson cleavage site GFP-Flag epitope into pJK1. The N-terminal TAP tag vector pTX-Flag2-GFP was created by inserting two tandem Flag epitopes into the KpnI site of pTX-GFP. The Gβ and Gγ genes were inserted into pTX-Flag2-GFP. Full-length (amino acids 1–310) Gip1 and N- and C-terminal fragments (amino acids 1–109 and 108–310, respectively) were amplified by PCR from genomic DNA and cloned into pJK1-GFP-Flag. TAP tagging of Gα2 was carried out by inserting a C-terminal TAP tag at amino acid 90 of Gα2. Halo tag was inserted at amino acid 90 of Gα2 and at the N terminus of Gγ. pESUMO-Gip1 was constructed by cloning the coding region of Gip1 at the BsaI site (LifeSensors Inc.). TAP tagging of Gα4 was carried out by inserting a C-terminal TAP tag at amino acid 91 of Gα4.
TAP and Protein Identification by MS.
Cells were lysed on ice in CHAPS lysis buffer consisting of 40 mM Hepes (pH 7.5), 120 mM NaCl, 20 mM NaF, 2 mM Na3VO4, 20 mM sodium pyrophosphate, 0.3% CHAPS, and complete EDTA-free protease inhibitor (Roche) for 5 min followed by centrifugation for 15 min to remove debris. WCEs were pretreated with Sepharose 4B beads for 30 min, and unbound supernatant was incubated with anti-Flag M2 beads (Sigma-Aldrich) at 4 °C for 2 h. Protein samples were eluted with Flag peptide in CHAPS lysis buffer following extensive washing. The pull-down was accomplished by mixing the eluates with GFP-Trap-A beads (ChromoTek) at 4 °C for 1.5 h. Protein samples were prepared by boiling the beads in 1× SDS sample buffer. Protein samples were separated for MS analysis by SDS polyacrylamide gel electrophoresis on a 4–15% gel (Bio-Rad). Protein bands were visualized by silver staining (Wako Pure Chemical Industries, Ltd.) and excised, and the constituent proteins were digested with trypsin. Peptides were separated by high-performance liquid chromatography and identified by tandem MS.
Pull-Down Assay.
Cell extracts were prepared using CHAPS lysis buffer. Flag-tagged proteins were pulled down with anti-Flag M2 beads at 4 °C for 2 h. Protein samples were prepared by boiling the beads in 1× SDS sample buffer.
Biochemical Assay for Gip1.
Gip1 purification.
His6-Sumo–tagged Gip1 was expressed in bacteria and purified by Ni2+ resins. The eluted fraction was incubated with Sumo-star protease at 4 °C overnight, followed by mixing with Ni2+ resins to remove His6-Sumo. The flow-through fraction was applied to gel-filtration column chromatography to collect Gip1.
Guanine nucleotide effect for the interaction between Gip1 and G proteins.
Gip1-GFPF was purified from D. discoideum WCEs in the presence of none, 50 μM GDP, or 50 μM GTPγS.
Gip1 effect for the stability of G proteins.
F2G-Gβ was purified from D. discoideum WCEs and then incubated with various amounts of bacterially purified Gip1 in CHAPS lysis buffer containing 0.1 mg/mL BSA at 21 °C for 30 min. F2G-Gβ–bound M2 beads were further washed by CHAPS lysis buffer and boiled in 1× SDS sample buffer.
The binding specificity of Gip1 to G proteins.
Gα2-GFPF, Gα4-GFPF, or F2G-Gβ was purified from D. discoideum WCEs in RIPA buffer containing 10 mM Tris (pH 7.5), 150 mM NaCl, 0.1% SDS, 1% Triton X-100, 1% Deoxycholate, 5 mM EDTA, and complete EDTA-free protease inhibitor. Because RIPA buffer makes the subunit of G protein dissociate, only an α or βγ subunit was present on the M2 beads. Protein-bound M2 beads were mixed with bacterially purified Gip1 in CHAPS lysis buffer at 21 °C for 30 min, extensively washed, and boiled.
Cell Fractionation Assay.
Cells were mechanically disrupted by forcefully passing them through a Whatman 5-μm nuclepore track-etch membrane (GE Healthcare Life Science), and WCEs were fractionated into supernatant and pellet by centrifugation at 17,700 × g for 1 min.
Immunoblotting.
Differentiated cells were pretreated with caffeine at a final concentration of 5 mM to block de novo cAMP synthesis. After washing out the caffeine, cells were stimulated with 1 μM cAMP unless otherwise stated and lysed by boiling in SDS sample buffer for the indicated times. Proteins were blotted onto a polyvinylidene difluoride membrane, which was probed with the appropriate antibodies. Signals were visualized by chemiluminescence (Millipore), and images were acquired with ImageQuant LAS (GE Healthcare Life Science). A monoclonal anti-M2 antibody (Sigma-Aldrich) was used to detect the Flag epitope. A polyclonal anti-GFP antibody was purchased from Medical & Biological Laboratories. All phospho-specific antibodies were purchased from Cell Signaling Technology, including those used to detect phospho-PKC(pan) (190D10; cat. no. 2060) and phospho-Erk1/2 (D13.14.4E; cat. no. 4370). Rabbit polyclonal anti-Gβ and anti-Gip1 antibodies were generated against peptides amino acids 35–51 and 96–110, respectively. Rabbit polyclonal anti-Gα2 antibody was kindly provided by H. Kuwayama, Tsukuba University, Tsukuba, Japan.
F-Actin Assay.
Differentiated cells were pretreated with caffeine at a final concentration of 5 mM, washed with phosphate magnesium (PM) buffer consisting of 5 mM Na/KPO4 buffer (pH 6.5) and 2 mM MgSO4, and suspended in PM buffer with 1 mM caffeine. Cells were acclimated to room temperature for 10 min with shaking followed by stimulation with 1 μM cAMP. Cell aliquots were lysed by adding equal volumes of 2× assay buffer consisting of 2% Triton X-100, 20 mM KCl, 20 mM EGTA, 20 mM imidazole, and 0.1 mg/mL NaN3. Cell lysates were incubated at room temperature for 10 min and centrifuged at 8,000 × g for 4 min to collect the Triton-insoluble cytoskeletal fraction, which was washed with 1× assay buffer and boiled in 2× SDS sample buffer. Proteins were separated by SDS/PAGE, and the gel was stained with Coomassie Brilliant Blue. Images were acquired with ImageQuant LAS4000 for the quantification of actin (40 kDa).
Chemotaxis Assay.
Before the assay, cells were treated to proceed with their development as previously described (20). For the small population assay, ∼3,000 developed cells were placed on a 1% nonnutrient agar plate (010-08725; Wako Pure Chemical Industries, Ltd.) in development buffer (DB; 5 mM Na/KPO4, 0.2 mM CaCl2, 2 mM MgSO4, pH 6.5) as a 1-µL droplet of cell suspension in DB. A drop of cAMP in DB was placed next to the cell droplet for 30 min. The distance between the centers of the two droplets was 2 mm. For the micropipette assay, 2 × 10⁵ developed cells were seeded on a 27-mm glass-bottom dish (Iwaki Glass Company), and a Femtotip microcapillary (Eppendorf) containing 10 or 100 µM cAMP and ATTO 532 (AD 532–21; ATTO-TEC GmbH) was placed at the center of the dish. A constant pressure of 10 hPa was applied to the capillary using FemtoJet (Eppendorf).
Quantitative Analysis of Chemotaxis Efficiency in the Micropipette Assay.
Movie files captured from 50 to 80 min after cAMP application at 10-s intervals were used for the following analysis. Cells moving separately (i.e., cells not contacting other cells) were tracked using laboratory-developed software. Each trajectory was divided into short trajectories of 2-min intervals. Chemotaxis index and motility speed were analyzed for each short trajectory. Chemotaxis index was calculated as the cosine of the angle between the direction of movement and the direction from the start point to the micropipette. Motility speed was analyzed as the total traveled distance divided by time. Analyzed values of trajectories were sorted by distance from the end point of each trajectory to the tip of the micropipette and are shown as histograms.
FRET Assay.
A cAMP dose–response analysis of FRET between Gα2-Cerulean and Venus-Gβ was carried out in cell suspensions using an F-2700 fluorometer (Hitachi High Technologies) with a high-sensitivity cell holder. A 200-µL cell suspension of 5 × 10⁶ cells per mL was measured. Cells were stimulated with 5 µL of cAMP solution of various concentrations. Fluorescence intensities derived from FRET (FRETC) were obtained from fluorometer measurements after correction as previously described using the following equation:
where FRET and Dfd are fluorescence at 530 and 470 nm, respectively, observed using 407-nm excitation, and Afa is fluorescence at 530 nm observed using 470-nm excitation. For the intermolecular FRET measurement, FRETC was dependent on the expression level of the donor (i.e., Cerulean). To compare FRETC, values were corrected by dividing by the fluorescence intensity of directly excited Cerulean. FRET changes after the addition and removal of cAMP were detected by confocal microscopy (FV2000; Olympus). Cells were treated with 5 µM latrunculin A. Fluorescent images of Gα2-Cerulean and Venus-Gβ expression in individual cells were captured at 1-s intervals, and the fluorescence intensity ratio of Venus to Cerulean was measured at each time point.
Gradient Sensing Assay by PHAKT-GFP Measurements.
Cells expressing PHAKT-GFP were treated with 5 µM latrunculin A. cAMP gradients were provided by using a Femtotip microcapillary containing 100 nM or 10 µM cAMP. Fluorescence images of PHAKT-GFP were acquired by confocal microscopy at 1- or 10-s intervals. Six images taken at 3 min after the gradient application were averaged to create an image for quantitative analysis. Fluorescence intensities were measured along the plasma membrane of each cell and then normalized by the average intensity of the perimeter.
Trimeric G-Protein Translocation.
Starved cells expressing Gα2-Halo and Halo-Gγ were treated with 5 µM latrunculin A and visualized by confocal microscopy at 4-s intervals. Cells were stimulated by adding 200 µL of various concentrations of cAMP solution (5 µM latrunculin A and the target concentration of cAMP in DB) to 10 µL of a cell suspension droplet in a glass-bottom dish. Fluorescence intensities of the plasma membrane and the cytosol were measured. Five frames before stimulation and all frames from 12 to 28 s after the stimulation were averaged for the pre- and poststimulation images, respectively.
Local cAMP Stimulation Using Theta Glass Pipette.
A glass capillary with septum was made using borosilicate theta clark capillary glass (Item 300114, Harvard Apparatus), a micropipette puller (PC-10, Narishige), and a microforge (MF-900, Narishige). The diameter of the capillary tip was 25 μm. The opposite sides of the capillary were filled with 0 and 10 nM cAMP, respectively. A constant pressure of 5 hPa was applied to the capillary using a microinjector (Femto Jet). cAMP was monitored by mixing fluorescent dye (ATTO 633, ATTO-TEC) in the 10 nM cAMP solution.
Supplementary Material
Acknowledgments
We thank S. Taguchi and K. Tanabe for technical assistance; T. Miyagawa for purified Gip1 proteins; and Y.K., Y.M., and M.U. laboratory members for helpful discussion and advice. We thank Dr. P. Devreotes and his laboratory members for helpful discussion and advice. We are also grateful to Dr. R. Nakagawa for MS analysis and P. Karagiannis for reading the manuscript. rasC– and rasG– cells were provided by National BioResource Project (NBRP)-Nenkin. We appreciate the basic information from the DictyBase. This work was supported by Japan Society for the Promotion of Science (JSPS) KAKENHI Grant 24570224 (to Y.K.).
Footnotes
The authors declare no conflict of interest.
This article is a PNAS Direct Submission.
This article contains supporting information online at www.pnas.org/lookup/suppl/doi:10.1073/pnas.1516767113/-/DCSupplemental.
References
- 1.Trepat X, Chen Z, Jacobson K. Cell migration. Compr Physiol. 2012;2(4):2369–2392. doi: 10.1002/cphy.c110012. [DOI] [PMC free article] [PubMed] [Google Scholar]
- 2.Kolaczkowska E, Kubes P. Neutrophil recruitment and function in health and inflammation. Nat Rev Immunol. 2013;13(3):159–175. doi: 10.1038/nri3399. [DOI] [PubMed] [Google Scholar]
- 3.Van Haastert PJM, Devreotes PN. Chemotaxis: Signalling the way forward. Nat Rev Mol Cell Biol. 2004;5(8):626–634. doi: 10.1038/nrm1435. [DOI] [PubMed] [Google Scholar]
- 4.Artemenko Y, Lampert TJ, Devreotes PN. Moving towards a paradigm: Common mechanisms of chemotactic signaling in Dictyostelium and mammalian leukocytes. Cell Mol Life Sci. 2014;71(19):3711–3747. doi: 10.1007/s00018-014-1638-8. [DOI] [PMC free article] [PubMed] [Google Scholar]
- 5.Zigmond SH. Ability of polymorphonuclear leukocytes to orient in gradients of chemotactic factors. J Cell Biol. 1977;75(2 Pt 1):606–616. doi: 10.1083/jcb.75.2.606. [DOI] [PMC free article] [PubMed] [Google Scholar]
- 6.Fisher PR, Merkl R, Gerisch G. Quantitative analysis of cell motility and chemotaxis in Dictyostelium discoideum by using an image processing system and a novel chemotaxis chamber providing stationary chemical gradients. J Cell Biol. 1989;108(3):973–984. doi: 10.1083/jcb.108.3.973. [DOI] [PMC free article] [PubMed] [Google Scholar]
- 7.Ueda M, Shibata T. Stochastic signal processing and transduction in chemotactic response of eukaryotic cells. Biophys J. 2007;93(1):11–20. doi: 10.1529/biophysj.106.100263. [DOI] [PMC free article] [PubMed] [Google Scholar]
- 8.Hoeller O, Gong D, Weiner OD. How to understand and outwit adaptation. Dev Cell. 2014;28(6):607–616. doi: 10.1016/j.devcel.2014.03.009. [DOI] [PMC free article] [PubMed] [Google Scholar]
- 9.Arai Y, et al. Self-organization of the phosphatidylinositol lipids signaling system for random cell migration. Proc Natl Acad Sci USA. 2010;107(27):12399–12404. doi: 10.1073/pnas.0908278107. [DOI] [PMC free article] [PubMed] [Google Scholar]
- 10.Tang M, et al. Evolutionarily conserved coupling of adaptive and excitable networks mediates eukaryotic chemotaxis. Nat Commun. 2014;5:5175. doi: 10.1038/ncomms6175. [DOI] [PMC free article] [PubMed] [Google Scholar]
- 11.Tu Y. Quantitative modeling of bacterial chemotaxis: Signal amplification and accurate adaptation. Annu Rev Biophys. 2013;42(February):337–359. doi: 10.1146/annurev-biophys-083012-130358. [DOI] [PMC free article] [PubMed] [Google Scholar]
- 12.Fain GL, Matthews HR, Cornwall MC, Koutalos Y. Adaptation in vertebrate photoreceptors. Physiol Rev. 2001;81(1):117–151. doi: 10.1152/physrev.2001.81.1.117. [DOI] [PubMed] [Google Scholar]
- 13.Marchese A, Chen C, Kim Y-M, Benovic JL. The ins and outs of G protein-coupled receptor trafficking. Trends Biochem Sci. 2003;28(7):369–376. doi: 10.1016/S0968-0004(03)00134-8. [DOI] [PubMed] [Google Scholar]
- 14.Kim JY, et al. Phosphorylation of chemoattractant receptors is not essential for chemotaxis or termination of G-protein-mediated responses. J Biol Chem. 1997;272(43):27313–27318. doi: 10.1074/jbc.272.43.27313. [DOI] [PubMed] [Google Scholar]
- 15.Xiao Z, Yao Y, Long Y, Devreotes P. Desensitization of G-protein-coupled receptors. Agonist-induced phosphorylation of the chemoattractant receptor cAR1 lowers its intrinsic affinity for cAMP. J Biol Chem. 1999;274(3):1440–1448. doi: 10.1074/jbc.274.3.1440. [DOI] [PubMed] [Google Scholar]
- 16.Gundersen RE, Devreotes PN. In vivo receptor-mediated phosphorylation of a G protein in Dictyostelium. Science. 1990;248(4955):591–593. doi: 10.1126/science.2110382. [DOI] [PubMed] [Google Scholar]
- 17.Elzie CA, Colby J, Sammons MA, Janetopoulos C. Dynamic localization of G proteins in Dictyostelium discoideum. J Cell Sci. 2009;122(Pt 15):2597–2603. doi: 10.1242/jcs.046300. [DOI] [PMC free article] [PubMed] [Google Scholar]
- 18.Yan J, et al. A Gβγ effector, ElmoE, transduces GPCR signaling to the actin network during chemotaxis. Dev Cell. 2012;22(1):92–103. doi: 10.1016/j.devcel.2011.11.007. [DOI] [PMC free article] [PubMed] [Google Scholar]
- 19.Lou Y, Liu S. The TIPE (TNFAIP8) family in inflammation, immunity, and cancer. Mol Immunol. 2011;49(1-2):4–7. doi: 10.1016/j.molimm.2011.08.006. [DOI] [PubMed] [Google Scholar]
- 20.Kamimura Y, Tang M, Devreotes P. Assays for chemotaxis and chemoattractant-stimulated TorC2 activation and PKB substrate phosphorylation in Dictyostelium. Methods Mol Biol. 2009;571:255–270. doi: 10.1007/978-1-60761-198-1_17. [DOI] [PMC free article] [PubMed] [Google Scholar]
- 21.Parent CA, Blacklock BJ, Froehlich WM, Murphy DB, Devreotes PN. G protein signaling events are activated at the leading edge of chemotactic cells. Cell. 1998;95(1):81–91. doi: 10.1016/s0092-8674(00)81784-5. [DOI] [PubMed] [Google Scholar]
- 22.Janetopoulos C, Ma L, Devreotes PN, Iglesias PA. Chemoattractant-induced phosphatidylinositol 3,4,5-trisphosphate accumulation is spatially amplified and adapts, independent of the actin cytoskeleton. Proc Natl Acad Sci USA. 2004;101(24):8951–8956. doi: 10.1073/pnas.0402152101. [DOI] [PMC free article] [PubMed] [Google Scholar]
- 23.Postma M, et al. Sensitization of Dictyostelium chemotaxis by phosphoinositide-3-kinase-mediated self-organizing signalling patches. J Cell Sci. 2004;117(Pt 14):2925–2935. doi: 10.1242/jcs.01143. [DOI] [PubMed] [Google Scholar]
- 24.Nishikawa M, Hörning M, Ueda M, Shibata T. Excitable signal transduction induces both spontaneous and directional cell asymmetries in the phosphatidylinositol lipid signaling system for eukaryotic chemotaxis. Biophys J. 2014;106(3):723–734. doi: 10.1016/j.bpj.2013.12.023. [DOI] [PMC free article] [PubMed] [Google Scholar]
- 25.Schneider N, et al. A Lim protein involved in the progression of cytokinesis and regulation of the mitotic spindle. Cell Motil Cytoskeleton. 2003;56(2):130–139. doi: 10.1002/cm.10139. [DOI] [PubMed] [Google Scholar]
- 26.Kataria R, et al. Dictyostelium Ric8 is a nonreceptor guanine exchange factor for heterotrimeric G proteins and is important for development and chemotaxis. Proc Natl Acad Sci USA. 2013;110(16):6424–6429. doi: 10.1073/pnas.1301851110. [DOI] [PMC free article] [PubMed] [Google Scholar]
- 27.Janetopoulos C, Jin T, Devreotes P. Receptor-mediated activation of heterotrimeric G-proteins in living cells. Science. 2001;291(5512):2408–2411. doi: 10.1126/science.1055835. [DOI] [PubMed] [Google Scholar]
- 28.Asano Y, Nagasaki A, Uyeda TQP. Correlated waves of actin filaments and PIP3 in Dictyostelium cells. Cell Motil Cytoskeleton. 2008;65(12):923–934. doi: 10.1002/cm.20314. [DOI] [PubMed] [Google Scholar]
- 29.Kamimura Y, et al. PIP3-independent activation of TorC2 and PKB at the cell’s leading edge mediates chemotaxis. Curr Biol. 2008;18(14):1034–1043. doi: 10.1016/j.cub.2008.06.068. [DOI] [PMC free article] [PubMed] [Google Scholar]
- 30.Brzostowski JA, Kimmel AR. Nonadaptive regulation of ERK2 in Dictyostelium: Implications for mechanisms of cAMP relay. Mol Biol Cell. 2006;17(10):4220–4227. doi: 10.1091/mbc.E06-05-0376. [DOI] [PMC free article] [PubMed] [Google Scholar]
- 31.Funamoto S, Meili R, Lee S, Parry L, Firtel RA. Spatial and temporal regulation of 3-phosphoinositides by PI 3-kinase and PTEN mediates chemotaxis. Cell. 2002;109(5):611–623. doi: 10.1016/s0092-8674(02)00755-9. [DOI] [PubMed] [Google Scholar]
Associated Data
This section collects any data citations, data availability statements, or supplementary materials included in this article.


