Significance
We address a fundamental biological issue: the source of free energy enabling high-fidelity DNA replication. DNA polymerase errors occur at about 1 per 1,000–10,000 bp, indicating “right” vs. “wrong” free energy differences ΔΔGinc = 3–5 kcal/mol. A recent paper using high inorganic pyrophosphate concentrations to “equilibrate” right and wrong forward and reverse incorporation reactions concluded that base pairing in DNA alone is sufficient to account for polymerase fidelity. By performing an explicit analysis of forward and reverse reactions, we show that steady-state pol incorporation levels are far from equilibrium for wrong incorporations, so that polymerase fidelity cannot depend solely on intrinsic DNA properties. DNA polymerases must operate under kinetic control to achieve high fidelity.
Keywords: DNA replication fidelity, polymerase, Vent, thermodynamics
Abstract
What is the free energy source enabling high-fidelity DNA polymerases (pols) to favor incorporation of correct over incorrect base pairs by 103- to 104-fold, corresponding to free energy differences of ΔΔGinc ∼ 5.5–7 kcal/mol? Standard ΔΔG° values (∼0.3 kcal/mol) calculated from melting temperature measurements comparing matched vs. mismatched base pairs at duplex DNA termini are far too low to explain pol accuracy. Earlier analyses suggested that pol active-site steric constraints can amplify DNA free energy differences at the transition state (kinetic selection). A recent paper [Olson et al. (2013) J Am Chem Soc 135:1205–1208] used Vent pol to catalyze incorporations in the presence of inorganic pyrophosphate intended to equilibrate forward (polymerization) and backward (pyrophosphorolysis) reactions. A steady-state leveling off of incorporation profiles at long reaction times was interpreted as reaching equilibrium between polymerization and pyrophosphorolysis, yielding apparent ΔG° = −RT ln Keq, indicating ΔΔG° of 3.5–7 kcal/mol, sufficient to account for pol accuracy without need of kinetic selection. Here we perform experiments to measure and account for pyrophosphorolysis explicitly. We show that forward and reverse reactions attain steady states far from equilibrium for wrong incorporations such as G opposite T. Therefore, values obtained from such steady-state evaluations of Keq are not dependent on DNA properties alone, but depend largely on constraints imposed on right and wrong substrates in the polymerase active site.
Most DNA polymerases (pols) involved in replication and repair exhibit high deoxynucleotide incorporation fidelities, favoring right (R) over wrong (W) by about 103- to 104-fold, corresponding to free energy differences ΔΔGinc ∼ 5.5–7 kcal/mol (1). Kinetic studies have identified a variety of “checkpoints” favoring the selection of R over W. Kinetic checkpoints are triggered by substrate binding; the ternary pol–DNA–dNTP complex is stabilized with dRTP and destabilized with dWTP. The associated conformational changes drive the reaction forward toward incorporation with dRTP and backward toward substrate release with dWTP favoring incorporation of R over W (reviewed in refs. 1–4). The rate-determining steps can be different for different pols and may also differ for R and W for a single pol (3, 4).
A fundamental issue is to identify possible sources of free energy that might be large enough to account for high pol incorporation fidelity. Seemingly an obvious source might be the differences in stability of matched and mismatched base pairs in the DNA itself, which involve both H-bonding and base-stacking interactions (5). In an early experiment, used here as an example, equilibrium constants (Keq) for double-stranded DNA (dsDNA) containing R and W base pairs at blunt-end termini were obtained by measuring melting temperatures in aqueous solution and used to infer standard free energy differences ΔΔG° ∼ 0.3 kcal/mol (6). Because these were far too small to account for fidelity, it was then proposed that steric constraints imposed by the pol active site could “amplify” the small free energy differences between R and W base pairing to attain ∼ 5.5–7 kcal/mol (7–9). In the absence of significant reverse reaction (pyrophosphorolysis) at low inorganic pyrophosphate (PPi) levels in vivo or in a test tube, nucleotide incorporation reactions apparently proceed far from equilibrium (10–12).
A need for energetic amplification in the pol active site was recently challenged in a thoughtful and important paper (12) that attempted to operate DNA polymerases at equilibrium. Vent pol was used to elongate primer/template (p/t) DNA by incorporating either R or W nucleotides in the presence of PPi. The concentration of PPi was sufficiently high to force an apparent leveling off of primer extension with increasing time, presumably by equilibrating forward polymerization and reverse pyrophosphorolysis rates. Apparent values of Keq were determined and used to calculate ΔG° values for R and W. Free energy differences () for incorporation of R and W were found to range from 3.5 kcal/mol to 7 kcal/mol and were thus sufficient to account for pol fidelity with no need for active-site amplification, but instead apparently reflecting intrinsic properties of p/t DNAs, dNTPs, and PPi, unperturbed by presence of polymerase. It was inferred, although not directly measured, that the leveling off in incorporation profiles was caused by sufficient pyrophosphorolysis to equilibrate forward and reverse reactions for both R and W substrates (12). Although the reverse pyrophosphorolysis reaction was reported to occur for correctly paired termini, it did not enter into the analysis and was not measured for mispaired termini.
A definitive way to determine whether equilibrium has been reached in a nucleotide incorporation reaction is to initiate R and W reactions not only with substrate DNAn (yielding ) but also with product DNAn+1 (yielding ), in the presence of dNTP and PPi, to see whether they approach the same steady-state levels, i.e., equilibrium. Here we have explicitly measured both forward and reverse reactions as a function of time for Vent and Pfu pols in the presence of varied [PPi]/[dNTP]. We find that true equilibration does not occur for mismatched base pairs. We also measure inherent R/W duplex stabilities with sequences corresponding to the primer/template DNAs and show that the DNA alone does not exhibit sufficient inherent selectivity to support an equilibration model. The new data argue that polymerases operate with high fidelity via kinetic selectivity, even when pyrophosphorolysis is encouraged.
Results
Olson et al. (12), using Vent pol with 12 p/t DNA configurations, found for each example that a leveling off of right and wrong incorporations occurred in the presence of high PPi concentration. The differences in the apparent Keq for each of the steady states reflected sufficiently large free energy differences to account for pol fidelity (average = 5.2 ± 1.34 kcal/mol), thus obviating the need for pol active-site intervention to amplify the very small free energy differences between right and wrong base pairs deduced from thermal melting studies (ΔΔG° ∼ 0.3 kcal/mol). In this paper, we have repeated the Vent pol forward incorporation experiment with one of the p/t DNA configurations (comparing A•T vs. G•T). However, the key feature of our study is that we have expanded the analysis by measuring the reverse pyrophosphorolysis reaction. Our objective is to determine whether the PPi-induced steady states for R and W incorporations are bona fide equilibrium states, because equilibrium requires that the same final DNAn+1/DNAn ratio be reached irrespective of where the reaction is initiated under identical conditions. We have also used a standard gel kinetic assay to measure the A•T vs. G•T fidelities for Vent and Pfu pols and have performed thermal melting measurements to obtain standard ΔΔG° values for R and W with p/t DNAs like those used in our polymerase studies.
Thermal Denaturation Data Reveal Inherent Pairing Selectivity at the Primer Terminus.
Early studies by Petruska et al. (6) compared matched and mismatched DNA duplex stabilities, using blunt-ended duplexes. However, most polymerase-mediated DNA synthesis occurs on templates extending well beyond the primer terminus, and DNA polymerases make contacts with the base-paired duplex substrate not only at the primer terminus, but also with the unpaired template strand multiple bases downstream of the primer (13–15). Thus, it is important to take into consideration the influence of this overhanging template strand on stability and fidelity. Indeed, more recent thermodynamics studies of DNA have shown that such overhanging (“dangling”) bases can influence the stabilities of duplexes substantially (16), and these effects are taken into account in modern folding predictor algorithms (17). Thus, we considered the possibility that such an overhanging template strand might also affect the inherent pairing selectivity at a primer terminus.
To examine this inherent pairing selectivity, we designed 15 duplexes (Table S1) similar to published primer/template sequences (12), but truncated at the ends to include 8–9 bp of duplex and 4- to 5-nt overhangs downstream of the primer end. Truncation was carried out to keep sequences simple, thus eliminating possible alternate conformations and allowing more likely two-state behavior. In addition, the chosen 8- to 9-bp duplex length yields Tm values closely matched to polymerase reaction temperatures, to avoid free energy extrapolations far from the Tm values. Six duplexes have a pyrimidine (T) at the primer terminus and nine have a purine (A or G) at this position, thus allowing for differential stacking influences. To these core duplexes we added terminal A-T/T-A and G-C/C-G pairs, as well as single-base mismatches (T-T, T-G, A-A, A-C). Comparisons of free energies of these duplexes allow experimental measurement of (i) the free energy change corresponding to addition of a correct or incorrect nucleotide to a primer terminus and (ii) the free energy differences between correct and incorrect base pairs at this terminus. Free energies were obtained from thermal denaturation experiments, using both curve-fitting methods (two-state model) and van’t Hoff methods. Close agreement was seen between the two methods, providing confirmation of two-state behavior.
Table S1.
Calculation of free energy (37 °C) for matched and mismatched duplexes with dangling ends by melting temperature
| Entry | Primer/template | Tm, °C* | , kcal/mol | , kcal/mol | †, kcal/mol | ΔΔG°, kcal/mol |
| Primer T/DNAt | ||||||
| 1 | ATATCACAT | 27.1 ± 0.5 | −6.8 ± 0.4 | −6.9 ± 0.2 | −6.9 ± 0.4 | — |
| TATAGTGTATGTCT | ||||||
| 2 | ATATCACATA | 30.3 ± 0.1 | −7.8 ± 0.1 | −7.5 ± 0.2 | −7.7 ± 0.2 | −0.8 ± 0.5 |
| TATAGTGTATGTCT | ||||||
| 3 | ATATCACATT | 27.2 ± 0.4 | −7.2 ± 0.2 | −6.8 ± 0.2 | −7.0 ± 0.3 | −0.1 ± 0.5 |
| TATAGTGTATGTCT | ||||||
| Primer T/DNAg | ||||||
| 4 | ATATCACAT | 29.5 ± 0.3 | −7.7 ± 0.2 | −7.3 ± 0.2 | −7.5 ± 0.3 | — |
| TATAGTGTAGTTCT | ||||||
| 5 | ATATCACATC | 35.8 ± 0.2 | −8.8 ± 0.0 | −8.7 ± 0.2 | −8.7 ± 0.2 | −1.2 ± 0.3 |
| TATAGTGTAGTTCT | ||||||
| 6 | ATATCACATT | 28.4 ± 0.1 | −7.6 ± 0.1 | −7.1 ± 0.2 | −7.4 ± 0.2 | 0.1 ± 0.3 |
| TATAGTGTAGTTCT | ||||||
| Primer A/DNAa | ||||||
| 7 | ATATCACGA | 33.8 ± 0.4 | −8.6 ± 0.0 | −8.1 ± 0.2 | −8.4 ± 0.2 | — |
| TATAGTGCTAGGCT | ||||||
| 8 | ATATCACGAT | 37.4 ± 0.6 | −9.0 ± 0.1 | −9.0 ± 0.2 | −9.0 ± 0.2 | −0.7 ± 0.3 |
| TATAGTGCTAGGCT | ||||||
| 9 | ATATCACGAA | 32.2 ± 0.5 | −8.3 ± 0.1 | −7.9 ± 0.1 | −8.1 ± 0.1 | 0.3 ± 0.3 |
| TATAGTGCTAGGCT | ||||||
| Primer A/DNAc | ||||||
| 10 | ATATCACGA | 31.9 ± 0.5 | −8.1 ± 0.2 | −7.9 ± 0.2 | −8.0 ± 0.3 | — |
| TATAGTGCTCAACT | ||||||
| 11 | ATATCACGAG | 41.6 ± 0.2 | −9.7 ± 0.0 | −9.9 ± 0.1 | −9.8 ± 0.1 | −1.8 ± 0.4 |
| TATAGTGCTCAACT | ||||||
| 12 | ATATCACGAA | 31.7 ± 0.4 | −8.2 ± 0.1 | −7.9 ± 0.1 | −8.0 ± 0.2 | 0.0 ± 0.4 |
| TATAGTGCTCAACT | ||||||
| Primer G/DNAt | ||||||
| 13 | ATATCACCG | 36.3 ± 0.9 | −8.4 ± 0.0 | −8.6 ± 0.4 | −8.5 ± 0.4 | — |
| TATAGTGGCTATCT | ||||||
| 14 | ATATCACCGA | 40.2 ± 0.2 | −9.1 ± 0.4 | −9.4 ± 0.3 | −9.3 ± 0.5 | −0.8 ± 0.6 |
| TATAGTGGCTATCT | ||||||
| 15 | ATATCACCGG | 37.0 ± 0.8 | −8.7 ± 0.2 | −9.1 ± 0.2 | −8.9 ± 0.3 | −0.4 ± 0.5 |
| TATAGTGGCTATCT |
Conditions: 50 mM Na•Pipes, pH 7.5, 8 mM MgCl2; 2 μM DNA strand concentration for Tm shown.
Average free energy from van’t Hoff calculations and MeltWin fits; error was propagated from the SDs of the two methods.
The data show that addition of a correct nucleotide stabilizes the duplexes consistently by a small amount (−0.7 kcal/mol to −1.8 kcal/mol at 37 °C, Table S1), as expected because the duplex is longer by 1 bp. For example, a comparison of entries 1 and 2 shows a stabilization of −0.7 kcal/mol for addition of a correct deoxyadenosine nucleotide opposite a template T. The new G-C pairs contribute −1.5 kcal/mol of stabilization on average, whereas the A-T pairs add −0.8 kcal/mol. Note that these free energy increments correspond only to a fraction of the free energy of reaction for polymerase addition of the nucleotide, which is further driven forward by the free energy difference between the covalent bonds broken and formed (breaking the α/β phosphate–phosphate bonds in the triphosphate group and forming the new phosphodiester bond).
By contrast, addition of incorrect nucleotides changes duplex stabilities very little, contributing −0.4 kcal of stabilization to +0.3 kcal of destabilization to the unextended primer/templates. In the present context, addition of a mispaired G opposite T is slightly stabilizing (−0.4 kcal; compare entries 13 and 15 in Table S1), whereas the T-T, T-G, and A-C mispaired bases change free energy negligibly, and the A-A mismatch in this context is destabilizing by +0.3 kcal.
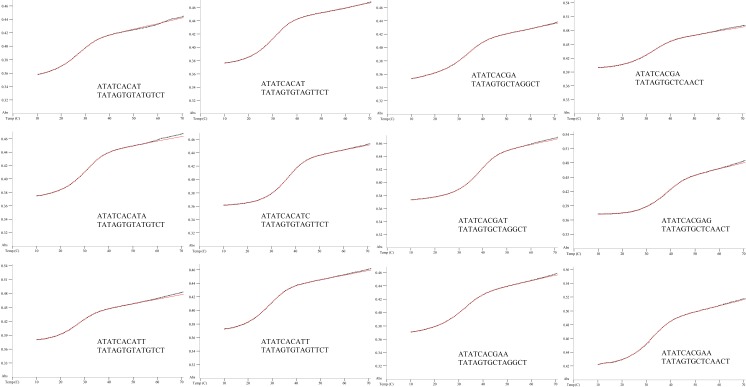
Finally, comparison of the data for duplex stabilities with correct vs. mispaired nucleotides added provides a measure of the inherent pairing selectivity at a primer/template terminus. In these comparisons the free energy differences correspond fully to the free energy difference of a polymerase incorporating a right vs. wrong nucleotide, because in these comparisons the covalent bond changes are very nearly the same. For a template T base in this sequence context, we find that pairing selectivity for a correct A addition relative to a mispaired T is −0.4 kcal/mol to −0.6 kcal/mol (entries 2, 3 and 14, 15 in Table S1). For a template G, addition of a correct C relative to an incorrect T gives a selectivity of −1.3 kcal/mol (entries 5 and 6 in Table S1). For a template A, selectivity for T incorporation relative to A misincorporation is −1.0 kcal/mol (entries 8 and 9 in Table S1). Finally, for a template C, correct G incorporation relative to incorrect A yields a selectivity of −1.8 kcal/mol (entries 11 and 12 in Table S1). Thus, the range of inherent selectivities favoring correct vs. incorrect nucleotide addition for the four DNA contexts tested is −0.4 kcal/mol to −1.8 kcal/mol at 37 °C. Free energies were obtained from thermal denaturation experiments, using both curve-fitting methods (two-state model, Fig. S1) and van’t Hoff methods (Fig. S2).
Fig. S1.
Sample melting curves at 1 μM for duplexes evaluated. Black, experimental melt data; red, curve fit from MeltWin 3.0.
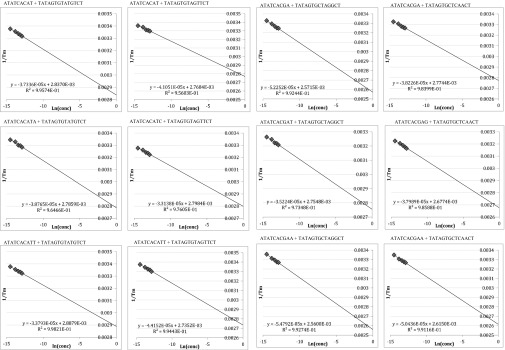
Fig. S2.
Sample van’t Hoff fits for specified sequence.
Conditions Required to Achieve Equilibrium for Right and Wrong Incorporation Reactions.
The hypothesis being tested here is that evaluation of the equilibrium constant is sufficient to determine for any DNA polymerase using R or W dNTP substrates. To interpret the results of our incorporation and pyrophosphorolysis experiments, we consider the Gibbs relationship, (18), which applies to nonequilibrium as well as equilibrium conditions, where Q is the variable reaction quotient and Keq is the equilibrium constant. The reaction quotient is the equilibrium expression evaluated at any point during the reaction, using the current reactant and product concentrations, with Q = Keq being the condition for equilibrium (ΔG = 0).
For polymerization,
| [1a] |
and at equilibrium,
| [2a] |
For pyrophosphorolysis,
| [1b] |
and at equilibrium,
| [2b] |
The condition that must be met to attain equilibrium for both R and W substrate dNTPs is
| [3] |
where R is the molar gas constant and T is the temperature in degrees kelvin. We have evaluated Eq. 3 for each reaction, using Q in place of Keq and Q′ in place of Keq′ to give apparent and values, respectively, when each reaction has leveled off with time to an apparent steady state.
For the incorporation reactions with Vent pol, approximate steady-state levels of extension by W and R occurred in the presence of PPi along with dNTP (e.g., Figs. 1B and 2B), and those steady-state values were used to obtain DNAn+1/DNAn ratios. Q values for R and W were calculated from Eq. 2a, as in the analysis described by Olson et al. (12). For the pyrophosphorolysis reactions, Q′ values were calculated from Eq. 2b. Eq. 3 was used to obtain apparent and values, for each of five dNTP concentrations and averaged over two experiments. Also, PPi and Mg2+ concentrations were optimized for pyrophosphorolysis and incorporation reactions (Fig. S3).
Fig. 1.
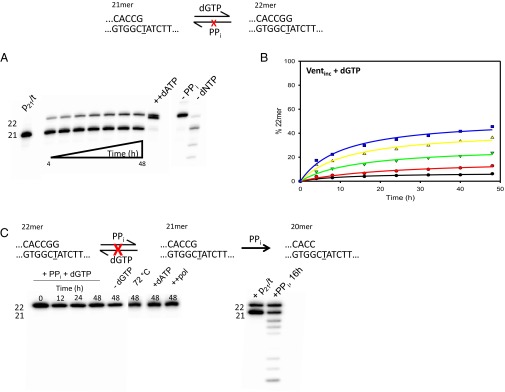
Forward and reverse reactions for misincorporation of dGTP opposite T by Vent pol. (A) Gel data obtained for a representative reaction with 1.6 mM dGTP and 11 mM PPi. The sketch at the top illustrates the reaction proceeding from primer 21mer to 22mer, by incorporation of dGTP opposite the underlined templating T, but the reverse reaction is not detected. The amount of DNA22 (G•T) increases with time. At the end of 48 h incubation, 1 mM dATP is added and allowed to react for 20 min (++dATP) to show the enzyme is still active at the end of reaction. Note that DNA22 (G•T) and DNA22 (A•T) are clearly separated as bands in the gel. The final two lanes show two controls, one containing only dGTP (−PPi) and one only PPi (−dNTP), demonstrating that the enzyme can fully extend the 21mer to 22mer with dGTP and no PPi and can perform extensive pyrophosphorolysis with PPi and no dNTP, respectively. (B) Amount of extended primer (% 22mer) as a function of reaction time, at various dGTP concentrations: 100 μM (black circles), 200 μM (red circles), 400 μM (green triangles), 800 μM (yellow triangles), and 1,600 μM (blue squares). By the end of 48-h reactions, the amount of extended primer DNA22 (G•T) is still increasing slightly. (C) Starting from DNA22 (G•T), Vent pol was unable to perform pyrophosphorolysis. The first lane shows the starting 22mer before any reaction (t = 0). The subsequent lanes are quenched at t = 12 h, 24 h, and 48 h incubation with 200 μM dGTP and 11 mM PPi. (C, Left) The lane marked −dGTP shows that no pyrophosphorolysis is occurring without the inclusion of dGTP in reaction mixture, or at higher temperature (72 °C), or with inclusion of dATP in the reaction mixture (+dATP), or with excess enzyme (++pol). (C, Right) After 48 h, 100 nM of DNA21 (G•C) was added to reveal the enzyme was still active (lane 1), and then an aliquot was quenched 16 h later (lane 2).
Fig. 2.
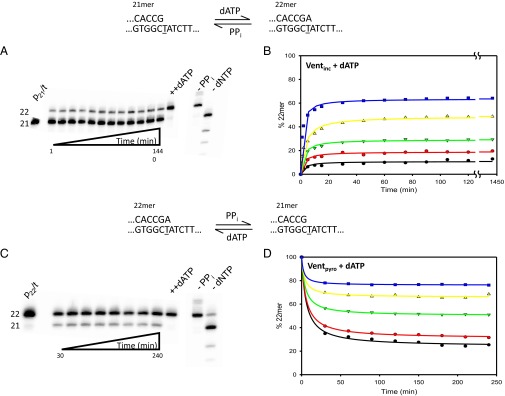
Forward and reverse reactions for correct incorporation of dATP opposite T by Vent pol. (A) Gel data showing the forward reaction for correct (A•T) incorporation. The sketch at the top shows the starting primer (21mer) being extended by the correct incorporation of dATP. The gel bands show results obtained at 8 μM concentration of dATP. The amount of DNA22 (A•T) increases with time until an apparent steady state is reached, within 20 min, and stays nearly constant for 24 h. Upon addition of 1 mM dATP after the 24-h incubation, the primer becomes fully extended, showing the enzyme is active throughout the reaction. (A, Right) The two controls show the reaction without PPi and dNTP. (B) Amount of DNA22 (A•T) observed as a function of time at various dATP concentrations: 0.5 μM (black circles), 1 μM (red circles), 2 μM (green triangles), 4 μM (yellow triangles), and 8 μM (blue squares). In each case dGTP is present at 50 μM in the reaction to prevent pyrophosphorolysis continuing beyond the 20mer. (C) The sketch at the top describes the pyrophosphorolysis reaction converting 22mer primer to 21mer. The gel bands show results of reaction with 8 μM dATP and 15 mM PPi starting with 22mer as initial primer. As the reaction is carried out, aliquots are quenched at various times to show the increase in amount of 21mer produced [DNA21 (G•C)]. At the end of the 4-h reaction, a large amount of dATP is added (++dATP) to show the enzyme is still active. The final two lanes show the reaction products when only dNTPs are included (−PPi) and when only PPi is included (−dNTP). (D) Reverse reactions starting from a correctly matched p/t [DNA22 (A•T)] are shown at various dATP concentrations: 0.5 μM (black circles), 1 μM (red circles), 2 μM (green triangles), 4 μM (yellow triangles), and 8 μM (blue squares). dGTP is also present at 50 μM in each case to prevent pyrophosphorolysis continuing beyond the 20mer.
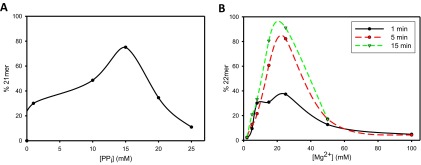
Fig. S3.
Inhibition of Vent pol by PPi and Mg2+. (A) Amount of pyrophosphorolysis resulting from a correctly matched p/t as a function of [PPi]. As the pyrophosphate concentration increases, the amount of pyrophosphorolysis increases until it peaks at 15 mM. A concentration higher than 15 mM results in inhibition. Each reaction was carried out for 1 h. (B) Amount of incorporation as a function of [Mg2+]. At concentrations higher than 25 mM, the Mg2+ begins to inhibit the forward reaction. The black solid line corresponds to a 1-min reaction, the red dashed line to a 5-min reaction, and the green dashed line to a 15-min reaction.
Forward and Reverse Vent Pol G•T Misincorporation Reactions.
Forward reaction.
Starting from p/t containing a matched G•C primer 3′ terminus [DNA21(G•C)], reactions were performed over a wide range of dGTP concentrations (100–1600 μM), in the presence of PPi at 11 mM (Fig. 1A). These concentrations are sufficiently high that they do not change over the course of the reaction and therefore can be used in Eq. 2a without adjustment. This is the case for all reactions. The conversion to DNA22(G•T) by the misincorporation of G opposite T is still increasing slowly by the end of the 48-h reaction. Although the rate of extension is diminishing with time, a steady state has not been attained after 48 h, at any of the five dGTP concentrations (Fig. 1B). By evaluating Q at 48 h, for comparison with Olson et al. (12), we obtained an average apparent (G•T) = −1.19 ± 0.10 kcal/mol (Table 1), which differs by 3.7-fold from the −0.32 ± 0.59 kcal/mol for the value for Vent pol reported previously. Extrapolation of a rectangular hyperbola empirical fit to the data (Fig. 1B, solid curves) to infinite time gives an apparent (G•T) = −1.27 ± 0.17 kcal/mol.
Table 1.
Summary of results of apparent free energy calculations
| Primer/template | Reaction* | Apparent †, kcal/mol | Apparent ‡, kcal/mol | |
| …CACCG21 | Ventinc | +dGTP | −1.19 ± 0.10 | |
| …GTGGCTATCTT… | ||||
| …CACCGG22 | Ventpyro | +dGTP | > +7.5§ | |
| …GTGGCTATCTT… | ||||
| …CACCG21 | Ventinc | +dATP | −5.22 ± 0.05 | |
| …GTGGCTATCTT… | ||||
| …CACCGA22 | Ventpyro | +dATP | +5.51 ± 0.09 | |
| …GTGGCTATCTT… | ||||
| …CACCG21 | Pfuinc | +dGTP | −0.21 ± 0.11 | |
| …GTGGCTATCTT… | ||||
| …CACCGG22 | Pfupyro | +dGTP | +5.89 ± 0.13 | |
| …GTGGCTATCTT… | ||||
| …CACCG21 | Pfuinc | +dATP | −5.41 ± 0.15 | |
| …GTGGCTATCTT… | ||||
| …CACCGA22 | Pfupyro | +dATP | +6.03 ± 0.32 | |
| …GTGGCTATCTT… | ||||
Values are reported as mean ± SD.
Pyrophosphate is present in all reactions.
Inc indicates the reaction begins with 21mer primer and dNTP is incorporated by polymerization.
Pyro indicates the reaction begins with a 22mer primer and dNTP is removed by pyrophosphorolysis.
Vent is unable to perform pyrophosphorolysis on mismatched p/t; therefore the value given is based on the detection limit of the assay.
Three important control reactions are shown in Fig. 1A. To reveal that Vent pol has remained active over the entire reaction period, the addition of 1 mM dATP at 48 h is shown to convert virtually all of the DNA21(G•C) to DNA22(A•T) product in 20 min (Fig. 1A, ++dATP). The difference between DNA22(A•T) and DNA22(G•T) is clearly evident on the gel and appears as a doublet, with DNA22(A•T) running slightly below DNA22(G•T). There is no band shortened by pyrophosphorolysis [DNA20(C•G)] when dGTP is included in the reaction in absence of PPi. Instead, essentially all of the primer is extended to DNA22(G•T), and the faint band appearing above DNA22(G•T) indicates G•A misincorporation yielding DNA23(G•A) (Fig. 1A, −PPi). When PPi is present in the absence of dGTP, the series of bands migrating below DNA21(G•C) arise from processive pyrophosphorolysis occurring at correctly paired p/t DNA 3′ ends (Fig. 1A, −dNTP), as well as a small band at DNA22(A•T) resulting from the incorporation of dATP made by pyrophosphorolysis opposite T (Fig. 1A, −dNTP).
Reverse reaction.
Equilibrium requires that the same steady state is reached for the ratio of DNA22(G•T)/DNA21(G•C) when the reactions are run from any starting position; e.g., in the forward and reverse directions, under identical conditions; i.e., same [dNTP], [p/t DNA], [polymerase], [PPi], and temperature. The condition to achieve equilibrium, = (Eq. 3), has not been met because at the 11 mM PPi concentration used in the forward reaction above, the reverse reaction starting from DNA22(G•T) shows no detectable DNA21(G•C) product for reaction time up to 48 h, either in the presence or in the absence of dGTP (Fig. 1C, Left gel). Based on our assay sensitivity, we roughly estimate that (G•T) > 7.5 kcal/mol (Table 1).
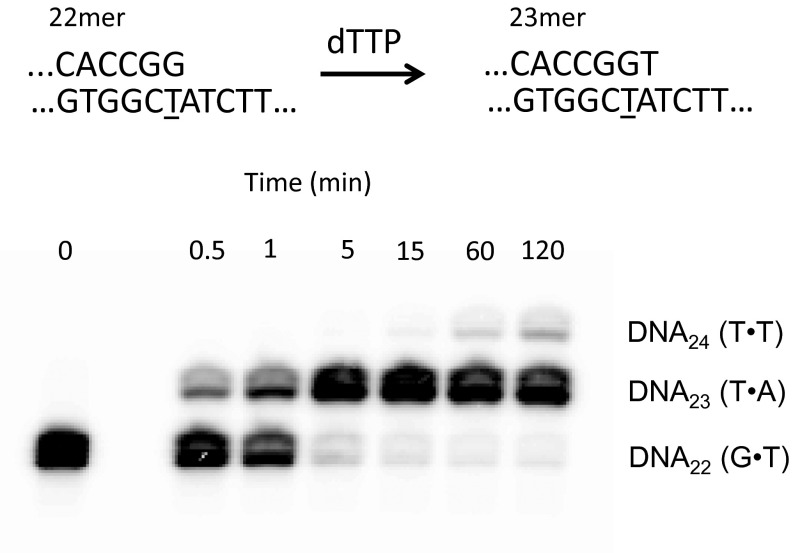
To test the hypothesis that the reverse reaction was not occurring due to the polymerase being unable to bind the mismatched substrate, we performed an extension assay using DNA22(G•T) (Fig. S4). Using the same 20:1 DNA:pol ratio along with the next correct base, dTTP, the enzyme is able to extend the mismatched DNA to essentially 100% within 15 min to yield DNA23(T•A). The polymerase is further able to misincorporate dTTP opposite the templating dT to give DNA24(T•T) as shown in the 60-min and 120-min time points. Thus, the absence of a reverse reaction cannot be attributed to a failure to bind at a mismatched 3′ end, because addition of a next correct, and even incorrect, deoxynucleotide is readily observed.
Fig. S4.
Extension of mismatched DNA with Vent pol. Starting with DNA22 (G•T), dTTP was added to the reaction with Vent pol to determine whether the pol was able to bind the mismatched substrate. Within 30 s, a significant amount of the primer was correctly extended past the mismatch. Within 60 min, the pol was able to not only fully extend the initial mismatched DNA, but also misincorporate dTTP opposite the templating dT.
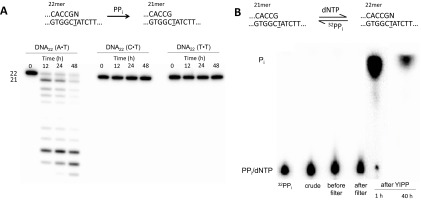
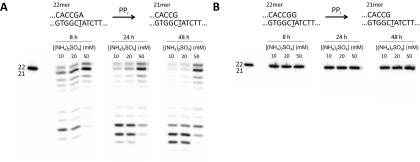
Vent pol is also apparently unable to catalyze pyrophosphorolysis at G•T termini even at 72 °C (Fig. 1C) or at the other two mismatched termini (C•T and T•T) at 37 °C (Fig. S5A) or with a 20-fold excess of Vent pol to DNA22(G•T) (Fig. 1C). Nor is pyrophosphorolysis observed in the presence of dATP, where we should have observed a doublet due to the correct incorporation of A following pyrophosphorolysis of DNA22(G•T) as shown in Fig. 1A. Following a 48-h incubation with DNA22(G•T) in the absence of dGTP, we added DNA21(G•C) to the reaction mix. After an additional 16-h incubation, we observed the pyrophosphorolytic removal of the correctly matched terminal G, accompanied by continued p/t DNA degradation at sites 20, 19, and 18 (Fig. 1C, Right gel). Thus, Vent pol remains active for at least 48 h and can pyrophosphorolytically remove correctly matched but not mismatched p/t DNA termini. Using 32PPi, we confirmed that the products are dNTPs (Fig. S5B), and therefore, the reaction is in fact pyrophosphorolysis, not exonuclease or some other degradation reaction. Furthermore, we tested the activity of Vent pol at higher ionic strengths (Fig. S6) and did not observe bands corresponding to the pyrophosphorolytic removal of the mismatch (Fig. S6B) despite seeing activity for DNA22(A•T) (Fig. S6A).
Fig. S5.
Pyrophosphorolysis reactions with Vent pol. (A) Pyrophosphorolysis of DNA22 (A•T), DNA22 (C•T), and DNA22 (T•T). Of the four possible 22mer primers, pyrophosphorolysis is observed only on the correctly matched [DNA22 (A•T)] without the presence of dNTPs. Aliquots were quenched at 0 h, 12 h, 24 h, and 48 h. (B) Pyrophosphorolysis of DNA21 (G•C) in the presence of 32PPi. Pyrophosphorolysis reactions were carried out for 1 h or 40 h with carrier-free 32PPi to confirm dNTPs are the product of the pyrophosphorolysis reaction. After the reaction time, DNA and enzyme were removed using a 3-kDa cutoff filter. The filtrate was then incubated with yeast inorganic pyrophosphatase (YIPP) to turn any remaining PPi to inorganic phosphate (Pi), which is readily separated from dNTPs by TLC. After 1 h, a small spot corresponding to dNTPs is seen on the TLC plate, but by 40 h, these dNTPs have been reincorporated by Vent pol into the DNA and are no longer observed as a spot.
Fig. S6.
Effect of increasing ionic strength on pyrophosphorolysis activity. (A) Correctly matched p/t terminus. Increasing the amount of (NH4)2SO4 present in the reaction buffer results in a decrease in pol activity, although considerable pyrophosphorolysis is still observed at a fivefold increase. (B) Incorrectly matched p/t terminus. No pyrophosphorolysis activity is observed, even at 48 h, upon increasing (NH4)2SO4.
Forward and Reverse Vent Pol A•T Incorporation Reactions.
Forward reaction.
Starting from p/t DNA21(G•C), a time course for extension to DNA22(A•T), using various dATP concentrations, was measured in the presence of dGTP (50 μM) and PPi (15 mM) (Fig. 2A). As described in Olson et al. (12), dGTP was included in the reaction to counteract pyrophosphorolytic degradation of the DNA21(G•C) primer, expecting that removal of G is highly likely to be followed by the incorporation of G to restore the DNA21(G•C) primer. The forward reactions performed at five concentrations of dATP (0.5–8 μM) and 15 mM PPi appeared to reach steady state at ∼60 min for each concentration of dATP and remained constant over the course of 24 h (Fig. 2B). Taking an average of results obtained using Eqs. 2a and 3 gives an apparent (A•T) = −5.22 ± 0.05 kcal/mol (Table 1), which agrees with (A•T) = −5.12 ± 0.16 kcal/mol published for Vent pol by Olson et al. (12). The controls performed to verify (i) retention of Vent pol activity (Fig. 2, ++dATP), (ii) the ability to fully extend DNA21(G•C) without p/t DNA degradation in the absence of PPi (Fig. 2, −PPi), and (iii) processive pyrophosphorolysis in the absence of dGTP and dATP (Fig. 2, −dNTP) were as described above for the forward G•T misincorporation reaction (Fig. 1A).
Reverse reaction.
Gel data illustrating the pyrophosphorolytic conversion of p/t DNA22(A•T) → DNA21(G•C), occurring in the presence of dATP (8 μM), dGTP (50 μM), and PPi (15 mM) during a 4-h incubation, are shown in Fig. 2C. The same reactions for a wide concentration range of dATP concentrations (0.5–8 μM), plotted as a function of time, show that an approximate steady state for each dATP concentration is reached in about 60 min (Fig. 2D). Calculating an average from the composite data gives apparent (A•T) = +5.51 ± 0.09 kcal/mol (Table 1), which differs by only 0.29 kcal/mol from the +5.22 kcal/mol expected from the apparent . Thus, for correct (A•T) primer–template base pairing, forward and reverse reactions catalyzed by Vent pol apparently reached steady-state Q and Q′ values close to Keq and Keq′, respectively.
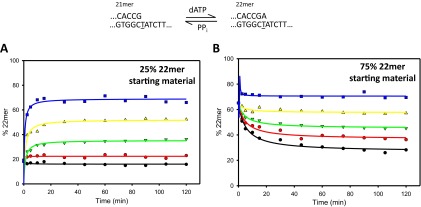
To independently verify that forward and reverse reactions attain similar steady states, i.e., close to equilibrium, and to establish a leveling-off range for the two reactions, we initiated the reactions with a mix of p/t DNA substrates, with DNA22(A•T)/DNA21(G•C) ratios of 1:3 (Fig. S7A) and 3:1 (Fig. S7B). Starting from a deficit of DNA22(A•T), to reach steady state requires increased conversion to DNA22(A•T) before leveling off (Fig. S7A), whereas a concomitant reduction is expected when starting from an excess of DNA22(A•T) (Fig. S7B). The standard free energies obtained from the mixed substrate steady-state data are (A•T) = −5.16 ± 0.08 kcal/mol (1:3 DNA22/DNA21) and (A•T) = +5.45 ± 0.23 kcal/mol (3:1 DNA22/DNA21), in good agreement with −5.22 ± 0.05 kcal/mol and +5.51 ± 0.09 kcal/mol free energies, respectively (Table 1), obtained by starting the reactions with 100% DNA21(G•C) (forward reaction, Fig. 2B) or 100% DNA22(A•T) (reverse reaction, Fig. 2D).
Fig. S7.
Doping reactions with Vent starting with some correctly extended primer present in the reaction. See main text for more details. (A) Reaction seen with 25% of the starting material extended. Black circles, 0.5 μM dATP; red circles, 1 μM dATP; green triangles, 2 μM dATP; yellow triangles, 4 μM dATP; blue squares, 8 μM dATP. Reactions were carried out for 2 h. (B) Reaction seen with 75% of the starting material extended. Black circles, 0.5 μM dATP; red circles, 1 μM dATP; green triangles, 2 μM dATP; yellow triangles, 4 μM dATP; blue squares, 8 μM dATP. Reactions were carried out for 2 h.
Forward and Reverse Pfu Pol G•T Misincorporation and A•T Incorporation Reactions.
Forward and reverse G•T reactions.
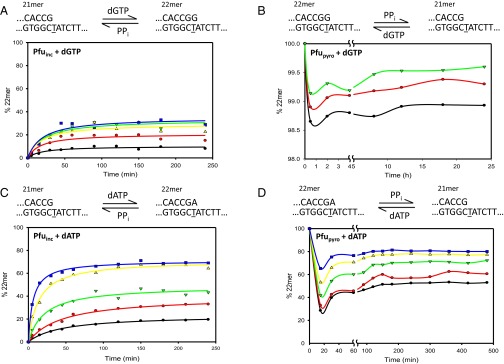
In the forward direction, the misincorporation of G opposite T by Pfu pol reached an approximate steady state in about 100 min for each of five concentrations of dGTP (200–800 μM) with 2.5 mM PPi (Fig. 3A and Fig. S8A). Pfu pol required only 2.5 mM PPi compared with 11 mM PPi for Vent pol to reach a 5–40% steady-state range for primer extension [DNA21(G•C)→DNA22(G•T)] at roughly similar dGTP concentrations (Figs. 3A and 1B, respectively). For Pfu pol, the apparent G•T misincorporation free energy (calculated from Eqs. 2a and 3) is (G•T) = −0.21 ± 0.11 kcal/mol (Table 1), which differs significantly from that of Vent pol (−1.19 ± 0.10) by about 1 kcal/mol (Table 1). Based on the difference in misincorporation free energies for the two polymerases, it seems highly unlikely that the apparent steady-state Q values for extension of DNA21(G•C) → DNA22(G•T) are close to Keq for either or both enzymes.
Fig. 3.
Incorrect and correct forward and reverse reactions with D473G Pfu pol. At the top of each plot, a sketch is shown to describe the reaction. All plots are shown as percentage of 22mer vs. time. (A) Incorrect incorporation of dGTP opposite T, at various dGTP concentrations: 200 μM (black circles), 400 μM (red circles), 600 μM (green triangles), 700 μM (yellow triangles), and 800 μM (blue squares). Reactions in the presence of 2.5 mM PPi were carried out for 4 h. (B) Pyrophosphorolysis reaction starting with the incorrectly matched [DNA22 (G•T)] at various dGTP concentrations, in the presence of 5 mM PPi: 25 μM (black circles), 50 μM (red circles), and 100 μM (green triangles). Pyrophosphorolysis is the primary reaction occurring initially, followed by incorporation until a steady state is reached. Very little DNA21 (G•C) results from this reverse reaction (note scale on y axis). (C) Correct incorporation of dATP by D473G Pfu pol at various dATP concentrations: 156 nM (black circles), 312 nM (red circles), 625 nM (green triangles), 1,250 nM (yellow triangles), and 2,500 nM (blue squares). In all cases, dGTP is present at 50 μM in the reaction to prevent pyrophosphorolysis continuing beyond the 20mer primer. Reactions were carried out for 4 h. (D) Pyrophosphorolysis reaction starting from DNA22 (A•T) at various dATP concentrations: 156 nM (black circles), 312 nM (red circles), 625 nM (green triangles), 1,250 nM (yellow triangles), and 2,500 nM (blue squares). Also, dGTP is present at 50 μM in the reaction to prevent pyrophosphorolysis continuing beyond the 20mer primer. Reactions were carried out for 8 h. Reactions with D473G Pfu pol apparently begin with a large decrease in the amount of initial 22mer, and then there is a slow increase again with incorporation taking over for pyrophosphorolysis until the reactions reach a steady state.
Fig. S8.
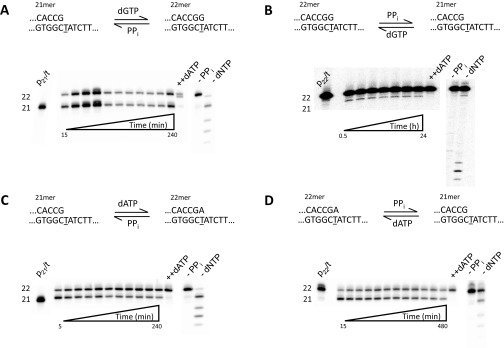
Representative gel data for each D473G Pfu pol reaction shown in Fig. 3 of the main text. For each gel, the first lane shows the starting p/t, followed by aliquots quenched at various times. The final three lanes show the enzyme is still active at the end of the reaction time by the addition of 1 mM dATP, the reaction with only dNTP(s) (−PPi), and with only PPi (−dNTP). (A) Forward incorrect reaction. (B) Reverse incorrect reaction. (C) Forward correct reaction. (D) Reverse correct reaction.
Pfu pol is able to catalyze pyrophosphorolysis at a mismatched G•T primer 3′ terminus (Fig. S8B, −dNTP), which was not detected for Vent pol (Fig. 1C). Pfu-catalyzed pyrophosphorolysis occurs in two stages: a relatively rapid decrease in p/t DNA22(G•T) during the first ∼30 min, followed by a slow “recovery” (Fig. 3B). In addition to serving as a substrate for G•T misincorporation, dGTP also prevents pyrophosphorolytic degradation of DNA21(G•C) (Olson et al.) (12). In the recovery phase, the presence of dGTP (25 μM, 50 μM, and 100 μM) drives the incorporation of G opposite C, converting any DNA20(C•G) product back to DNA21(G•C), while precluding any further p/t DNA degradation (12).
At each dGTP concentration, DNA22(G•T) ⇔ DNA21(G•C) steady states are established on a 10-h timescale. The steady-state conversions to DNA21(G•C) resulted in an apparent = +5.89 ± 0.13 kcal/mol (Table 1). The small amount of pyrophosphorolysis (0.5–1.3%, Fig. 3B) was observed only when the concentration of pyrophosphate was increased to 5 mM, as opposed to the 2.5 mM used in the forward reaction. The huge difference in the magnitudes of apparent (−0.21 kcal/mol) and apparent (+5.89 kcal/mol) for G•T mispair indicates that these are far from equilibrium.
Forward and reverse A•T reactions.
In the forward direction, DNA21(G•C) → DNA22(A•T), steady states are reached at about 3 h in the presence of PPi (5 mM) (Fig. 3C). The apparent free energy for incorporation of A opposite T is = −5.41 ± 0.15 kcal/mol (Table 1). In the reverse direction, steady states are also reached at about 3 h in the presence of PPi (5 mM) (Fig. 3D). As observed with G•T, the reverse reaction with an A•T end occurs in two stages: a rapid loss of DNA22(A•T), ∼20 min, followed by a slower recovery phase, ∼3 h, to establish DNA22(A•T) ⇔ DNA21(G•C) steady states (Fig. 3D). The apparent free energy for the correct reverse reaction is = +6.03 ± 0.32 kcal/mol (Table 1), a discrepancy between the forward and reverse reactions of about 0.6 kcal/mol. Although the discrepancy for Pfu pol is about twofold larger than for Vent pol, the prediction that is quite close to being satisfied for correct incorporation. These roughly similar values for Vent and Pfu pols further suggest that an approximate pol-independent equilibrium has been reached for correct (A•T) incorporation attributable to pyrophosphorolysis at the matched p/t DNA terminus.
Fidelity of Vent and Pfu Polymerases Comparing G•T Misincorporation with A•T Incorporation.
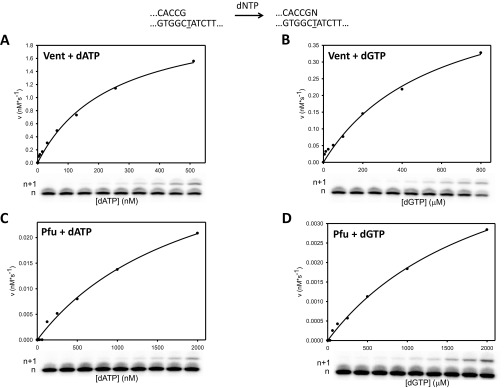
A standard gel kinetic assay was used to determine the apparent second-order Michaelis–Menten rate constants (Vmax/Km) by measuring misincorporation of G opposite T and incorporation of A opposite T as a function of dGTP and dATP concentrations, in separate reactions for each substrate (19, 20). The velocity of the reaction was plotted against the corresponding concentration of dNTP and fitted to the rectangular hyperbola to obtain the Vmax and Km parameters (Fig. S9 and Table S2) and fidelity, F, calculated by .
Fig. S9.
Fidelity measurements for Vent pol and D473G Pfu pol. The sketch at the top describes the reaction. (A) Correct incorporation of dATP by Vent pol. Concentrations of dATP from 2 nM to 512 nM were individually incubated with Vent pol and p/t and quenched at 15 s. The velocity of the reaction was calculated as the concentration of extended primer per second and plotted opposite the corresponding concentration of dATP. These data were fitted to the rectangular hyperbola v = Vmax[dATP]/(Km + [dATP]). (B) Misincorporation of dGTP by Vent pol. Concentrations of dGTP from 6 μM to 1,600 μM were individually incubated with Vent pol and p/t and quenched at 45 s. The velocity of the reaction was calculated as the concentration of extended primer per second and plotted opposite the corresponding concentration of dGTP. These data were fitted to the rectangular hyperbola v = Vmax[dGTP]/(Km + [dGTP]). (C) Correct incorporation of dATP by D473G Pfu pol. Concentrations of dATP from 8 nM to 2,000 nM were individually incubated with D473G Pfu pol and p/t and quenched at 45 s. The velocity of the reaction was calculated as the concentration of extended primer per second and plotted opposite the corresponding concentration of dATP. These data were fitted to the rectangular hyperbola v = Vmax[dATP]/(Km + [dATP]). (D) Misincorporation of dGTP by D473G Pfu pol. Concentrations of dGTP from 8 μM to 2,000 μM were individually incubated with D473G Pfu pol and p/t and quenched at 10 min. The velocity of the reaction was calculated as the concentration of extended primer per second and plotted opposite the corresponding concentration of dGTP. These data were fitted to the rectangular hyperbola v = Vmax[dGTP]/(Km + [dGTP]).
Table S2.
Kinetic parameters from fidelity measurements
| Reaction | kcat, s−1 | Km, μM |
| Vent + dATP | 9.1 | 0.25 |
| Vent + dGTP | 2.2 | 570 |
| Pfu + dATP | 0.17 | 2.0 |
| Pfu + dGTP | 0.023 | 2,100 |
The fidelity for Vent pol, FVent = 9,600 (Fig. S9 A and B), 1 G•T misincorporation per 10,000 nt polymerized, corresponds to a free energy difference = −5.65 kcal/mol. Pfu pol exhibits slightly lower fidelity, FPfu = 7,500 (Fig. S9 C and D), 1.3 misincorporations per 10,000 nt, ΔΔG° = −5.51 kcal/mol. How do these pol fidelity free energy differences compare with the values determined in the forward incorporation reactions (Table 1)? For Vent pol, apparent ΔΔG° (G•T vs. A•T) = +4.03 kcal/mol (Table 1), which differs from the “kinetic” fidelity data by about 1.6 kcal/mol. For Pfu pol apparent ΔΔG° (G•T vs. A•T) = +5.2 kcal/mol (Table 1), which differs from the fidelity data by a much smaller 0.3 kcal/mol.
Discussion
A fundamental challenge is to identify sources of free energy that can account for the >1,000-fold discrimination favoring synthesis of Watson–Crick base pairs over base mispairs. Although base pairs are inherently more stable than mispairs at p/t DNA termini, the differences in stability appear very small for DNA in aqueous solution. Values of ΔΔG° <0.5 kcal/mol, indicating <3-fold discrimination, are obtained from thermal melting studies of duplex DNA oligonucleotides having matched or mismatched base pairs at blunt-end termini (6). Larger ΔΔG° values between matched and mismatched base pairs are found with p/t DNAs containing 4-nt single-stranded template overhangs (Table S1). The largest of these, ΔΔG° = 1.8 ± 0.4 kcal/mol, obtained for G•C vs. A•C (Table S1), can account for ∼50-fold discrimination, still far from sufficient to account for pol incorporation fidelities. Therefore, whether located at blunt-end (6) or recessed dsDNA termini (Table S1), the magnitudes of ΔG° = ΔH0 – TΔS0 for R or W base pairs are small. Although the enthalpic (ΔH0) and entropic (TΔS0) terms are both large, they are similar enough in magnitude, so that the difference between them results in small ΔG° for R and W individually and for ΔΔG° comparing R with W (6, 7). The models proposed to account for pol fidelity suggested ways to amplify free energy differences at transition states rather than ground states, by imposing pol active-site constraints on interactions between bound dNTP substrate and template bases that suppress ΔΔS0‡ (8) while maintaining or amplifying ΔΔH0‡ (9) via steric exclusion mechanisms (7–9, 21, 22).
Olson et al. (12), have made the contrary argument that such amplification is superfluous if polymerase values measured from equilibrium constants for nucleotide incorporation vs. pyrophosphorolysis are significantly larger than those obtained from DNA thermal melting studies. By using high [PPi]/[dNTP] levels to cause a leveling off in the R and W nucleotide incorporation profiles for Vent pol, an average = +5.2 ± 1.34 kcal/mol was found, apparently sufficient for >1,000-fold discrimination (12). It was tacitly assumed that pyrophosphorolysis was responsible for balancing the forward and reverse reaction rates so that observed steady-state levels represented equilibrium for W incorporation, e.g., G opposite T (G•T), as well as for R incorporation (A•T). If so, then incorporation and pyrophosphorolysis reactions of DNA polymerase should reach the same [DNAn+1]/[DNAn] level. That same level should occur when starting with DNAn and incorporating G opposite T to form DNAn+1 or starting with DNAn+1 and phosphorolytically removing G opposite T in DNAn+1 to form DNAn under identical reaction conditions.
Thus, to determine whether calculated from Q (Eq. 2a) is the same as that predicted from Q′ (Eq. 2b), we performed G•T incorporation and pyrophosphorolysis reactions, using Vent pol to extend a 21-mer substrate to a 22-mer product (Fig. 1). Although the rate of extension diminishes with time, a steady state has not been attained after 48 h, at any of the five dGTP concentrations (Fig. 1B). Taking the extension levels determined at 48 h to obtain Q for comparison with Olson et al. (12), we find apparent (G•T) = −1.19 kcal/mol (Table 1), which differs substantially from the published Vent result, (G•T) = −0.32 kcal/mol. An empirical asymptotic extrapolation of the misincorporation data results in an apparent (G•T) = −1.27, which is fourfold greater in magnitude than the earlier estimate.
Definitively, however, when starting with product DNA22 ending in G•T (at the primer 3′ terminus) and using the same [PPi]/[dGTP], we were not able to detect pyrophosphorolysis (producing DNA21) in reactions carried out to 2 d at 37 °C or 72 °C (Fig. 1C), in the presence or absence of dGTP, so in fact Keq′ cannot be measured. Because pyrophosphorolysis at G•T was not observed even at millimolar PPi concentrations, the reduction in misincorporation with reaction time is likely caused by some PPi inhibitory effects on pol activity, such as inhibition of dGTP binding opposite template T in DNA21 bound to polymerase.
One possible explanation for the lack of reaction in the reverse direction when faced with a mismatch at the 3′ primer terminus (Fig. 1C) is that the pol is simply unable to bind to the substrate. However, the complete extension of the G•T mismatch (Fig. S4) eliminates that explanation. Although we cannot rule out the possibility that Vent pol can perform incorrect pyrophosphorolysis under synthesis conditions, we can say that the activation energy must be very high. Thus, the reverse reaction, if it occurs at all when the pol is faced with an existing mismatch as opposed to having just performed the misincorporation, must be on a timescale that is longer than the residence time of the pol on the mismatched DNA.
In contrast to the absence of an equilibrium for the mismatched base pair, the corresponding incorporation and pyrophosphorolysis reactions for a correctly matched base pair appear to reach an approximate equilibrium (Fig. 2). The A•T incorporation leveled off within 1–2 h (Fig. 2B), yielding a (A•T) = −5.22 kcal/mol (Table 1) in agreement with that reported previously, (A•T) = −5.12 kcal/mol (12). The pyrophosphorolysis reaction, initiated from an A•T base pair at DNA22, also leveled off within a similar 1- to 2-h time frame (Fig. 2D), indicating an apparent = +5.51 kcal/mol and corresponding to a predicted apparent = = −5.51 kcal/mol (Table 1). The small difference between the observed −5.22 kcal/mol and predicted −5.51 kcal/mol suggests that equilibrium between polymerization and pyrophosphorolysis has been approximately reached for A•T reactions. However, because pyrophosphorolysis was not detected in the G•T reactions, the resultant (A•T vs. G•T) = +4.03 kcal/mol (Table 1) and the average = +5.2 ± 1.34 kcal/mol obtained for a variety of base pairs and mispairs reported previously (12) are clearly not measures of standard free energy differences for R and W incorporation intrinsic to DNA itself.
Pfu polymerase also readily incorporates A opposite T, reaching a steady-state level within 2.5–3 h (Fig. 3C), yielding apparent (A•T) = −5.41 kcal/mol (Table 1). We also find that Pfu pol catalyzes pyrophosphorolysis at A•T primer termini, reaching an approximate steady state in about 3 h (Fig. 3D), yielding apparent (A•T) = +6.03 kcal/mol = (A•T) (Table 1). The difference of 0.62 kcal/mol between observed and predicted (Table 1) is about twofold greater than that observed for Vent pol. However, unlike Vent pol, Pfu pol does show some weak pyrophosphorolysis at mismatched G•T primer termini (Fig. 3B), giving an apparent (G•T) = +5.89 kcal/mol. Notably, however, the resultant prediction of = = −5.89 kcal/mol is very different from the apparent = −0.21 kcal/mol observed for G•T incorporation by Pfu pol (Table 1). Such a huge discrepancy, 5.68 kcal/mol, between observed apparent and predicted for G•T (Table 1) clearly shows that observed steady-state incorporation of G opposite T is far from the equilibrium condition () expected for polymerization balanced by pyrophosphorolysis.
Clearly, pyrophosphorolysis of mismatched nucleotides is highly inefficient with these enzymes, likely reflecting a high energy barrier for this reaction. Our data show that even with forcing conditions and long times, it is not practically possible to drive the mismatched terminal pairs to a true equilibrium state via pyrophosphorolysis with these two enzymes. Here we note that the use of thermostable pols is essential because the retention of full enzyme activity for multiple-day incubations is required.
Therefore, obtained from such apparent “equilibrium constant” measurements does not reveal the intrinsic selectivity of DNA itself, because equilibrium cannot be achieved. In the absence of evidence that polymerases can operate at true equilibrium and thus derive selectivity only from the DNA itself, we must conclude that the chief driver of replication fidelity is kinetic selectivity. Indeed, our melting data confirm that the inherent DNA pairing selectivity at the primer terminus is far from sufficient to account for observed levels of fidelity, and our polymerase experiments reveal that it is exceedingly difficult (if not impossible) to find conditions under which true equilibration can be reached for mismatched pairs. We conclude that DNA polymerases must operate under kinetic control to achieve the high fidelity that defines successful replication. It remains to be determined, however, whether DNA base pairing thermodynamics play an important role in the high error rates of less accurate polymerases.
Methods
Thermal Denaturation and Free Energy Calculation.
All oligonucleotides were ordered with GlenPak purification from the Stanford Peptide and Nucleic Acid Facility. Stock solutions (100 μM) of the duplexes were prepared and annealed by cooling slowly from 90 °C to 4 °C in 1× melting buffer (50 mM Na•Pipes, pH 7.5, 8 mM MgCl2) (23). Solutions (0.5 μM, 1 μM, 1.5 μM, 2 μM, and 2.5 μM) in 1× melting buffer were prepared from the stock solutions in stoppered 1-cm path length quartz cuvettes. Melting curves were measured using a Varian Cary 100 UV-vis spectrophotometer, with absorbance monitored at 260 nm while the temperature was raised from 10 °C to 80 °C at a rate of 0.5 °C/min. All melts were performed in triplicate. The data were fitted using MeltWin 3.0 to determine the melting temperature (Tm). Two methods were used to calculate free energy values for each duplex (1). Free energy values were provided directly from the MeltWin program fits, using the two-state approximation for melting. SDs were calculated from the 15 measured values for each duplex (2). Thermodynamic values were calculated according to the van’t Hoff method, using linear fits for plots of 1/Tm vs. ln(CT), where Tm is a function of concentration. Error is reported as the SD from three individual fits.
Oligonucleotides, Enzymes, and Buffers for Pol Reactions.
Oligonucleotides were purchased from Integrated DNA Technologies and purified by polyacrylamide gel electrophoresis followed by desalting. Complete DNA sequences are listed in Oligonucleotide Sequences. Shortened sequences used for each reaction are shown in Figs. 1–3. Primers were 5′ end-labeled using T4 polynucleotide kinase (USB) and [γ-32P]-ATP (MP Biomedicals), using the supplied buffer and protocol. A total of 1.2 Meq of unlabeled template was mixed with 1 Meq of radiolabeled primer in 1× kinase buffer, heated to 95 °C, and slowly cooled to room temperature to anneal the DNA. VentR exo− polymerase was obtained from NEB and used with the supplied buffer, supplemented with MgCl2 to a final concentration of 15 mM. D473G Pfu exo− pol was purified as previously described (24) and used with a reaction buffer consisting of 20 mM Tris⋅Cl, pH 8.0, 10 mM KCl, 10 mM (NH4)2SO4, 0.1% Triton X-100, and 10 mM MgSO4.
Forward and Reverse Pol Reactions.
All forward and reverse pol reactions contained 100 nM p/t DNA, 5 nM pol, and 1× reaction buffer. The low [pol]/[DNA] ratio was used to ensure that the enzyme acts only as a catalyst. For Vent reactions, 15 mM PPi was used for correct reactions and 11 mM PPi for incorrect reactions. For D473G Pfu reactions, 5 mM PPi was used for correct reactions, 2.5 mM PPi for incorrect forward reactions, or 5 mM PPi for incorrect reverse reactions when present. The amount of dNTP present in each reaction is shown in Figs. 1–3. For correct reactions, 50 μM dGTP was included as a protection against continued pyrophosphorolysis. A 2× solution of DNA and pol was incubated in 1× reaction buffer at 37 °C for 2 min and initiated by adding an equal volume of 2× solution of dNTPs and/or PPi in 1× reaction buffer, also preincubated at 37 °C. Reactions were incubated at 37 °C and aliquots were quenched with 0.5 M EDTA at various times. Following the final time point, a large amount of dATP was added to each reaction and an aliquot quenched after 20 min to ensure the pol was still active. Reaction products were separated on 20% polyacrylamide gels (39 cm × 33 cm × 0.4 mm), dried, exposed to a phosphor screen, and analyzed with a phosphorimager (GE Healthcare Storm 860).
Calculation of Equilibrium Constants and Apparent Free Energies.
Following phosphorimaging, the relative amounts of DNAn to DNAn+1 were determined quantitatively, using ImageQuant TL 8.1 (GE Healthcare). Equilibrium constants were calculated from these concentrations, as well as the corresponding concentrations of PPi and dNTP, using Eq. 2a (Q for forward polymerization reactions) or Eq. 2b (Q′ for reverse pyrophosphorolysis reactions). The mean of the resulting Q or Q′ values was obtained for the time points at which the DNAn and DNAn+1 concentrations remained unchanged (approximately five time points for each concentration for most reactions). These Q and Q′ values were used to calculate and (Eq. 3) for each time point and each concentration of dNTP. The mean and SD were calculated from the or values from two independent reactions and reported as the mean ± SD in Table 1.
Fidelity Reactions.
A 2× solution of DNA (20 nM) and pol (0.5 nM) in 1× buffer was incubated at 37 °C for 2 min. Separately, a 2× solution of dNTP in 1× buffer was incubated at 37 °C for 2 min. To initiate the reaction, equal volumes of the two mixtures were combined, incubated at 37 °C, and quenched at the end of the reaction time. For Vent pol, dATP was present at 2–512 nM and reactions were quenched at 15 s, and dGTP was present at 6–1,600 μM and reactions were quenched at 45 s. For D473G Pfu pol, dATP was present at 8–2,000 nM and reactions were quenched at 45 s, and dGTP was present at 8–2,000 μM and reactions were quenched at 10 min. Reaction products were separated on 20% polyacrylamide gels (39 cm × 33 cm × 0.4 mm), dried, exposed to a phosphor screen, and analyzed with a phosphorimager (GE Healthcare Storm 860).
Oligonucleotide Sequences
The following sequences were used in the polymerase reactions: 21mer unextended primer 5′-CGATGGTACTCCATATCACCG and 45mer template 5′-TCTAGACGAATTCTACTATTCTATCGGTGATATGGAGTACCATCG. For reactions beginning with extended primers, the above primer sequence is terminated by either A [DNA22 (A•T)] or G [DNA22 (G•T)].
Substrate Titrations
Before beginning the equilibrium experiments, it was important to find concentrations of each substrate that would not inhibit the reaction. First, beginning with the correctly matched DNA22 (A•T), a titration was done with PPi in the presence of the dNTP at the n − 1 position, ensuring that any pyrophosphorolysis that occurred would proceed no further than the DNA21 (G•C). Concentrations higher than 15 mM PPi were observed to inhibit the pyrophosphorolysis reaction for Vent pol on the correctly matched extended p/t (Fig. S3A).
Similar experiments were carried out for both correct and mismatched p/t and for both Vent and D473G Pfu pols. Similarly, a magnesium ion titration was carried out for each experiment, starting with the unextended DNA21 (G•C) with both pols (Fig. S3B). In the case of Vent pol, Mg2+ concentrations higher than 25 mM were found to inhibit the reaction.
Acknowledgments
We thank Dr. Chi H. Mak for insightful discussions. This work was supported by NIH Grants GM21422, ES012259, and U19CA177547 (to M.F.G.) and NIH Grants GM068122 and GM110050 (to E.T.K.).
Footnotes
The authors declare no conflict of interest.
This article is a PNAS Direct Submission.
This article contains supporting information online at www.pnas.org/lookup/suppl/doi:10.1073/pnas.1600279113/-/DCSupplemental.
References
- 1.Echols H, Goodman MF. Fidelity mechanisms in DNA replication. Annu Rev Biochem. 1991;60:477–511. doi: 10.1146/annurev.bi.60.070191.002401. [DOI] [PubMed] [Google Scholar]
- 2.Freudenthal BD, Beard WA, Shock DD, Wilson SH. Observing a DNA polymerase choose right from wrong. Cell. 2013;154(1):157–168. doi: 10.1016/j.cell.2013.05.048. [DOI] [PMC free article] [PubMed] [Google Scholar]
- 3.Johnson KA. Conformational coupling in DNA polymerase fidelity. Annu Rev Biochem. 1993;62:685–713. doi: 10.1146/annurev.bi.62.070193.003345. [DOI] [PubMed] [Google Scholar]
- 4.Joyce CM, Benkovic SJ. DNA polymerase fidelity: Kinetics, structure, and checkpoints. Biochemistry. 2004;43(45):14317–14324. doi: 10.1021/bi048422z. [DOI] [PubMed] [Google Scholar]
- 5.SantaLucia J, Jr, Hicks D. The thermodynamics of DNA structural motifs. Annu Rev Biophys Biomol Struct. 2004;33:415–440. doi: 10.1146/annurev.biophys.32.110601.141800. [DOI] [PubMed] [Google Scholar]
- 6.Petruska J, et al. Comparison between DNA melting thermodynamics and DNA polymerase fidelity. Proc Natl Acad Sci USA. 1988;85(17):6252–6256. doi: 10.1073/pnas.85.17.6252. [DOI] [PMC free article] [PubMed] [Google Scholar]
- 7.Goodman MF. Hydrogen bonding revisited: Geometric selection as a principal determinant of DNA replication fidelity. Proc Natl Acad Sci USA. 1997;94(20):10493–10495. doi: 10.1073/pnas.94.20.10493. [DOI] [PMC free article] [PubMed] [Google Scholar]
- 8.Petruska J, Goodman MF. Enthalpy-entropy compensation in DNA melting thermodynamics. J Biol Chem. 1995;270(2):746–750. doi: 10.1074/jbc.270.2.746. [DOI] [PubMed] [Google Scholar]
- 9.Petruska J, Sowers LC, Goodman MF. Comparison of nucleotide interactions in water, proteins, and vacuum: Model for DNA polymerase fidelity. Proc Natl Acad Sci USA. 1986;83(6):1559–1562. doi: 10.1073/pnas.83.6.1559. [DOI] [PMC free article] [PubMed] [Google Scholar]
- 10.Kelman Z, O’Donnell M. DNA polymerase III holoenzyme: Structure and function of a chromosomal replicating machine. Annu Rev Biochem. 1995;64:171–200. doi: 10.1146/annurev.bi.64.070195.001131. [DOI] [PubMed] [Google Scholar]
- 11.Kornberg A, Baker TA. DNA Replication. Freeman; New York: 1992. [Google Scholar]
- 12.Olson AC, Patro JN, Urban M, Kuchta RD. The energetic difference between synthesis of correct and incorrect base pairs accounts for highly accurate DNA replication. J Am Chem Soc. 2013;135(4):1205–1208. doi: 10.1021/ja309866m. [DOI] [PMC free article] [PubMed] [Google Scholar]
- 13.Brautigam CA, Steitz TA. Structural and functional insights provided by crystal structures of DNA polymerases and their substrate complexes. Curr Opin Struct Biol. 1998;8(1):54–63. doi: 10.1016/s0959-440x(98)80010-9. [DOI] [PubMed] [Google Scholar]
- 14.Patel PH, Suzuki M, Adman E, Shinkai A, Loeb LA. Prokaryotic DNA polymerase I: Evolution, structure, and “base flipping” mechanism for nucleotide selection. J Mol Biol. 2001;308(5):823–837. doi: 10.1006/jmbi.2001.4619. [DOI] [PubMed] [Google Scholar]
- 15.Wu S, Beard WA, Pedersen LG, Wilson SH. Structural comparison of DNA polymerase architecture suggests a nucleotide gateway to the polymerase active site. Chem Rev. 2014;114(5):2759–2774. doi: 10.1021/cr3005179. [DOI] [PMC free article] [PubMed] [Google Scholar]
- 16.Bommarito S, Peyret N, SantaLucia J., Jr Thermodynamic parameters for DNA sequences with dangling ends. Nucleic Acids Res. 2000;28(9):1929–1934. doi: 10.1093/nar/28.9.1929. [DOI] [PMC free article] [PubMed] [Google Scholar]
- 17.Zuker M. Mfold web server for nucleic acid folding and hybridization prediction. Nucleic Acids Res. 2003;31(13):3406–3415. doi: 10.1093/nar/gkg595. [DOI] [PMC free article] [PubMed] [Google Scholar]
- 18.Zumdahl SS, Zumdahl SA. Chemistry. Houghton Mifflin; Boston: 2007. [Google Scholar]
- 19.Bertram JG, Oertell K, Petruska J, Goodman MF. DNA polymerase fidelity: Comparing direct competition of right and wrong dNTP substrates with steady state and pre-steady state kinetics. Biochemistry. 2010;49(1):20–28. doi: 10.1021/bi901653g. [DOI] [PMC free article] [PubMed] [Google Scholar]
- 20.Boosalis MS, Petruska J, Goodman MF. DNA polymerase insertion fidelity. Gel assay for site-specific kinetics. J Biol Chem. 1987;262(30):14689–14696. [PubMed] [Google Scholar]
- 21.Kool ET. Replication of non-hydrogen bonded bases by DNA polymerases: A mechanism for steric matching. Biopolymers. 1998;48(1):3–17. doi: 10.1002/(SICI)1097-0282(1998)48:1<3::AID-BIP2>3.0.CO;2-7. [DOI] [PubMed] [Google Scholar]
- 22.Kool ET, Morales JC, Guckian KM. Mimicking the structure and function of DNA: Insights into DNA stability and replication. Angew Chem Int Ed Engl. 2000;39(6):990–1009. doi: 10.1002/(sici)1521-3773(20000317)39:6<990::aid-anie990>3.0.co;2-0. [DOI] [PubMed] [Google Scholar]
- 23.Owczarzy R, Moreira BG, You Y, Behlke MA, Walder JA. Predicting stability of DNA duplexes in solutions containing magnesium and monovalent cations. Biochemistry. 2008;47(19):5336–5353. doi: 10.1021/bi702363u. [DOI] [PubMed] [Google Scholar]
- 24.Biles BD, Connolly BA. Low-fidelity Pyrococcus furiosus DNA polymerase mutants useful in error-prone PCR. Nucleic Acids Res. 2004;32(22):e176. doi: 10.1093/nar/gnh174. [DOI] [PMC free article] [PubMed] [Google Scholar]


