

Abstract
Background
The mitochondrion is the primary target of oxidative stress in response to exogenous environments. Mitochondrial DNA (mtDNA) is independent from nuclear DNA and uses separate epigenetic machinery to regulate mtDNA methylation. The mtDNA damage induced by oxidative stress can cause mitochondrial dysfunction and is implicated in human diseases; however, mtDNA methylation has been largely overlooked in environmental studies relating to human disease. The purpose of this study was to examine the association between exposure to fine metal‐rich particulates (particulate matter <2.5 µm in diameter [PM 2.5]) from welding in a boilermaker union and blood mtDNA methylation in relation to heart rate variability.
Methods and Results
Forty‐eight healthy men were recruited on multiple sampling cycles at the Boilermaker Union Local 29, located in Quincy, Massachusetts. We measured personal PM 2.5 in the background ambient environment. We measured blood mtDNA methylation in the mtDNA promoter (D‐loop) and genes essential for ATP synthesis (MT‐TF and MT‐RNR1) by bisulfite pyrosequencing. All analyses were adjusted for demographics, type of job, season, welding‐work day, and mtDNA methylation experimental batch effect. The participants’ PM 2.5 exposure was significantly higher after a welding‐work day (mean 0.38 mg/m3) than the background personal level (mean 0.15 mg/m3, P<0.001). Blood mtDNA methylation in the D‐loop promoter was associated with PM 2.5 levels (β=−0.99%, SE=0.41, P=0.02). MT‐TF and MT‐RNR1 methylation was not associated with PM 2.5 exposure (β=0.10%, SE=0.45, P=0.82). Interaction of PM 2.5 exposure levels and D‐loop promoter methylation was significantly associated with markers of heart rate variability.
Conclusions
Blood mtDNA methylation levels were negatively associated with PM 2.5 exposure and modified the adverse relationships between PM 2.5 exposure and heart rate variability outcomes.
Keywords: air pollution, epigenetics, heart rate variability, mitochondria, particulate matter
Subject Categories: Epigenetics
Introduction
Exposure to particulate matter (PM) air pollution is a risk factor for cardiovascular disease (CVD) that contributes to morbidity, mortality, and reduced life expectancy.1 PM can penetrate into the blood stream directly or can cause an immune response in the lung and, in turn, increase the risk of CVD development. Heart rate variability (HRV), which is the measurement of variation in the time interval between heartbeats, has been investigated extensively as a prognostic marker of various forms of CVD. Changes in HRV as a reflection of cardiac autonomic function have been suggested as pathophysiological mechanisms or pathways linking CVD mortality and air pollution exposure.2
Epigenetic mechanisms have been promising in elucidating the link between risk factors and disease. Many studies have examined the association between air pollution and DNA methylation markers, which are most commonly focused on blood. LINE‐1 global DNA methylation, which is associated with genomic instability and human diseases including cancers, has been shown to be disrupted in blood by air pollution.3 DNA methylation of nuclear‐encoded genes have been shown to be affected by air pollution, including Toll‐like receptor 2, inducible nitric oxide synthase, and interferon‐γ.4 Airborne pollutants can also affect mitochondrial DNA (mtDNA) methylation levels in blood with exposure to PM <1 μm in diameter5 and in placental mitochondria with exposure to PM <2.5 μm in diameter (PM2.5).6 Nevertheless, no studies have considered the effects of air pollution on mtDNA methylation in relation to CVD risk.
Mitochondria contain a unique genome that encodes 37 genes that are mostly related to the electron transport chain. Normal mitochondrial function generates reactive oxygen species, and because of its proximal location, mtDNA is particularly vulnerable to oxidative damage. Effects of air pollution on mtDNA damage, including copy number variation,7 8‐hydroxy‐2′‐deoxyguanosine formation,8 and heteroplasmy,9 have been reported in human and animal studies. Recently, DNA methylation machinery was found in mitochondria,10 and mtDNA methylation levels have been shown to be associated with mitochondrial gene expression,11 which suggests possible roles for mtDNA methylation in controlling mitochondrial functions and biogenesis. Indeed, mtDNA methylation levels in platelets show a significant difference between CVD patients and healthy persons.12
In this study, we examined workers in a boilermaker unit who were exposed to PM2.5 in their background ambient environment and determined whether PM2.5 exposure levels were associated with blood mtDNA methylation at 2 regions of the mitochondrial genome: the D‐loop promoter and the MT‐TF and MT‐RNR1 genes. MT‐TF and MT‐RNR1 encode tRNA and 12S ribosomal RNA, respectively, which are important for mitochondrial protein synthesis. Previous studies showed that acute PM exposures are linked to HRVs, a marker of CVD.3 Consequently, we also examined whether mtDNA methylation can be involved in the relationship between PM2.5 exposure and the risk of CVD markers. We found that mtDNA methylation levels are associated with acute welding PM2.5 exposure and modify the adverse relationships between PM2.5 exposure and HRV outcomes, showing that persons with higher levels of mtDNA methylation are more susceptible to the effect of PM2.5 exposure on HRV measures.
Methods
Study Participants
We recruited 48 healthy male workers who were free of cardiovascular heart disease from the Boilermaker Union Local 29, located in Quincy, Massachusetts,13 over 6 sampling cycles from January 2007 to June 2012. Personal exposure to air particles was measured in a temperature‐controlled room in which no welding work was done, as a background environment, and at 10 workstations in a separate area in which a welding procedure was done for an average of 5 hours per day, as a welding environment. Peripheral blood was drawn before and after welding work (Figure 1). Data regarding work shift length, workstation, cigarette smoking, and alcohol consumption were collected from a work log. We excluded the only participant reporting alcohol intake. Information on medical history and medication use, demographics, and lifestyle including smoking status and occupational history was collected from a self‐administered questionnaire (Table 1). The institutional review board at the Harvard T.H. Chan School of Public Health approved the study protocol, and informed written consent was obtained from each adult prior to participation.
Figure 1.
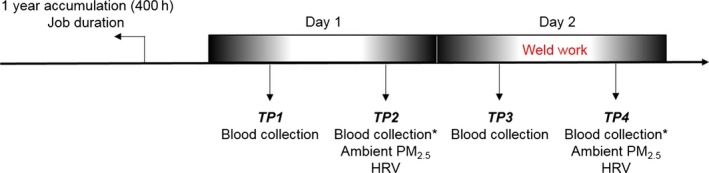
Peripheral blood was collected in the morning and the afternoon (before and after work) for 2 consecutive days. Ambient PM 2.5 level was measured each day in the afternoon. Boilermakers had welding work on day 2 but not on day 1. mtDNA methylation was measured in blood samples collected in the afternoon (* marked). HRV indicates heart rate variability; mtDNA, mitochondrial DNA; PM2.5, particulate matter <2.5 µm in diameter; TP, time point.
Table 1.
Cohort Description
| Characteristics | D‐Loop | MT‐TF and MT‐RNR1 | Particulate matter <2.5 µm in diameter, mg/m3 | ||
|---|---|---|---|---|---|
| n (%) | Mean (SD) | n (%) | Mean (SD) | Mean (SD) | |
| All participants | 45 | 2.3 (0.8) | 47 | 7.2 (1) | 0.2 (0.3) |
| Age, y | |||||
| ≤30 | 10 (22.2) | 2.7 (1) | 10 (21.3) | 7.3 (1.1) | 0.3 (0.5) |
| 30–40 | 10 (22.2) | 2.3 (0.9) | 10 (21.3) | 7.4 (1.2) | 0.1 (0.2) |
| 40–50 | 9 (20) | 2 (0.5) | 10 (21.3) | 7.2 (0.54) | 0.4 (0.3) |
| 50–60 | 11 (24.4) | 2.4 (1) | 12 (25.5) | 6.9 (1) | 0.2 (0.2) |
| >60 | 5 (11.1) | 2 (0.2) | 5 (10.6) | 7.5 (1.6) | 0.06 (0.1) |
| Body mass index, kg/m2 | |||||
| <25 | 11 (24.4) | 2.3 (0.8) | 12 (25.5) | 7.4 (0.9) | 0.2 (0.3) |
| ≥25 | 34 (75.6) | 2.3 (0.8) | 35 (74.5) | 7.2 (1.1) | 0.2 (0.3) |
| Smoking | |||||
| No | 30 (66.7) | 2.2 (0.8) | 31 (66) | 7.1 (1.1) | 0.2 (0.2) |
| Yes | 15 (33.3) | 2.4 (0.9) | 16 (34) | 7.4 (0.8) | 0.3 (0.4) |
| Race | |||||
| White | 38 (84.4) | 2.2 (0.8) | 40 (85.1) | 7.2 (1.1) | 0.2 (0.3) |
| Nonwhite | 7 (15.6) | 2.8 (1) | 7 (14.9) | 7.4 (0.7) | 0.2 (0.3) |
| Boilermaker/welder | |||||
| Yes | 33 (73.3) | 2.3 (0.8) | 35 (74.5) | 7.1 (0.9) | 0.2 (0.3) |
| No | 12 (26.7) | 2.3 (0.9) | 12 (25.5) | 7.5 (1.4) | 0.2 (0.2) |
| Caffeine intake | |||||
| No | 28 (62.2) | 2.3 (0.9) | 29 (61.7) | 7.2 (1) | 0.2 (0.2) |
| Yes | 17 (37.8) | 2.3 (0.8) | 18 (38.3) | 7.4 (1.1) | 0.3 (0.4) |
Particle Exposure Assessment
A DustTrak™ Aerosol Monitor (TSI, Inc) was used to measure ambient PM2.5. The monitor was placed in a padded pouch with the inlet tubing secured to the participant's shoulder in the nasal breathing area during the welding shift to measure PM2.5 exposure generated by welding and the absence of welding to measure the personal background environmental exposure (Figure 1). Personal particle exposure was monitored through readings every 10 seconds, and 1‐minute averages were calculated over the course of the welding shift in real time using light‐scattering technology. The manufacturer calibrated the monitor annually.
DNA Methylation Analysis
Buffy coat from all participants was processed and immediately stored at −80°C. Genomic DNA was extracted from the buffy coat using the same standardized procedures. Initially, 1 µg of genomic DNA was bisulfite‐converted using the EZ DNA Methylation Kit (Zymo Research), according to the manufacturer's protocol. Bisulfite‐converted DNA was eluted in 30 μL M‐Elution Buffer (Zymo Research) and stored at −80°C until required. Next, 1 µL of converted DNA was used for polymerase chain reaction (PCR) amplification using GoTaq Hot Start polymerase (Promega). PCR conditions and primer sequences for mitochondrial assays have been described previously.12 Pyrosequencing was performed using the PSQ Q96 MD pyrosequencing system (Qiagen), as described previously. To measure technical reproducibility, each PCR–amplified sample was sequenced twice (D‐loop: r=0.61, P<0.0001; MT‐TF and MT‐RNR1: r=0.37, P=0.0004). In addition, generated pyrograms were visually inspected as part of the quality control process.
Heart Rate Variability
Each participant was continuously measured for heart activity using a Holter monitor ambulatory ECG (SEER Light compact digital Holter recorder; GE Healthcare), with a standard 3 channels and 7 lead electrodes. Research staff cleaned each electrode with alcohol to improve conductivity. HRV was analyzed in both time and frequency domains in the study. Time domain analysis was calculated with different measures of the normal‐to‐normal (NN) intervals, including standard deviation of the NN intervals, square root of the mean squared difference of successive NN intervals (RMSSD), and the proportion of the number of interval differences of successive NN intervals >10 and >20 ms over the total number of NN intervals (pNN10 and pNN20, respectively). Frequency domain analysis was evaluated by how the power (variance) distributes as a function of frequency and its fluctuation. Power spectral density was analyzed over a few minutes at low frequency (0.04–0.15 Hz) and at high frequency (0.15–0.40 Hz).14 Before and after welding work, each participant was placed in a sitting position over a 5‐minute resting period for standard deviation of the NN intervals, RMSSD, pNN10, pNN20, and low and high frequencies to be calculated.
Statistical Analysis
We evaluated the association between PM exposure and mtDNA methylation and between mtDNA methylation intensities and HRV outcomes. We also examined the effect of modification by mtDNA methylation in the PM–HRV relationship by including an interaction term between mtDNA methylation levels and PM exposure. To test all associations, we performed linear mixed‐effects regression models with random intercept for each participant to account for multiple measures. Skewed HRV measures (standard deviation of the NN intervals, RMSSD, low frequency, and high frequency) were log‐transformed, and we restricted all analyses on observations with PM2.5 exposure levels. We adjusted all models for age (continuous), race (white, nonwhite), current tobacco use (yes, no), caffeine intake (yes, no), body mass index (continuous), type of job (boilermaker or welder/other type of job), season (cold, warm), welding‐work day (yes, no), and plate number of mtDNA methylation measurement for batch effect. Continuous variables were linearly associated with mtDNA methylation levels and HRV outcomes in the study population. To avoid power reduction, the sampling cycle variable was included according to the season of recruitment. Mediation analysis was performed to examine the PM2.5 effect on HRV through mtDNA methylation level.15 All statistical analyses were performed in SAS (version 9.4; SAS Institute Inc).
Results
PM Exposure on Blood mtDNA Methylation
Blood from time points (TPs) 1 and 3 were drawn in the morning, and blood from TPs 2 and 4 were drawn in the afternoon (Figure 1). TPs 1 and 2 (day 1) were from prior to welding work, which was performed on day 2. Ambient PM2.5 was measured at TPs 2 and 4. The participants’ PM2.5 exposure ranged from 0.002 to 1.56 mg/m3 and was significantly higher after welding work (TP 4, mean 0.38 mg/m3) than the background personal level (TP 2, mean 0.15 mg/m3; P<0.001). We measured mtDNA methylation at 2 CpGs within the D‐loop region and 3 CpGs within the MT‐TF and MT‐RNR1 regions at samples from TPs 2 and 4 (Figure 1). The mean level of DNA methylation within the D‐loop region was 2.36% (SE=0.91) at TP 2 and 2.22% (SE=0.80) at TP 4. Mean DNA methylation level of the D‐loop region was significantly lower in participants who were highly exposed to PM (average CpGs: β=−0.99%, SE=0.41, P=0.02). Mean levels of mtDNA methylation within the MT‐TF and MT‐RNR1 regions were not significantly associated with PM2.5 exposure (Table 2).
Table 2.
Effect of Particulate Matter Exposure on Blood Mitochondrial DNA Methylation
| Covariate | D‐Loop Observed=86,a n=45 | MT‐TF and MT‐RNR1 Observed=89,a n=47 | ||||
|---|---|---|---|---|---|---|
| β | SE | P Value | β | SE | P Value | |
| Particulate matter <2.5 µm in diameter | −0.99 | 0.41 | 0.02 | 0.10 | 0.45 | 0.82 |
| Age (continuous) | −0.001 | 0.01 | 0.94 | 0.001 | 0.01 | 0.88 |
| Body mass index (continuous) | −0.002 | 0.02 | 0.93 | 0.01 | 0.02 | 0.81 |
| Race (nonwhite) | 0.64 | 0.27 | 0.03 | 0.65 | 0.34 | 0.06 |
| Current tobacco use | 0.02 | 0.20 | 0.92 | −0.03 | 0.24 | 0.90 |
| Season (warm) | −1.27 | 0.38 | 0.00 | −0.64 | 0.46 | 0.17 |
| Type of job (not boilermaker/welder) | 0.07 | 0.25 | 0.79 | 0.29 | 0.30 | 0.34 |
| Caffeine intake | 0.40 | 0.21 | 0.06 | 0.09 | 0.24 | 0.71 |
| Welding‐work day | 0.004 | 0.18 | 0.98 | −0.03 | 0.21 | 0.87 |
Number of observed mitochondrial DNA methylation data.
mtDNA Methylation and HRV
We examined the association of blood mtDNA methylation levels within the D‐loop and MT‐TF and MT‐RNR1 regions on HRV measures (standard deviation of the NN intervals, RMSSD, pNN10, pNN20, and low and high frequencies) among workers. The mtDNA methylation from the D‐loop and MT‐TF and MT‐RNR1 regions was not directly associated with markers of HRV (Table 3).
Table 3.
Association Between Mitochondrial DNA Methylation and Heart Rate Variability
| Heart Rate Variability Measures | D‐Loop Observed=86,a n=45 | MT‐TF and MT‐RNR1 Observed=89,a n=47 | ||||
|---|---|---|---|---|---|---|
| βb | SE | P Value | βb | SE | P Value | |
| SDNNc | 0.02 | 0.05 | 0.73 | −0.008 | 0.05 | 0.86 |
| RMSSDc | −0.02 | 0.06 | 0.75 | −0.02 | 0.05 | 0.65 |
| pNN10 | 0.006 | 0.02 | 0.79 | −0.008 | 0.02 | 0.65 |
| pNN20 | −0.004 | 0.02 | 0.87 | −0.02 | 0.02 | 0.25 |
| LFc | −0.02 | 0.10 | 0.84 | −0.06 | 0.09 | 0.51 |
| HFc | −0.03 | 0.13 | 0.81 | −0.06 | 0.10 | 0.55 |
HF indicates high frequency; LF, low frequency; NN interval, normal‐to‐normal interval; pNN10, proportion of the number of interval differences of successive NN intervals >10 over the total number of NN intervals; pNN20, proportion of the number of interval differences of successive NN intervals >20 ms over the total number of NN intervals; RMSSD, square root of the mean squared difference of successive NN intervals; SDNN, standard deviation of the NN intervals.
Number of observed mitochondrial DNA methylation data.
Adjusted by age (continuous), race (white, nonwhite), current tobacco use (yes, no), caffeine intake (yes, no), body mass index (continuous), type of job (boilermaker or welder/other type of job), season (cold, warm), welding‐work day (yes, no), and plate number.
The values were log transformed for the analysis.
Interaction of mtDNA Methylation With PM2.5 on HRV
We performed interaction analysis for PM2.5 and mtDNA methylation levels as continuous variables on HRV measurements to test whether blood mtDNA methylation levels identified participants more susceptible to the effects of PM2.5 exposure level on HRV. The interactions between PM2.5 and mtDNA methylation were significantly and positively associated with the measured HRV markers: participants with higher mtDNA methylation levels were more susceptible to the effect of PM2.5 on HRV measures. In particular, significant associations were observed with standard deviation of the NN intervals (P=0.03), RMSSD (P=0.01), pNN10 (P=0.01), pNN20 (P=0.03), and low frequency (P=0.002). High frequency was marginally associated with the PM2.5–mtDNA methylation level interaction (P=0.05) (Table 4 and Figures 2 and 3). We interpreted the results using midpoints of each quartile of methylation levels for D‐loop and MT‐TF and MT‐RNR1 (Table 4). Across the HRV outcomes analysis, the effect modification within the fourth quartile of each mtDNA region was stronger and always positive. Every 1‐mg/m3 increase in PM2.5 exposure was associated with decreases of 0.52 and 0.19 ms and increases of 0.17 and 1.25 ms in RMSSD in participants with mtDNA D‐loop methylation levels within the first, second, third, and fourth quartiles, respectively (Table 4 and Figure 2). The interpretation of the coefficients of other HRV outcomes is similar. The MT‐TF and MT‐RNR1 regions, however, did not show any interaction with PM2.5 on HRV (Table 4 and Figure 3). Mediation analysis showed that the PM2.5 effect on HRV was not mediated through blood mtDNA methylation (Table 5).
Table 4.
Particular Matter Exposure Effects on Heart Rate Variability Modulated by Mitochondrial DNA Methylation
| Heart Rate Variability Measures and Methylation Levels | D‐Loop | MT‐TF and MT‐RNR1 | ||||||
|---|---|---|---|---|---|---|---|---|
| Observed=86,a n=45 | Observed=89,a n=47 | |||||||
| Values of Midpoints | βb | SE | P Value | Values of Midpoints | βb | SE | P Value | |
| SDNNc | ||||||||
| Midpoint Q1 | 1.53 | −0.27 | 0.29 | 0.38 | 6.20 | 0.30 | 0.32 | 0.37 |
| Midpoint Q2 | 1.85 | −0.04 | 0.25 | 0.88 | 6.96 | 0.21 | 0.22 | 0.35 |
| Midpoint Q3 | 2.2 | 0.21 | 0.25 | 0.40 | 7.40 | 0.16 | 0.21 | 0.45 |
| Midpoint Q4 | 3.26 | 0.96 | 0.45 | 0.04 | 8.42 | 0.05 | 0.34 | 0.88 |
| P interactiond | 0.03 | 0.63 | ||||||
| RMSSDc | ||||||||
| Midpoint Q1 | 1.53 | −0.52 | 0.31 | 0.11 | 6.20 | −0.33 | 0.34 | 0.33 |
| Midpoint Q2 | 1.85 | −0.19 | 0.26 | 0.48 | 6.96 | −0.06 | 0.23 | 0.79 |
| Midpoint Q3 | 2.2 | 0.17 | 0.26 | 0.52 | 7.40 | 0.09 | 0.22 | 0.70 |
| Midpoint Q4 | 3.26 | 1.25 | 0.47 | 0.01 | 8.42 | 0.44 | 0.35 | 0.22 |
| P interactiond | 0.01 | 0.15 | ||||||
| pNN10 | ||||||||
| Midpoint Q1 | 1.53 | −0.20 | 0.12 | 0.10 | 6.20 | −0.06 | 0.13 | 0.61 |
| Midpoint Q2 | 1.85 | −0.09 | 0.10 | 0.35 | 6.96 | −0.01 | 0.09 | 0.89 |
| Midpoint Q3 | 2.2 | 0.02 | 0.10 | 0.81 | 7.40 | 0.02 | 0.09 | 0.84 |
| Midpoint Q4 | 3.26 | 0.38 | 0.18 | 0.04 | 8.42 | 0.09 | 0.13 | 0.51 |
| P interactiond | 0.01 | 0.45 | ||||||
| pNN20 | ||||||||
| Midpoint Q1 | 1.53 | −0.22 | 0.12 | 0.10 | 6.20 | −0.13 | 0.13 | 0.32 |
| Midpoint Q2 | 1.85 | −0.12 | 0.11 | 0.27 | 6.96 | −0.04 | 0.09 | 0.63 |
| Midpoint Q3 | 2.2 | −0.01 | 0.10 | 0.90 | 7.40 | 0.005 | 0.09 | 0.96 |
| Midpoint Q4 | 3.26 | 0.31 | 0.19 | 0.12 | 8.42 | 0.12 | 0.14 | 0.39 |
| P interactiond | 0.03 | 0.23 | ||||||
| LFc | ||||||||
| Midpoint Q1 | 1.53 | −0.58 | 0.50 | 0.26 | 6.20 | 0.26 | 0.60 | 0.67 |
| Midpoint Q2 | 1.85 | 0.01 | 0.44 | 0.98 | 6.96 | 0.66 | 0.43 | 0.14 |
| Midpoint Q3 | 2.2 | 0.65 | 0.43 | 0.15 | 7.40 | 0.88 | 0.41 | 0.04 |
| Midpoint Q4 | 3.26 | 2.60 | 0.78 | 0.003 | 8.42 | 1.41 | 0.62 | 0.03 |
| P interactiond | 0.002 | 0.22 | ||||||
| HFc | ||||||||
| Midpoint Q1 | 1.53 | −0.76 | 0.72 | 0.30 | 6.20 | −0.48 | 0.75 | 0.53 |
| Midpoint Q2 | 1.85 | −0.25 | 0.61 | 0.68 | 6.96 | −0.09 | 0.53 | 0.87 |
| Midpoint Q3 | 2.2 | 0.30 | 0.60 | 0.62 | 7.40 | 0.14 | 0.51 | 0.79 |
| Midpoint Q4 | 3.26 | 1.98 | 1.09 | 0.08 | 8.42 | 0.66 | 0.77 | 0.40 |
| P interactiond | 0.05 | 0.33 | ||||||
HF indicates high frequency; LF, low frequency; NN interval, normal‐to‐normal interval; pNN10, proportion of the number of interval differences of successive NN intervals >10 over the total number of NN intervals; pNN20, proportion of the number of interval differences of successive NN intervals >20 ms over the total number of NN intervals; Q, quartile; RMSSD, square root of the mean squared difference of successive NN intervals; SDNN, standard deviation of the NN intervals.
Number of observed mitochondrial DNA methylation data.
Adjusted by age (continuous), race (white, nonwhite), current tobacco use (yes, no), caffeine intake (yes, no), body mass index (continuous), type of job (boilermaker or welder/other type of job), season (cold, warm), welding‐work day (yes, no), and plate number.
The values were log transformed for the analysis.
Used continuous mitochondrial DNA levels for the analysis.
Figure 2.

The effect of PM 2.5 exposure on HRV interaction with mtDNA D‐loop methylation levels (n=45). Midpoints of Q1, Q2, Q3, and Q4 (12.5, 37.5, 62.5, and 87.5, respectively) indicate the first, second, third, and fourth quartiles of mtDNA D‐loop methylation levels. The association of PM 2.5 with RMSSD, SDNN, pNN10, and LF is modified by mtDNA D‐loop methylation levels, as indicated by the different slopes. The 4 lines in each figure represent the relationship between PM 2.5 and HRV when the mtDNA D‐loop methylation level is at the midpoint of each quartile. If there were no effect modification, the 4 lines would be the same. The intercepts were set at the same levels due to absence of association between mtDNA D‐loop and HRV (Table 3). Results were adjusted for age (continuous), race (white, nonwhite), current tobacco use (yes, no), caffeine intake (yes, no), body mass index (continuous), type of job (boilermaker or welder/other type of job), season (cold, warm), welding‐work day (yes, no), and plate number. HRV, heart rate variability; logHF: loge transformed high‐frequency power (0.15–0.4 Hz); logLF, loge transformed low‐frequency power (0.04–0.15 Hz); logRMSSD, loge transformed RMSSD; logSDNN, loge transformed SDNN; mtDNA, mitochondrial DNA; NN interval, normal‐to‐normal interval; PM2.5, particulate matter <2.5 µm in diameter; pNN10, proportion of the number of interval differences of successive NN intervals >10 over the total number of NN intervals; pNN20, proportion of the number of interval differences of successive NN intervals >20 ms over the total number of NN intervals; Q, quartile; RMSSD, square root of the mean squared difference of successive NN intervals; SDNN, standard deviation of the NN intervals.
Figure 3.
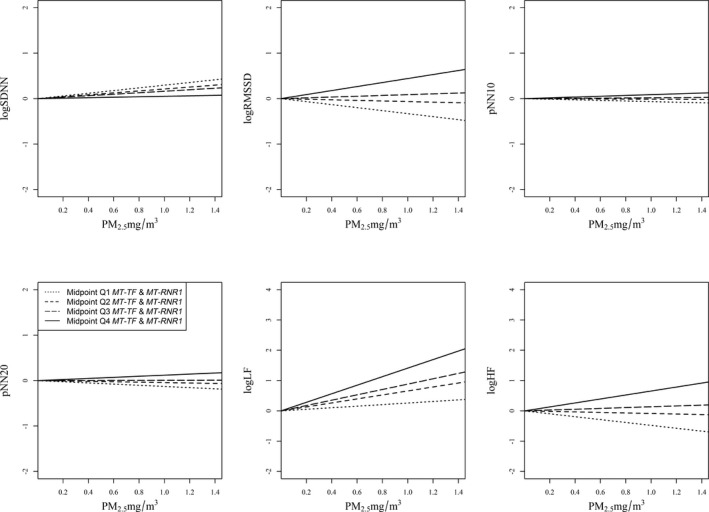
The effect of PM 2.5 exposure on HRV interaction with mtDNA MT‐TF and MT‐RNR1 methylation levels (n=47). Midpoints of Q1, Q2, Q3, and Q4 (12.5, 37.5, 62.5, and 87.5, respectively) indicate the first, second, third, and fourth quartiles of mtDNA MT‐TF and MT‐RNR1 methylation levels. The 4 lines in each figure represent the relationship between PM 2.5 and HRV when the mtDNA MT‐TF and MT‐RNR1 level is at the midpoint of each quartile. Results were adjusted for age (continuous), race (white, nonwhite), current tobacco use (yes, no), caffeine intake (yes, no), body mass index (continuous), type of job (boilermaker or welder/other type of job), season (cold, warm), welding‐work day (yes, no), and plate number. HRV, heart rate variability; logHF: loge transformed high‐frequency power (0.15–0.4 Hz); logLF, loge transformed low‐frequency power (0.04–0.15 Hz); logRMSSD, loge transformed square root of the mean squared difference of successive NN intervals; logSDNN, loge transformed standard deviation of the NN intervals; mtDNA, mitochondrial DNA; NN interval, normal‐to‐normal interval; PM2.5, particulate matter <2.5 µm in diameter; pNN10, proportion of the number of interval differences of successive NN intervals >10 over the total number of NN intervals; pNN20, proportion of the number of interval differences of successive NN intervals >20 ms over the total number of NN intervals; Q, quartile.
Table 5.
Mediation Analysisa to Verify Whether Blood Mitochondrial DNA Methylation Levels Operate as Mediators for the Relationship Between Particulate Matter <2.5 µm in Diameterb and Heart Rate Variability Measures
| Effect | D‐Loop Observed=86, n=45 | MT‐TF and MT‐RNR1 Observed=89, n=47 | ||||
|---|---|---|---|---|---|---|
| Estimate | SEc | 95% CIc | Estimate | SEc | 95% CIc | |
| SDNNd | ||||||
| Controlled direct | 0.01 | 0.04 | −0.06 to 0.09 | 0.02 | 0.03 | −0.03 to 0.07 |
| Natural direct | 0.01 | 0.05 | −0.07 to 0.13 | 0.02 | 0.03 | −0.04 to 0.08 |
| Natural indirect | 0.01 | 0.01 | −0.01 to 0.03 | 0.00 | 0.00 | 0.00–0.01 |
| Marginal total | 0.02 | 0.05 | −0.05 to 0.13 | 0.02 | 0.03 | −0.04 to 0.08 |
| RMSSDd | ||||||
| Controlled direct | 0.01 | 0.04 | −0.06 to 0.08 | 0.01 | 0.03 | −0.04 to 0.07 |
| Natural direct | 0.02 | 0.05 | −0.05 to 0.12 | 0.01 | 0.03 | −0.04 to 0.07 |
| Natural indirect | 0.02 | 0.01 | 0.00–0.05 | 0.00 | 0.00 | −0.01 to 0.01 |
| Marginal total | 0.04 | 0.05 | −0.04 to 0.14 | 0.01 | 0.03 | −0.04 to 0.07 |
| pNN10 | ||||||
| Controlled direct | −0.01 | 0.02 | −0.04 to 0.03 | −0.003 | 0.01 | −0.02 to 0.02 |
| Natural direct | 0.00 | 0.02 | −0.03 to 0.04 | −0.003 | 0.01 | −0.02 to 0.02 |
| Natural indirect | 0.01 | 0.00 | 0.00–0.02 | 0.000 | 0.00 | 0.00–0.00 |
| Marginal total | 0.01 | 0.02 | −0.03 to 0.05 | −0.003 | 0.01 | −0.02 to 0.02 |
| pNN20 | ||||||
| Controlled direct | 0.00 | 0.01 | −0.03 to 0.03 | −0.003 | 0.01 | −0.02 to 0.02 |
| Natural direct | 0.00 | 0.02 | −0.03 to 0.04 | −0.003 | 0.01 | −0.02 to 0.02 |
| Natural indirect | 0.01 | 0.00 | 0.00–0.02 | 0.000 | 0.00 | 0.00–0.00 |
| Marginal total | 0.01 | 0.02 | −0.03 to 0.05 | −0.003 | 0.01 | −0.02 to 0.02 |
| LFd | ||||||
| Controlled direct | 0.03 | 0.10 | −0.15 to 0.24 | 0.07 | 0.07 | −0.06 to 0.2 |
| Natural direct | 0.02 | 0.12 | −0.19 to 0.28 | 0.07 | 0.07 | −0.07 to 0.2 |
| Natural indirect | 0.03 | 0.02 | −0.01 to 0.08 | 0.00 | 0.01 | −0.01 to 0.01 |
| Marginal total | 0.05 | 0.12 | −0.14 to 0.33 | 0.07 | 0.07 | −0.06 to 0.2 |
| HFd | ||||||
| Controlled direct | −0.02 | 0.10 | −0.23 to 0.2 | 0.01 | 0.08 | −0.14 to 0.16 |
| Natural direct | 0.00 | 0.12 | −0.24 to 0.28 | 0.01 | 0.08 | −0.15 to 0.15 |
| Natural indirect | 0.04 | 0.03 | −0.01 to 0.12 | 0.00 | 0.01 | −0.02 to 0.01 |
| Marginal total | 0.04 | 0.13 | −0.18 to 0.35 | 0.01 | 0.08 | −0.14 to 0.15 |
HF indicates high frequency; LF, low frequency; NN interval, normal‐to‐normal interval; pNN10, proportion of the number of interval differences of successive NN intervals >10 over the total number of NN intervals; pNN20, proportion of the number of interval differences of successive NN intervals >20 ms over the total number of NN intervals; RMSSD, square root of the mean squared difference of successive NN intervals; SDNN, standard deviation of the NN intervals.
All models were adjusted by age (continuous), race (white, nonwhite), current tobacco use (yes, no), caffeine intake (yes, no), body mass index (continuous), type of job (boilermaker or welder/other type of job), season (cold, warm), welding‐work day (yes, no), and plate number.
Levels of particulate matter <2.5 µm in diameter expressed as interquantile range (IQR) of particulate matter <2.5 µm in diameter.
SE and 95% CI computed via a bootstrapping technique (500 bootstrap samples).
The values were log transformed for the analysis.
Discussion
In this study, we hypothesized that PM air pollution exposure can affect mtDNA methylation in blood and that mtDNA methylation may interact with air pollution in modulating CVD markers, such as HRV. We found that blood mtDNA methylation showed a negative association with PM2.5 exposure levels. We also found that participants with higher mtDNA methylation levels were more susceptible to the effect of PM2.5 exposures on HRV; however, we did not observe a direct effect of blood mtDNA methylation on HRV.
The effect of air pollution on CVD biomarkers has been studied widely. Air pollution exposure is a risk factor for CVD development,16 and this association is hypothesized to be mediated through leukocytes and indirectly by stimulating platelet activity.17 Consequently, many candidate genes may be implicated in the molecular mechanism behind this association. In this regard, epigenetic factors are emerging as an area of great interest on account of being modifiable through extracellular stresses, including air pollution, in contrast to genetic factors. Subsequently, many studies have assessed the effect of air pollution on global genomic DNA methylation (Alu, Satellite 2, and LINE‐1 repetitive elements) and gene‐specific DNA methylation (eg, ALOX15, AMOTL2, ARHGAP24, IGF2, and PECAM), mainly using blood cells as a surrogate marker.18, 19, 20, 21, 22 For the first time, we have demonstrated a potential role for mtDNA methylation in the association between PM2.5 exposure and CVD risk.
Boilermakers who were highly exposed to PM2.5 in the background ambient environment after welding work showed low levels of HRV. This finding is consistent with previous results demonstrating that high air pollution exposures are linked to CVD risk.3 Exposure to PM causes oxidative stress and damage to cells and tissues. Oxidative stress on mitochondria can damage mtDNA through DNA mutations, oxidation, or methylation of nucleotides.23 To understand the role of epigenetic regulation of the mitochondrial genome in the effect of air pollution on CVD biomarkers, we investigated blood mtDNA methylation levels with air pollution and HRV. Mitochondrial dysfunction is often observed in CVD patients because the heart has a high demand for ATP production, and thus the function of mitochondria is critical.24 However, mtDNA methylation has not been studied in heart tissue because of the inability to access the tissue in living human participants. In contrast, blood is easily accessible and thus has been commonly used as a surrogate marker of CVD and many other diseases.
Our group previously reported that blood platelet mtDNA methylation levels are higher in CVD patients compared with healthy persons.12 Possibly because of the use of a single blood cell type (platelets), the observed differences in mtDNA methylation between CVD patients and healthy persons were relatively larger (20%) than other studies that have used mixed cell–type populations, such as buffy coat.25 In this study, we examined blood mtDNA methylation in samples of buffy coat, which predominantly consists of leukocytes but also has a high proportion of platelets; however, the mtDNA methylation difference between the high‐ and low‐exposure groups was <2%. This finding is consistent with previous studies using buffy coat to study mtDNA methylation.5 Although we hypothesize that the observed changes in mtDNA methylation may have been larger if we had used a single blood cell type, such as platelets, we observed a significant effect of air pollution on blood mtDNA methylation.
The mechanism behind the association of increased risk of CVD with particulate air pollution exposure has been postulated to be systemic inflammation, leading to endothelial dysfunction, oxidative stress, and leukocyte and platelet activation. We showed that blood mtDNA methylation is altered in response to particulate exposure, which may affect mitochondrial biogenesis and cellular function and so contribute to increasing CVD risk through interaction with air pollution exposure. Further work is required to determine the effect of the observed changes in mtDNA methylation on mitochondrial function.
The limitation of our study, as we described earlier, is that we used a mixed blood cell–type population by utilizing samples of buffy coat from the participants. It is likely that we might have observed a larger effect on methylation levels if we had focused on a single cell type; however, the process of isolating a single cell type from frozen buffy coat samples is costly and time intensive, and plasma samples were not available to measure platelet mtDNA methylation. Furthermore, the sample size for this study could have inhibited our ability to identify associations between mtDNA methylation and air pollution exposure and/or HRV; however, our study design included samples from the same participants at 2 TPs to decrease the effect of random variation. In addition, inclusion of caffeine as a binary variable in all models could potentially affect the results; however, the study population is composed of healthy men free of any CVDs, and previous literature showed that the level of caffeine consumption is lower than the safe limit of 400 mg/day across age groups in the United States.26 Moreover, caffeine consumption lower than the safe limit has not been associated with any adverse health effects in healthy adult populations.26 Finally, studies of mitochondrial gene expression and function could have brought further insight into the effect of air pollution on mitochondrial activity, but RNA was not available for this purpose. Other epigenetic factors in mitochondria would strongly support the proof of concept. Although mtDNA does not contain histone complexes, microRNA‐based regulation of mitochondrial gene expression may be further implicated in the effect of air pollution on mitochondrial function.
Conclusions
It is known that exposure to PM air pollution increases CVD risk and that CVD patients have higher blood levels of mtDNA methylation. We reported that blood mtDNA methylation was negatively associated with PM2.5 exposure, and blood mtDNA methylation modified the negative relationship between PM exposure levels and HRV markers. Our results suggest that persons with higher blood mtDNA methylation levels were more susceptible to the adverse PM effect on HRV measures.
Sources of Funding
This work was supported by the National Institutes of Health (National Institute of Environmental Health Sciences) (R21ES022694 to Byun and Baccarelli and R01ES009860 to Christiani).
Disclosures
None.
(J Am Heart Assoc. 2016;5:e003218 doi: 10.1161/JAHA.116.003218)
References
- 1. Brook RD, Rajagopalan S, Pope CA III, Brook JR, Bhatnagar A, Diez‐Roux AV, Holguin F, Hong Y, Luepker RV, Mittleman MA, Peters A, Siscovick D, Smith SC Jr, Whitsel L, Kaufman JD; American Heart Association Council on E, Prevention CotKiCD, Council on Nutrition PA, Metabolism . Particulate matter air pollution and cardiovascular disease: an update to the scientific statement from the American Heart Association. Circulation. 2010;121:2331–2378. [DOI] [PubMed] [Google Scholar]
- 2. Pope CA III, Verrier RL, Lovett EG, Larson AC, Raizenne ME, Kanner RE, Schwartz J, Villegas GM, Gold DR, Dockery DW. Heart rate variability associated with particulate air pollution. Am Heart J. 1999;138:890–899. [DOI] [PubMed] [Google Scholar]
- 3. Fan T, Fang SC, Cavallari JM, Barnett IJ, Wang Z, Su L, Byun HM, Lin X, Baccarelli AA, Christiani DC. Heart rate variability and DNA methylation levels are altered after short‐term metal fume exposure among occupational welders: a repeated‐measures panel study. BMC Public Health. 2014;14:1279. [DOI] [PMC free article] [PubMed] [Google Scholar]
- 4. Zhong J, Colicino E, Lin X, Mehta A, Kloog I, Zanobetti A, Byun HM, Bind MA, Cantone L, Prada D, Tarantini L, Trevisi L, Sparrow D, Vokonas P, Schwartz J, Baccarelli AA. Cardiac autonomic dysfunction: particulate air pollution effects are modulated by epigenetic immunoregulation of Toll‐like receptor 2 and dietary flavonoid intake. J Am Heart Assoc. 2015;4:e001423 doi: 10.1161/JAHA.114.001423. [DOI] [PMC free article] [PubMed] [Google Scholar]
- 5. Byun HM, Motta V, Panni T, Bertazzi PA, Apostoli P, Hou L, Baccarelli AA. Evolutionary age of repetitive element subfamilies and sensitivity of DNA methylation to airborne pollutants. Part Fibre Toxicol. 2013;10:28. [DOI] [PMC free article] [PubMed] [Google Scholar]
- 6. Janssen BG, Byun HM, Gyselaers W, Lefebvre W, Baccarelli AA, Nawrot TS. Placental mitochondrial methylation and exposure to airborne particulate matter in the early life environment: an ENVIRONAGE birth cohort study. Epigenetics. 2015;10:536–544. [DOI] [PMC free article] [PubMed] [Google Scholar]
- 7. Carugno M, Pesatori AC, Dioni L, Hoxha M, Bollati V, Albetti B, Byun HM, Bonzini M, Fustinoni S, Cocco P, Satta G, Zucca M, Merlo DF, Cipolla M, Bertazzi PA, Baccarelli A. Increased mitochondrial DNA copy number in occupations associated with low‐dose benzene exposure. Environ Health Perspect. 2012;120:210–215. [DOI] [PMC free article] [PubMed] [Google Scholar]
- 8. Dagher Z, Garcon G, Billet S, Gosset P, Ledoux F, Courcot D, Aboukais A, Shirali P. Activation of different pathways of apoptosis by air pollution particulate matter (PM2.5) in human epithelial lung cells (L132) in culture. Toxicology. 2006;225:12–24. [DOI] [PubMed] [Google Scholar]
- 9. Cesaroni G, Forastiere F, Stafoggia M, Andersen ZJ, Badaloni C, Beelen R, Caracciolo B, de Faire U, Erbel R, Eriksen KT, Fratiglioni L, Galassi C, Hampel R, Heier M, Hennig F, Hilding A, Hoffmann B, Houthuijs D, Jockel KH, Korek M, Lanki T, Leander K, Magnusson PK, Migliore E, Ostenson CG, Overvad K, Pedersen NL, Pekkanen JJ, Penell J, Pershagen G, Pyko A, Raaschou‐Nielsen O, Ranzi A, Ricceri F, Sacerdote C, Salomaa V, Swart W, Turunen AW, Vineis P, Weinmayr G, Wolf K, de Hoogh K, Hoek G, Brunekreef B, Peters A. Long term exposure to ambient air pollution and incidence of acute coronary events: prospective cohort study and meta‐analysis in 11 European cohorts from the ESCAPE Project. BMJ. 2014;348:f7412. [DOI] [PMC free article] [PubMed] [Google Scholar]
- 10. Shock LS, Thakkar PV, Peterson EJ, Moran RG, Taylor SM. DNA methyltransferase 1, cytosine methylation, and cytosine hydroxymethylation in mammalian mitochondria. Proc Natl Acad Sci USA. 2011;108:3630–3635. [DOI] [PMC free article] [PubMed] [Google Scholar]
- 11. Feng S, Xiong L, Ji Z, Cheng W, Yang H. Correlation between increased ND2 expression and demethylated displacement loop of mtDNA in colorectal cancer. Mol Med Rep. 2012;6:125–130. [DOI] [PubMed] [Google Scholar]
- 12. Byun HM, Panni T, Motta V, Hou L, Nordio F, Apostoli P, Bertazzi PA, Baccarelli AA. Effects of airborne pollutants on mitochondrial DNA methylation. Part Fibre Toxicol. 2013;10:18. [DOI] [PMC free article] [PubMed] [Google Scholar]
- 13. Cavallari JM, Eisen EA, Fang SC, Schwartz J, Hauser R, Herrick RF, Christiani DC. PM2.5 metal exposures and nocturnal heart rate variability: a panel study of boilermaker construction workers. Environ Health. 2008;7:36. [DOI] [PMC free article] [PubMed] [Google Scholar]
- 14. Malik M. Heart rate variability. Ann Noninvasive Electrocardiol. 1996;1:151–181. [Google Scholar]
- 15. Valeri L, Vanderweele TJ. Mediation analysis allowing for exposure‐mediator interactions and causal interpretation: theoretical assumptions and implementation with SAS and SPSS macros. Psychol Methods. 2013;18:137–150. [DOI] [PMC free article] [PubMed] [Google Scholar]
- 16. Hassing HC, Twickler TB, Kastelein JJ, Cramer MJ, Cassee FR. Air pollution as noxious environmental factor in the development of cardiovascular disease. Neth J Med. 2009;67:116–121. [PubMed] [Google Scholar]
- 17. Campen MJ, Lund A, Rosenfeld M. Mechanisms linking traffic‐related air pollution and atherosclerosis. Curr Opin Pulm Med. 2012;18:155–160. [DOI] [PMC free article] [PubMed] [Google Scholar]
- 18. Kim M, Long TI, Arakawa K, Wang R, Yu MC, Laird PW. DNA methylation as a biomarker for cardiovascular disease risk. PLoS One. 2010;5:e9692. [DOI] [PMC free article] [PubMed] [Google Scholar]
- 19. Baccarelli A, Wright R, Bollati V, Litonjua A, Zanobetti A, Tarantini L, Sparrow D, Vokonas P, Schwartz J. Ischemic heart disease and stroke in relation to blood DNA methylation. Epidemiology. 2010;21:819–828. [DOI] [PMC free article] [PubMed] [Google Scholar]
- 20. Hiltunen MO, Turunen MP, Hakkinen TP, Rutanen J, Hedman M, Makinen K, Turunen AM, Aalto‐Setala K, Yla‐Herttuala S. DNA hypomethylation and methyltransferase expression in atherosclerotic lesions. Vasc Med. 2002;7:5–11. [DOI] [PubMed] [Google Scholar]
- 21. Movassagh M, Choy MK, Goddard M, Bennett MR, Down TA, Foo RS. Differential DNA methylation correlates with differential expression of angiogenic factors in human heart failure. PLoS One. 2010;5:e8564. [DOI] [PMC free article] [PubMed] [Google Scholar]
- 22. Heijmans BT, Tobi EW, Stein AD, Putter H, Blauw GJ, Susser ES, Slagboom PE, Lumey LH. Persistent epigenetic differences associated with prenatal exposure to famine in humans. Proc Natl Acad Sci USA. 2008;105:17046–17049. [DOI] [PMC free article] [PubMed] [Google Scholar]
- 23. Cline SD. Mitochondrial DNA damage and its consequences for mitochondrial gene expression. Biochim Biophys Acta. 2012;1819:979–991. [DOI] [PMC free article] [PubMed] [Google Scholar]
- 24. Meyers DE, Basha HI, Koenig MK. Mitochondrial cardiomyopathy: pathophysiology, diagnosis, and management. Tex Heart Inst J. 2013;40:385–394. [PMC free article] [PubMed] [Google Scholar]
- 25. Baccarelli AA, Byun HM. Platelet mitochondrial DNA methylation: a potential new marker of cardiovascular disease. Clin Epigenetics. 2015;7:44. [DOI] [PMC free article] [PubMed] [Google Scholar]
- 26. Mitchell DC, Knight CA, Hockenberry J, Teplansky R, Hartman TJ. Beverage caffeine intakes in the U.S. Food Chem Toxicol. 2014;63:136–142. [DOI] [PubMed] [Google Scholar]