

Abstract
Owing to the rapid movements of the human upper eyelid, a high-speed camera was used to record and characterize voluntary blinking and the blink dynamics of blepharoptosis patients were compared to a control group. Twenty-six blepharoptosis patients prior to surgery and 45 control subjects were studied and the vertical height of the palpebral aperture (PA) was measured manually at 2 ms intervals during each blink cycle. The PA and blinking speed were plotted with respect to time and a predictive model was generated. The blink dynamic was analysed in closing and opening phases, and revealed a reduced speed of the initial opening phase in ptotic patients, suggesting intrinsic muscle function change in ptosis pathogenesis. The PA versus time curve for each subject was reconstructed using custom-built parameters; however, there were significant differences between the two groups. Those parameters used included the rate of closure, the delay between opening and closing, rate of initial opening, rate of slow opening (nonlinear function) and the ‘switch point’ between those two rates of opening. The model was tested against a new group of subjects and was able to discriminate ptosis patients from controls with 80% accuracy.
Keywords: blink dynamics, blepharoptosis, ptosis, blinking
1. Introduction
Blepharoptosis, also known as ‘ptosis’, is characterized by abnormal drooping of the upper eyelid and affected individuals have difficulty raising their lids to the normal vertical palpebral aperture (PA) of about 9–12 mm [1]. Although there is ethnic variation in the PA, in particular, it is significantly smaller in Asian ethnic groups [2], the severity of ptosis can be usefully measured by the PA.
Ptosis, which can be congenital or acquired, can affect one (unilateral) or both eyes (bilateral), and may be due to many different factors. The acquired form is most commonly observed as an age-related involutional change characterized by levator aponeurosis dehiscence, referred to as ‘an aponeurotic ptosis’ [3]. However, it can arise from a wide range of causes which include: trauma; mechanical effects, eyelid masses; neurological defects, such as third cranial nerve palsy or Horner's syndrome; or myogenic causes in diseases such as myotonic dystrophy or mitochondrial myopathy. In severe ptosis, the visual axis may be obscured by the eyelid causing functional blindness.
Myogenic and neurological causes of ptosis generally involve weakness of the levator palpebrae superioris (LPS) muscle that lifts the upper eyelid during opening. The precise mechanism for development of an aponeurotic ptosis is poorly understood, but has been suggested to arise from a disinsertion of the levator muscle from the tarsal plate [3–5] and would therefore, in theory, affect the blinking dynamics. At present, manual measurement of the PA height and the eyelid excursion (‘LPS muscle function’) are the sole determinants for diagnosing ptosis. This method also involves experienced judgements at early stages of the disease. Our limited knowledge of blinking dynamics in ptotic patients suggested that an accurate and detailed analysis of the blink cycle could further our understanding of diseased blinking dynamics compared to normal eyes. In addition, appropriate modelling of the blink cycle may enable clinicians to diagnose ptosis more accurately and at an earlier stage, where the condition is less likely to be of concern to the patients. Subsequently, this can also provide avenues for monitoring and adequate treatment.
Characteristics of blink dynamics such as height of the PA, blink speed, duration and frequency vary significantly between healthy and affected groups, but no data have been published to compare the blink dynamics of patients with ptosis as compared with unaffected subjects. Blink dynamics have been studied by placing electrodes immediately above the eyebrow and below the lower eyelid, and amplifying these oculometric signals for offline analysis [6]. Static image analysis using a high-speed camera has also been used [7]. Also, other techniques, such as infrared-oculography [8] or a magnetic search-coil technique have been used to investigate the rapid blink movements [9–12].
In this work, a high-speed camera was used to record the voluntary motion of eye blinking in patients suffering from ptosis. For each blink cycle in individual patients, the images were analysed for central height of the PA as a function of time. A model was constructed to quantify the characteristics of ptotic blink dynamics, and the results compared with those for healthy subjects. Linear discriminant analysis (LDA) and Gaussian classification were used to discriminate between diseased and healthy subjects and the results could potentially improve clinical evaluation and provide a reliable method for the diagnosis and quantification of ptosis.
2. Experimental details
2.1. Subject selection
There is ethnic variability in facial structure, especially between Western and Oriental Asian faces, the dominant features of the Asian face being a significantly wider intercanthal distance and a narrower vertical PA as well as a wider facial contour compared to Caucasian subjects [2]. These differences in facial structures might be reflected in varied muscle attachments and, combined with a narrower PA, this might affect the blink mechanics and dynamics that were measured in this study. Consequently, volunteers of Oriental origin (very few in number) were excluded from the study.
Twenty-six ptosis patients (11 males and 15 females) and 45 healthy volunteers (14 males and 31 females), including the 25 healthy subjects from our previous study [13] were included in the present work. A comparative histogram of the probability distribution of values of the discriminant function was plotted and confirmed that there is no statistically significant difference between the genders.
All ptosis patients were awaiting surgical correction of their aponeurotic disinsertion ptosis and were recruited from the oculoplastic service at Moorfields Eye Hospital NHS Foundation Trust. Ptosis patients ranged from age 22 to 84 (mean of 52) years, and the control range was 25–67 years (mean of 41) (detailed breakdown of the different ptosis conditions are supplied in the electronic supplementary material, S1). Seven additional subjects (one male and six females) were not used for primary mathematical modelling, but were used retrospectively to assess for reliability of the derived model.
Control data were collected using two different cameras, with frame rates of 500 fps and 600 fps measurements taken every 5 ms—to give an effective frame rate of 200 fps, as in our previous study [13]. Subsequently, smooth curves were fitted to the raw data to ensure that differences in the collection protocol had a negligible effect on the results.
2.2. Protocols
The present protocol followed the previously described principles introduced for analysis of blink dynamics using high-speed camera images [13], with only minor differences in the equipment used and analytical techniques. Ptosis patients, who agreed to participate in this study, had their blinking recorded by a high-speed camera and all participants were briefed before filming, explaining what would be measured and how it would be accomplished. After filming, the patients had their ocular surface examined and key oculoplastic measurements were taken manually—namely, vertical PA; the maximum excursion of the upper eyelid margin in millimetres (‘LF’); and ‘margin–reflex distance’ (‘MRD’), the distance between the central corneal light reflex and upper eyelid margin in primary gaze. LF is the commonly employed standard for classifying LPS function, and the PA and MRD indicate the static severity of ptosis [1,14,15].
Subjects were seated comfortably in a controlled hospital environment at room temperature (22.6 ± 1.6°C) and standard humidity (28.3 ± 2.2%), with natural light (not directly shining on their faces). The high-speed camera was set-up at eye level in front of the subjects, and 12.3 s of high-speed recording of voluntary blinking was taken for each patient with a monochrome Photron Ultima APX12 K Camera (Photron—Europe Limited, Buckinghamshire, UK), operating at 500 fps with full 1024 × 1024 resolution; a total of 6144 frames per patient was recorded in 8 bit greyscale. The camera was mounted with a Nikon f/2.8 macro zoom lens with focal length of 24–85 mm. Subjects were asked to relax, look straight into the camera and blink as normally as possible; a brief pause prior to recording allowed the subjects to familiarize themselves and be as natural as possible. A verbal command was given before each blink was captured.
A desktop computer running Windows 7 operating system with the high-speed camera's default software (Photron FASTCAM Viewer v. 3.5.1.0) was used to capture the data, in real-time, and record it directly to an external hard-drive. All images were captured in RAW format and converted to TIFF, using the same software.
2.3. Method of analysis
Isolation of a complete blink (100% PA recovery) from each subject was attempted, it being considered a blink if their upper eyelid margin reached below 50% of the starting PA during the closure phase. Some subjects did not achieve 100% recovery, and were therefore analysed to the closest maximum percentage recovery. Only the affected eyes were considered in the ptosis patients and both eyes were included in the control group but were not treated as pairs. The PA in 71 subjects was measured using open source freeware (‘ImageJ’ software; W. Rasband, National Institute of Mental Health, USA), the PA being determined by calibrating the horizontal corneal diameter to a standard of 11.70 mm [16] and the central PA assessed in every frame of the recorded videos. The measurement started from the moment the upper eyelid descended and continued until the initial PA value was recovered, or until the eye ceased to open further. The resulting data were normalized to generate a comparable master curve (figures 1 and 2) in order to include patients with a range of PA measurements. Blink duration and peak blink speed were also analysed and compared to the control group. Blink frequency was not measured both because it is highly variable and also because this study focuses on voluntary blinking. Speeds were calculated as a magnitude from the upper lid excursion for each frame (that is, by a one-sided finite difference approximation). These results are presented in §3.1. Means and standard errors of the means were calculated for both groups.
Figure 1.

PA and speed master curves for all controls. Two sets of normal subject's blinking: Kwon et al. [13] PA master curve is shown in grey and its respective speed is shown in yellow [13]. The PA master curve is shown in blue and its respective speed is shown in orange. Secondary axis for the speed master curve is on the right-hand side, measured in millimetres per second. The chart is plotted with mean ± s.e.m.
Figure 2.

PA and speed master curves for ptosis patients. PA versus speed master curve for both left and right eyes in ptosis patients. The PA master curve is shown in blue and its respective speed is shown in orange. Secondary axis for the speed master curve is on the right-hand side, measured in millimetres per second. The chart is plotted with mean ± s.e.m.
2.4. Statistical analysis
The measured RAW data were fed into a program written in Mathematica (Wolfram Research Champaign, IL, USA) and investigated using Fisher's linear discriminant analysis and Gaussian classifiers.
As ptosis is often age-dependent as discussed in §3.3, this analysis has been carried out in several ways: (i) ptosis group versus control group (irrespective of age), data not shown. (ii) Control subjects only—age 40 or over versus age below 40 (§3.3). (iii) Ptosis group versus control group—patients of age 40 or over only (§3.4). The cut-off point for the control group at age 40 was chosen to select the best age-match for our two study groups while maximizing the sample size: for age greater than or equal to 40, the mean control age became 51 years (with sample size of 22), compared to a mean age of 52 years for all 26 ptosis patients.
To model the eyelid motion in order to differentiate ptosis from controls, recreating the blinking profile was attempted. Key features of the PA versus time plot were separated into different parameters to fit a function to best represent these features (figure 3). These parameters include initial opening, time offset for closing, minimum opening, rapidity of closure, time offset for opening, rapidity of opening, time offset for slow opening, rapidity of slow opening and endpoint. Analysing the data were performed in order to allow Mathematica to characterize the ptotic blink dynamics and to determine whether they were different from the control group. For this reason, another group of subjects was gathered from Moorfields Eye Hospital to act as masked controls in a retrospective test of our model. In this study, we have used the five parameters detailed in the next section (§2.5).
Figure 3.

Fitting the blinking profile. An example of breaking down the blink PA versus time curve into possible key features—parameters that could be used in our analysis. The blue trace is the PA measurement against time, and the red trace is fitting of the functions designed to represent the key features of the blink profile.
2.5. Coding
There are two main aspects to the Mathematica coding: extracting parameters from the data and analysing them statistically. The time trace for each blink was first normalized, with the maximum PA set to 100%, and then divided into five segments, as follows (figure 3):
(1) constant at the initial PA, PAstart, from time 0 to t1;
(2) constant-velocity closure at a rate v1 to the minimum PA, PAmin, between t1 and t2;
(3) constant at PAmin from t2 to t3;
(4) constant-velocity opening at a rate v2 from t3 to the switching time (to the next parameter; change of rate of opening) t4;
(5) smooth approach to full opening from t4 to the end of the trace, PA(t)=A + B tanh(α(t − t4)).
The values of A and B were determined by the value of PA at t4 and by the requirement that the PA should asymptotically tend to its final value PAend and the best fit of this piece-wise smooth function was determined for each time trace by using Mathematica's NonlinearModelFit function. The fitted parameters were PAstart, PAend. v1, v2, α, tclose = (t1 + t2)/2, topen which is defined similarly to tclose as the time at which the PA would reach (PAmin + PAend)/2 at a rate v2, and t4, the switching time. The value of PAmin was not used as a fitting parameter, but was set to the observed minimum percentage PA.
The fitted parameters characterize the time trace, but in order to remove any constant offsets from the time traces the five quantities that were used for further analysis were v1, v2, α, T1 = (topen − tclose) and T2 = (t4 − topen). The measured value of PAmin was also taken into consideration, as it was observed that while healthy eyes were all able to close fully, some ptotic eyes could not: cases with full closure were analysed separately from those with partial closure.
The initial analysis was to assemble a linear combination of the five quantities described above which best distinguishes between ptotic and healthy eyelids, and this was done using the Fisher linear discriminant procedure [17], which maximizes the ratio of ‘between-class’ and ‘within-class’ variances; this finds the best plane in the five-dimensional space of the parameters for separating the classes. Although this revealed a fair ability to separate the classes, it also showed that ptotic eyelids have much larger variances in the parameters than healthy eyelids—this implying that better results could be expected with a curved (rather than planar) surface separating the classes. This latter was achieved by using a Gaussian classifier that involves calculating the means (μc) and covariance matrices (σc) for each class (c) and then assigning an eye with parameters x to class c with a probability.
 |
2.1 |
In the above expression, as is conventional, || denotes a determinant and a superscript T denotes a transposed vector. Note that this assumes equal prior probabilities for all classes—that is, before any measurements are taken any eye is assumed to be equally likely to be healthy or ptotic.
3. Results and discussion
3.1. Palpebral aperture, blink duration and blink speed
The cinematographic PA in this study ranged from 1.15 to 10.45 mm with a mean of 6.90 ± 0.30 mm (standard error of the mean; hereafter abbreviated as s.e.m. in text) in 26 ptosis patients; compared to the range of 6.29–12.78 mm with a mean of 9.08 ± 0.15 mm (s.e.m.) of all 45 control subjects. Ptosis patients have a significantly smaller PA (p = 0.003; table 1). These measurements were made during the high-speed camera image analysis rather than being actual measurements on the volunteers. The PA master curve is shown in figures 1 and 2 for controls and ptosis patients.
Table 1.
Results of upper eyelid blink dynamics from this study and Kwon et al. [13].
| blinking dynamics (2 s.f.) |
|||||
|---|---|---|---|---|---|
| references | no. test subjects | age | maximum velocity (mm s−1) | PA (mm) | duration (ms) |
| Kwon et al. [13] controls | 25 | 25–63 | 240 ± 9 | 9.8 ± 0.17 | 570 ± 25 |
| this study | |||||
| control | 20 | 29–67 | 290 ± 16 | 8.2 ± 0.18 | 490 ± 40 |
| ptosis | 26 | 22–84 | 260 ± 14 | 6.9 ± 0.30a | 560 ± 50 |
| additional subjects | 7 | 22–77 | 210 ± 29 | 7.9 ± 0.51 | 810 ± 130 |
aSignificantly different from the control subjects.
Total blink durations were calculated from the start of upper eyelid descent until maximum recovery in each isolated blink in ptosis and the control subjects. Only 14/131 eyes did not achieve 100% recovery, of which three were from ptosis patients. The incompletely recovered blinks have a mean of 96.8% recovery, ranging from 79 to 99.7% across all subjects. Ptosis patients have average blink duration of 560 ± 50 ms (s.e.m.), greater than that of the control group; 530 ± 22 ms (s.e.m.) of the controls. However, while there was a trend for blinking duration in ptosis patients to be greater than controls, the data were not significantly different (p = 0.28). A summary is presented in table 1, together with the peak speed achieved in ptosis and in control patients.
Figures 1 and 2 show how the normalized PA changed over time, with the average speed overlay. They both share similar key features such as a rapid decrease in PA and then a slower and distinctively two-stage opening phase—after which they reach approximately 97% recovery, in agreement with Kwon et al. [13]. The speed master curve exhibits two parabolic curves; one for the closing phase and the other one for the opening phase. In comparison, ptosis patients have very similar upper eyelid closure acceleration to the control group, with peak speed at near-mid closing and then decelerating until reaching their full closure. However, the initial opening speed (second parabolic speed curve) seems to have diminished in the ptosis patients compared to the controls. Ptosis patients have a mean peak speed of 258.7 ± 13.7 mm s−1 (s.e.m.), (range 105.5–459.5 mm s−1) and the control subjects have 260 ± 8.5 mm s−1 (s.e.m.) (range 128.5–482 mm s−1), with a significance of 0.79; thus, the null hypothesis of there being no difference between the two peak speed means was confirmed.
The speed of blink was then considered as two components in each subject: the closing phase and the opening phase (figure 4). During the closing phase, the peak speed in controls ranges from 130 to 480 mm s−1 (mean 260 ± 9 mm s−1; mean ± s.e.m.), as compared to the ptosis group, ranging from 110 to 460 mm s−1 (mean of 254 ± 15 mm s−1; mean ± s.e.m.). Considering the opening phase as a single entity, the peak speed in the control group ranged from 90 to 260 mm s−1 (mean of 156 ± 4 mm s−1), compared to the ptosis group ranging from 50 to 375 (mean of 160 ± 14 mm s−1; mean ± s.e.m.); figures were rounded to the nearest integer. These findings might suggest that altered intrinsic LPS muscle function has a role in the development of acquired ptosis, rather than dehiscence of the LPS from the tarsal plate, and might explain the long-observed feature of reduced eyelid excursion in acquired ptosis. However, the above s.e.m. values of the ptosis group were insignificant compared to controls.
Figure 4.

Maximum speed during opening and closing phases: control versus ptosis (to the nearest number). The bars represents the averaged maximum speed during different phases of blinking: blue is control closing compared to orange for ptosis closing; and grey is control opening comparing to yellow for ptosis opening. Error bars are shown as s.e.m.
While it was expected that the closing phase would always achieve higher speed than the opening phase, a small number of ptosis patients (4/26) achieved a faster upper eyelid opening speed than closing. The reasons for this are unclear, but these data might suggest a more widespread motor dysfunction, extending to orbicularis function, presenting in patients with ptosis.
3.2. Distinctive two-stage recovery
A characteristic two-staged PA recovery was observed in each individual PA versus time graph, indicated as ‘switch point’ in figure 3. The outcome of the Mathematica model was greatly improved after this parameter was introduced, compared to the beta tests without this ‘switch point’. One possible explanation for this phenomenon may be the extensive internal connective tissues and the activation of different muscle fibres in the extraocular muscles. The LPS muscle consists of a mixture of muscle fibres with fast-twitch fibres similar to those seen in the global layer of the extraocular muscles and also unique slow-twitch fibre types. The singly innervated global/slow type accounts for about a third of this layer and has a high mitochondrial content and has a high fatigue resistance. The global/fast type, on the other hand, has a low mitochondrial content with low fatigue resistance [18]. These muscle fibres subtypes work in parallel with different functional properties, and this might explain the distinctive two-staged recovery during the opening phase of a blink.
The curved traces of the PA versus time graph during the initial closing and the latter opening phase is likely to be due to the muscle architecture. Most muscle fibres are short and do not extend to the tendons [19]. The myofibres in each muscle are concentrated in the mid-section and decrease in density as they approach their insertions, contributing to the nonlinear contraction properties in the PA versus time graphs.
3.3. The effect of age
It was necessary to explore the possibility that the results of the present study are merely age-related effects rather than a true difference between the controls and the affected eyelids.
All normalized PA versus time graphs for the control subjects were plotted with their respective speed plot over-laid. All parameters were calculated and full details are provided in the electronic supplementary material, S2. When the functions were applied to the individual eyelids, in order to have the best fit, some did not start at 100% due to the stepwise fitting of an initial constant PA followed by closing at a speed v1, the rate at which the upper eyelid descends; an example of the fitting can be seen in figure 3. For example, in the electronic supplementary material, S2, subject ID 2C4 [left eyelid, LE], 2C33 [LE and right eyelid, RE] did not start at 100%, and it was noted that 63% of these subjects also have incomplete closure.
These data were analysed using LDA and before being separated into their respective age groups (greater than or equal to 40 and less than 40), there were some major overlaps. However, there was an obvious separation of the two means when divided into two groups (figure 5). Mahalanobis distance was used as the discriminant to measure how many standard deviations a data point is away from the mean of the distribution in a multidimensional space; the closer the distance to the centre of distribution, the more likely it is to belong to that class. The function used to describe this distance is defined as
| 3.1 |
Figure 5.

Blinking discriminant between control subjects of greater than or equal to 40 (pink) versus less than 40 (cyan). This analysis used the five parameters mentioned in the text: rate of closure, delay between opening and closing, initial rate of opening, switch point and rate of slow opening. The coloured X is the mean of the respective group. Values on x1- and x2-axes are merely numbers representing the reduced dimension in LDA.
Symbols were defined before in equation (2.1).
A significantly large separation between the means of the two groups (figure 5) shows that age is a factor in blinking dynamics and that it would be appropriate to conduct further analysis with a group of controls selected to age-match the patients suffering from ptosis.
3.4. Ptosis versus control
It has been shown that age is a factor in blink dynamics and, to remove this effect in further analysis, we compared the ptosis group with the control subjects aged greater than or equal to 40. Using the same parameters as described above, all the PA versus time curves were reconstructed for all ptosis patients and the selected control subjects and the key features extracted (figure 6). The value of the minimum is only included if the eye closure was not complete. The start and end percentages were not included because they are not really shape parameters (full details are presented in the electronic supplementary material, S3).
Figure 6.
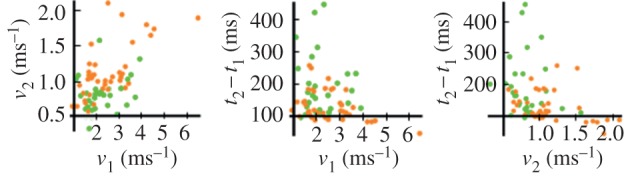
Three-dimensional discriminant display of the parameter used for ptosis (all ages; green) and controls (greater than or equal to 40 year-old; orange). v1, v2, topen and tclose are defined in text (§2.5). The value of PAmin is neglected as it does not have much significance, as the real value of the minimum is often at a cusp. Also the start and end % were not considered because they are not really shape parameters.
The three-dimensional display (figure 6) was reduced to generate figure 7. There is a clear difference between the class means, but there are still overlaps in the middle portion. A probability-based discriminant was used to differentiate between the two classes, because the data are differently spread in the classes. Therefore, a dividing curve that curls around the class that is less widely spread out is better to separate the two of them: a linear discriminant function leading to a planar separation was inadequate in this case.
Figure 7.

Ptosis patients (green) versus greater than or equal to age 40 controls (orange) in the reduced dimension of the linear discriminant. Axes x1 and x2 are the first two principal directions in the space of the linear discriminant. The class means are shown as the X marker in its respective colour.
A slower rate of eye opening in ptosis patients compared to controls, characterized by v2 was observed and therefore a more quantitative measurement was sought. A histogram was generated for comparison of the v2 parameter between the ptosis patients (mean of 0.87 with the variance of 0.108), and controls (mean of 1.01 with the variance of 0.057). Figure 8 demonstrates a heavy overlap between the two sets of data but Mann–Whitney tests have revealed a significant difference in the mean at the p = 0.005 level. Although this might serve as an indicator for distinguishing ptosis from controls, one must note that this is just one of the features used in the discriminant process and would not be sufficient for diagnostic purposes.
Figure 8.

Comparison of v2 parameter between ptosis and control patients are displayed on this histogram. It demonstrates a slower rate of opening in the ptosis patients than the controls by a small, but significant amount.
This analysis gives us a model to discriminate ptosis from normal cases and this dataset constituted the ‘learning’ set of data. The discriminant can be applied to a new set of untested subjects, and hence a further test-set of seven additional subjects was acquired to investigate the robustness of the procedure (table 2).
Table 2.
Probability test for the seven additional test subjects (in two decimal places). This group of subjects has all been assumed to have ptosis for the purpose of this exercise and after applying our model on Mathematica, four out of six eyes were correctly considered ptotic; 10 cases were considered normal of which, three cases were misclassified. Correct prediction from the model was represented by tick marks on the right and misclassification by cross marks.
 |
In table 2, ID 1–19 [LE] achieved 90% of certainty as a ptosis subject, whereas its [RE] counterpart is 100% ptosis, and ID 1–25 [LE] was predicted 78% and [RE] 99% for ptosis; both of these match with the clinical diagnosis. However, the model failed to pick up ID 1–23 [LE], 1–37 [LE] and 1–6 [RE] as ptosis and considered them normal. An interesting case here is that ID 1–6 [RE] has traumatic ptosis, a physical injury that causes reduced function of the upper eyelid. It is likely that the reason the present model failed to classify it as ptosis is that the causation of the ptosis was an injury rather than a developed disease, such as neurological or aponeurotic. There are no cases of traumatic ptosis in our learning set of data.
ID 1–24 [LE] and [RE] and 1–7 [RE] in table 2 have been classified as normal and the clinical diagnosis is of ophthalmoplegia and tarsorrhaphy, respectively. The present model was programmed to detect ptosis, and therefore other diseases are likely to be classed as ‘normal’: this does not mean they are completely healthy. Note ID 1–24 [RE] in table 2 achieved 65%/35% as normal/ptosis, suggesting some abnormality or borderline ptosis. This was understandable as the patient has been diagnosed with myopathy, ocular muscle paralysis, and the right eye is the worse of the two eyes. Other normal cases (table 2) have been correctly classified as normal, such as ID 1–23 [RE], 1–37 [RE], 1–6 [LE] and 1–7 [RE].
3.5. Future developments
Our model failed to diagnose the one instance of ptosis caused by trauma, having predicted 0% probability for ptosis for case 1–6 [RE] (table 2). It might also be insensitive to weakness and atrophy of ocular muscles from myopathies or paralysis. With more sophistication, this model has the potential to predict specific causations of ptosis with relatively good accuracy. On the other hand, the type of blinking captured in the high-speed recordings may be a factor. It is possible that even clinically diagnosed ptosis patients may have some aspect of blinking dynamics that are comparable to controls. This is an aspect that could be investigated further.
On fitting models, not all PA versus time curves have been matched as tightly as they could be. For example in figure 9, the starting point has been replaced by a kink in a piece-wise linear function, but the original trace has a smoother shape. Similarly, some curvature was seen in a small section just before full closure and at the beginning of the opening phase. For future improvements, a function could be designed with extra parameters that could also capture these minute, but possibly significant features. Furthermore, we could introduce the severity of the ptosis as an extra parameter to improve the ‘learning’ in the present model.
Figure 9.

Fitting of the blinking profile on the PA versus time curve for a control patient. It is clear that the blinking profile is not fitting every detail if we only have linear functions for closure and initial opening. Some of the information is lost after conversion into the fitting function.
4. Conclusion
Resting maximum PAs in ptosis patients were significantly lower than those of controls and ptosis patients also had a greater range of PA (1.15–10.45 mm, compared with 6.29–12.78 mm in controls). The average duration of a single blink in ptosis patients was 560 ± 24 ms (s.e.m.), a small but statistically insignificant increase from the 530 ± 22 ms (s.e.m.) of the controls.
The speed master curve in control subjects exhibit two -parabolic curves; one for the closing phase and the other for the opening phase, with the peak speed of 260.0 ± 8.5 mm s−1 (s.e.m.). However in ptosis patients, this curvature during the initial opening phase was reduced, demonstrating a much lower rate of recovery during opening phase. The speed curve in the PA versus time plot could also be the combined effect of LPS, Müller's muscle, frontalis muscle and other accessory muscles. Therefore, a reduced rate of opening/acceleration at the initial opening phase was observed. Peak speeds were found to be 258.7 ± 13.7 mm s−1 (s.e.m.), both peak speed and range were very similar between the two groups. Not all subjects achieved higher closing speeds when compared with opening: four subjects, all with ptosis, had faster opening of the upper eyelid—all within the first 50 ms after opening phase was initiated.
The analysis in this study showed a significant separation in PA between the control subjects of age greater than or equal to 40 and those less than 40. Recognizing that age is a factor statistically, the ptosis group was compared with the control with subjects aged greater than or equal to 40. Using some of the key features of the blinking profile, PA versus time curves were reconstructed for each subject. A model was generated using these data and was able to discriminate ptosis from a set of data with good accuracy.
An additional seven subjects (14 eyes) were used to test the model's robustness and achieved 11/14 (80%) successful predictions, discriminating ptosis from controls. At present, this model is not sensitive to traumatic ptosis, nor is it sensitive to weakness and atrophy of ocular muscles from myopathies or paralysis. In future developments of this model, it would be beneficial to add more ptosis and control cases into the learning dataset and thereby improve accuracy.
Supplementary Material
Supplementary Material
Supplementary Material
Acknowledgements
Staff from Moorfields Eye Hospital were gratefully acknowledged for their help and support. The authors wish to thank the Engineering and Physical Sciences Research Council, UK for providing the Phantom camera for this work. The generous help of Adrian Walker of the Instrument Loan Pool is gratefully acknowledged. The authors thank Dr Maryam Parhizkar for her help with the high-speed camera. In addition, thanks are due to the staff of Moorfields NIHR clinical research facility and to Mr Ed White for extending the facilities to undertake this work.
Ethics
The study received local ethical approval.
Competing interests
We declare we have no competing interests.
Funding
This work benefitted from the financial support from UCL (IMPACT Studentship) and Moorfields Eye Hospital NHS Foundation Trust. D.G.E. and G.E.R. acknowledge Department of Health funding through the National Institute for Health Research to Moorfields Eye Hospital NHS Foundation Trust and UCL Institute of Ophthalmology for a Specialist Biomedical Research Centre for Ophthalmology.
References
- 1.Sudhakar P, Vu Q, Kosoko-Lasaki O, Palmer M. 2009. Upper eyelid ptosis revisited. Am. J. Clin. Med. 6, 5–14. [Google Scholar]
- 2.Le TT, Farkas LG, Ngim RCK, Levin LS, Forrest CR. 2002. Proportionality in Asian and North American Caucasian faces using neoclassical facial canons as criteria. Aesthetic Plastic Surgery 26, 64–69. ( 10.1007/s00266-001-0033-7) [DOI] [PubMed] [Google Scholar]
- 3.Dortzbach RK, Sutula FC. 1980. Involutional belpharoptosis. A histological study. Arch. Ophthalmol. 98, 2045–2049. ( 10.1001/archopht.1980.01020040897022) [DOI] [PubMed] [Google Scholar]
- 4.Fujiwara T, Matsuo K, Kondoh S, Yuzuriha S. 2001. Etiology and pathogenesis of aponeurotic blepharoptosis. Ann. Plast. Surg. 46, 29–35. ( 10.1097/00000637-200101000-00006) [DOI] [PubMed] [Google Scholar]
- 5.Paris GL, Quickert MH. 1976. Disinsertion of the aponeurosis of the levator palpebrae superioris muscle after cataract extraction. Am. J. Ophthalmol. 81, 337–340. ( 10.1016/0002-9394(76)90250-6) [DOI] [PubMed] [Google Scholar]
- 6.Orchard L, Stern J. 1991. Blinks as an index of cognitive activity during reading. Integr. Physiol. Behav. Sci. 26, 108–116. ( 10.1007/BF02691032) [DOI] [PubMed] [Google Scholar]
- 7.Radlak K, Smolka B. 2012. A novel approach to the eye movement analysis using a high speed camera. In 2nd Int. Conf. on Advances in Computational Tools for Engineering Applications (ACTEA'12), Zouk-Mosbeh, Lebanon, pp. 139–144. Piscataway, NJ: IEEE. [Google Scholar]
- 8.Castro F. 2008. Class I infrared eye blinking detector. Sensors Actuators A: Phys. 148, 145–150. ( 10.1016/j.sna.2008.09.005) [DOI] [Google Scholar]
- 9.Evinger C, Manning K, Sibony P. 1991. Eyelid movements: mechanisms and normal data. Investig. Ophthalmol. Vis. Sci. 32, 384–400. [PubMed] [Google Scholar]
- 10.Korošec M, Zidar I, Reits D, Evinger C, VanderWerf F. 2006. Eyelid movements during blinking in patients with Parkinson's disease. Mov. Disorder 21, 1248–1251. ( 10.1002/mds.20930) [DOI] [PubMed] [Google Scholar]
- 11.Sun W, Barker J, Chuke J, Rouholiman B, Hasan S, Gaza W, Stava MW, Porter JD. 1997. Age-related changes in human blinks. Investig. Ophthalmol. Vis. Sci. 38, 92–99. [PubMed] [Google Scholar]
- 12.VanderWerf F, Brassinga P, Reits D, Aramideh M, de Visser B. 2003. Eyelid movements: behavioural studies of blinking in humans under different stimulus conditions. J. Neurophysiol. 89, 2784–2796. ( 10.1152/jn.00557.2002) [DOI] [PubMed] [Google Scholar]
- 13.Kwon KA, Shipley R, Edirisinghe M, Ezra D, Rose G, Best S, Cameron RE. 2013. High-speed camera characterization of voluntary eye blinking kinematics. J. R. Soc Interface 10, 20130227 ( 10.1098/rsif.2013.0227) [DOI] [PMC free article] [PubMed] [Google Scholar]
- 14.Fox SA. 1976. Ophthalmic plastic surgery, 5th edn New York, NY: Grune & Stratton. [Google Scholar]
- 15.Nerad JA. 2010. Techniques in ophthalmologic plastic surgery, 1st edn Philadelphia, PA: Saunders Elsevier. [Google Scholar]
- 16.Salouti R, Nowroozzadeh M, Zamani M, Salouti R. 2009. Comparison of horizontal corneal diameter measurements using Galilei, Eyesys and Orbscan II systems. Clin. Exp. Optometry 92, 429–433. ( 10.1111/j.1444-0938.2009.00407.x) [DOI] [PubMed] [Google Scholar]
- 17.Bishop C. 2006. Discriminant functions. Pattern recognition and machine learning, pp. 186–192. New York, NY: Springer International Edition. [Google Scholar]
- 18.Porter J, Burns L, May P. 1989. Morphological substrate for eyelid movements: innervation and structure of primate levator palpebrae superioris and orbicularis oculi muscles. J. Comp. Neurol. 287, 64–81. ( 10.1002/cne.902870106) [DOI] [PubMed] [Google Scholar]
- 19.Harrison A, Anderson B, Thompson L, McLoon L. 2007. Myofiber length and three-dimensional localization of NMJs in normal and botulinum toxin treated adult extraocular muscles. Investig. Ophthalmol. Vis. Sci. 48, 3594–3601. ( 10.1167/iovs.06-1239) [DOI] [PMC free article] [PubMed] [Google Scholar]
Associated Data
This section collects any data citations, data availability statements, or supplementary materials included in this article.