

Abstract
Purpose of review
Many studies have reported that individuals with autism spectrum disorder (ASD) have different brain connectivity patterns compared to typically developing individuals. However, the results of more recent studies do not unanimously support the traditional view in which individuals with ASD have lower connectivity between distal brain regions and increased connectivity within proximal brain regions. In this review, we discuss different methods for measuring brain connectivity and how the use of different metrics may contribute to the lack of convergence of investigations of connectivity in ASD.
Recent findings
The discrepancy in brain connectivity results across studies may be due to important methodological factors such as the connectivity measure applied, the age of patients studied, the brain region(s) examined, and the time interval and frequency band(s) in which connectivity was analyzed.
Summary
We conclude that more sophisticated EEG analytic approaches should be utilized to more accurately infer causation and directionality of information transfer between brain regions, which may show dynamic changes of functional connectivity in the brain. Moreover, further investigations of connectivity with respect to behavior and clinical phenotype are needed to probe underlying brain networks implicated in core deficits of ASD.
Keywords: Brain Connectivity, Autism Spectrum Disorder, Graph Theory
2. Introduction
Autism spectrum disorder (ASD) is a neurodevelopmental disorder featuring deficits in social communication and language acquisition, as well as restricted interests and repetitive behaviors [1]. Much research has attempted to understand the neural underpinnings of ASD by the identification of biomarkers (i.e., objectively measured biological markers that indicate risk for autism [2]) that relate to its core deficits. Measures of brain connectivity are promising ASD biomarkers [3], yet a plethora of methods for extracting and delineating brain networks from recordings of functional brain activity exist.
Why connectivity? Brain connectivity measures infer which brain regions are physically or functionally connected to form brain networks that subserve either cognitive/behavioral task performance or the brain’s resting/default state [12]. While hundreds of genes convey risk for ASD [4], many of these genes notably converge on synaptic pathways [5–10]. On a microscopic level, this convergence underscores synaptic connectivity as a potential neurobiological mechanism of ASD; however, on a macroscopic level, it points towards axonal or functional connectivity patterns as a plausible biomarker for ASD. The number of publications with the keywords ‘brain connectivity’ has grown exponentially over the past 30 years (1985 – 2015, Fig. 1) [13], whereas the number of publications for ‘brain imaging’ has grown almost linearly over the same period. The exponential explosion in brain connectivity publications underscores the importance of this new field in understanding the brain as an integrated system.
Figure 1. Exponential growth of Scopus hits for brain connectivity.
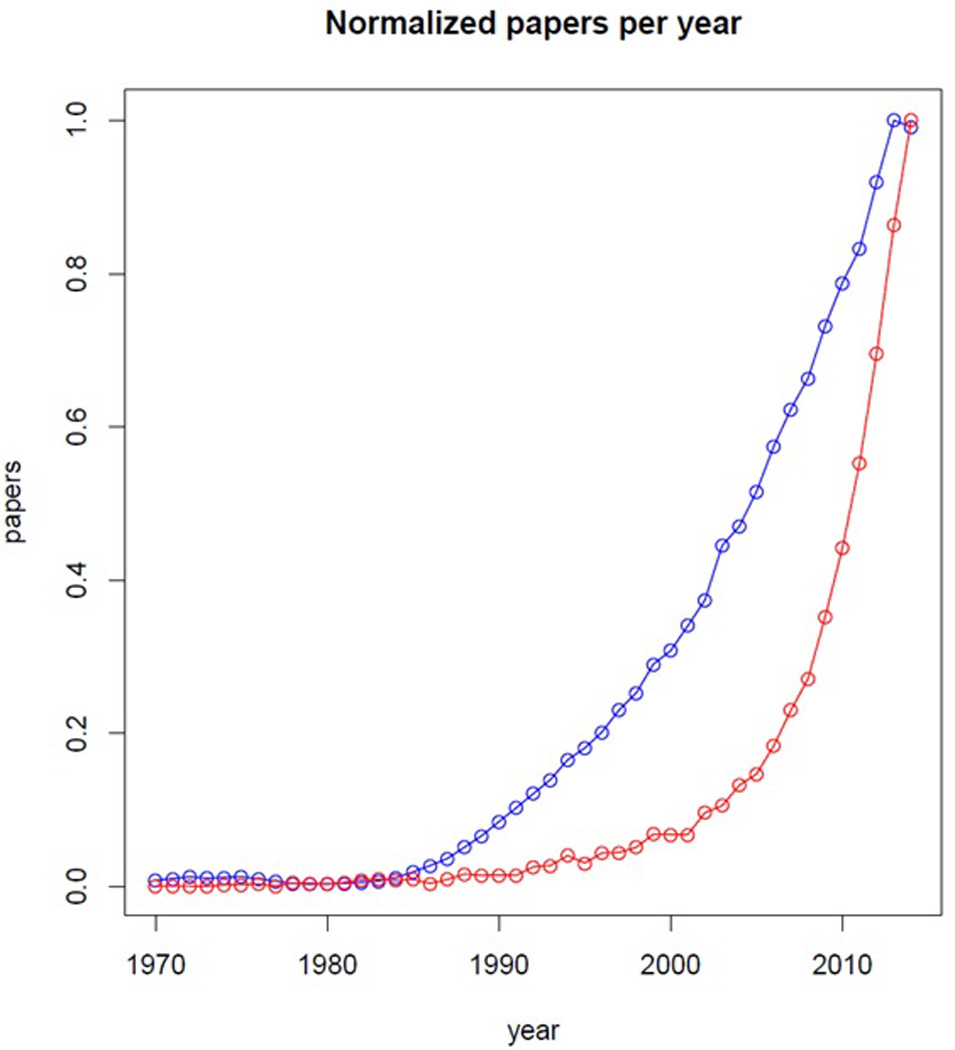
Comparison of hits for “brain connectivity” (red) and “brain imaging” (blue) by year (abscissa) for 1970 – 2014 from academic search engine Scopus (date of search 11/06/15). Number of papers (ordinate) is normalized showing both traces on the same scale, thus emphasizing style of growth rather than raw number of papers. Both fields of research show approximately constant publication output until 1985, after which publications for brain connectivity show exponential growth as compared with almost linear growth for brain imaging publications. One can attribute the exponential growth in brain connectivity publications as a push against the functional segregation approach of traditional brain imaging, replacing such approaches with an integrated understanding of the brain as a distributed network.
Published studies on brain connectivity in ASD yield inconsistent results, not only because of the use of different imaging modalities and techniques for (re)constructing brain networks but also because of the challenges inherent in the selection of appropriate methods for delineating brain networks to test a given hypothesis. Additionally, choosing a proper neuroimaging technique that suits a clinical cohort may avoid detrimental filtration of the sample, i.e., omitting low functioning individuals with severe cognitively impairments who yield noisy data or outliers for a given brain connectivity technique. For example, in cohorts with ASD, motor stereotypies and cognitive level must be taken into account when considering imaging techniques that are sensitive to motion artifacts or require the participant to lie motionless for a long period of time.
This following is not meant to be an exhaustive review on the literature; rather, we provide a critical review of the specific methods used to capture brain connectivity, methods that quantify the delicate balance between functional segregation and integration of neuronal circuits. We discuss how different brain connectivity approaches can lead to divergent results—even when applied to the same data. We conclude with general recommendations for connectivity measures that are most promising—in terms of feasibility, robustness, and sensitivity—for studying individuals with ASD.
3. Overview of brain connectivity approaches
Brain connectivity approaches can be categorized as structural or functional. Within functional connectivity, methods that infer causality and directionality of information transfer are considered effective connectivity.
In structural brain connectivity approaches, regions of the brain are considered to be connected if there are anatomical (white matter) connections between distinct brain regions. Structural connectivity may vary across development and can be used as an index of brain plasticity.
In functional connectivity approaches, the interdependency among activities of different brain areas is measured using statistical methods such as correlation, covariance, phase coherence, and phase locking. These methods characterize the strength of the relationship (e.g., correlation) but not the direction of information flow or causality. Functional connectivity can illustrate the integration and segregation of brain networks in much finer temporal resolution than structural connectivity methods.
Effective connectivity examines interactions—inferred to be casual—between nodes of brain networks while showing directionality of information transfer. Common approaches to measure effective connectivity are Granger Causality and its derivatives, as well as Phase Slope Index.
Diffusion MRI and diffusion tensor imaging (DTI) represent methods for mapping structural connectivity that characterize anatomical fibers within brain networks. Both methods are sensitive to the diffusion of water molecules along axon fibers [14]. Delineation of functional brain networks is arguably less straightforward than that of structural brain networks, as statistical dependencies are far less concrete than anatomical fibers. Functional networks may be obtained by utilizing hemodynamic imaging techniques such as functional magnetic resonance imaging (fMRI) or other measures of brain activity such as electroencephalography (EEG) and magnetoencephalography (MEG). EEG and MEG signals reflect approximate measures of postsynaptic pyramidal cell activity with millisecond temporal resolution ideal for describing brain dynamics. However, the spatial resolution of both methods is poor compared to MRI, even though this limitation can be partially compensated using advanced signal processing analytic techniques. The spatial resolution of MEG exceeds that of EEG owing to the fact that magnetic fields are less distorted by the skull and scalp than electric fields [15].
3-1. Brain imaging techniques for Connectivity Analysis
Choice of an appropriate non-invasive in vivo neuroimaging technique for delineating brain networks depends on the clinical population of interest and the type of connectivity to be analyzed. In the context of neurodevelopmental disorders such as ASD, the developmental level of the individual is also an important consideration.
Although many studies use fMRI to study task-related and resting state functional connectivity, EEG/MEG are preferable for describing functional and effective connectivity due to their rich temporal dynamics. Both fMRI [16] and MEG [17] are highly sensitive to motion artifacts, making both techniques largely impractical for young children and/or children with repetitive, stereotyped behaviors. Other MRI techniques used for mapping structural connectivity, such as diffusion MRI and DTI, share this limitation.
3-2. Characterizing the brain network’s nodes and edges
One of the most commonly used approaches for characterizing a network and its components is graph theory. In the parlance of graph theory, brain regions or recording sensors (e.g., voxels or electrodes) are treated as the network’s nodes and the connections between those nodes are the edges of the network. The most straightforward approach to choosing network nodes is to use sensor location as nodes. However, signals in sensor-space may exhibit spurious functional and effective connectivity due to volume conduction. Volume conduction is a phenomenon whereby electrical signals are spread out widely as they travel through brain tissue and spatially smeared by the skull, like a narrow point of light viewed through frosted glass. As a result of volume conduction, spatial relationships measured from the scalp may not represent true neural connectivity but rather artifacts of volume conduction. Spatial filters [18] such as current source density (CSD)—the second spatial derivative (Laplacian transformation) of sensor-space recordings [19]—have been introduced by researchers to deal with the volume conductance issue (Fig. 2). Alternatively, by using an inverse model approach such as such standardized low resolution brain electromagnetic tomography (sLORETA), beamforming, and independent components analysis (ICA) for dipole localization, spatial locations of “cortical activity” sources can be estimated and considered as the nodes of the network [22].
Figure 2. Example of volume conductance of a dipolar cortical source.
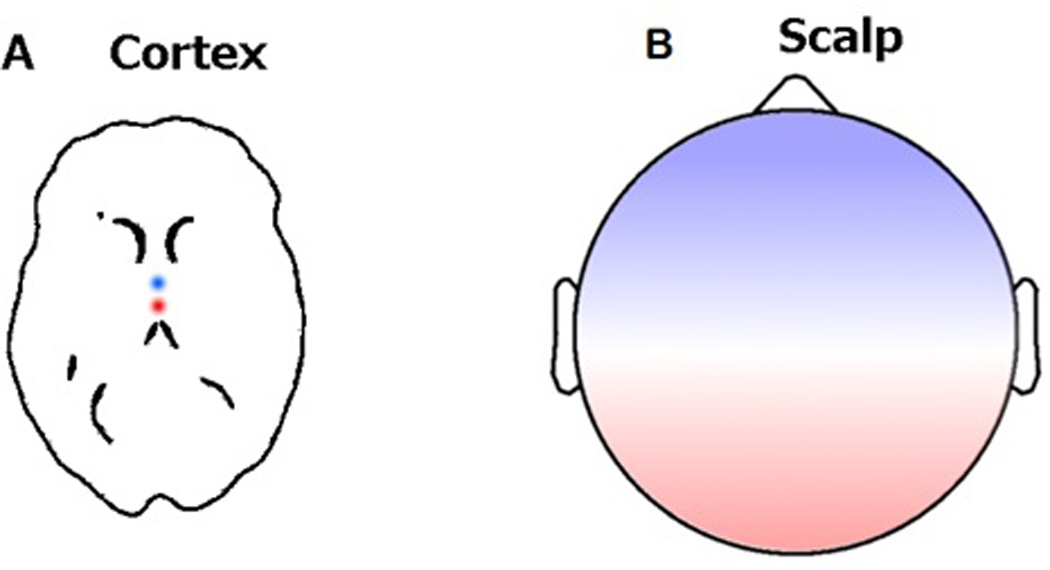
A neural generator modeled as a dipolar source in the cortex (A) and its back projection onto the scalp (B). Because of the volume conductance issue, one may incorrectly conclude that the polarity in the frontal and occipital regions in the scalp map are from different dipolar sources if only the scalp potential map is being used.
3-3. Choosing Network Edges - Measures of Connectivity
The existence or strength of a network’s edges is an important factor when studying brain connectivity. Here, we discuss different methods to quantify edges commonly used in functional and effective connectivity approaches:
Time-Lag measures: The simplest time-lagged measure is cross-correlation, which is the degree of similarity between activation of one brain region with a shifted (time-lagged) activation of another region. This measure can estimate the neural processing delay between two regions. For example, when measuring cross-correlation between brain areas A and B, if the time lag is 500 ms, the cross correlation will represent the degree of similarity between activity in area A at 0 ms and activity in area B 500 ms later.
Coherence: This is a measure of synchronization between two signals of the same frequency, and it quantifies the extent to which they share a constant oscillating frequency and phase difference. For instance, two signals that are oscillating at the same frequency f0 may have a phase difference value ranging anywhere from zero (in-phase) to 180 degrees (anti-phase). In this case, they have a magnitude coherence value of 1 because they share the same oscillation frequency f0; however, their phase coherence value may vary from 0 to 1 for anti-phase to in-phase, respectively (Fig. 3). In theory, neuronal ensembles oscillate coherently to share information [20].
Causality: While true causal relationships cannot be extracted from EEG or MEG recordings without applying electrical or magnetic stimulation [12], Granger Causality (GC) is a weaker notion of causality: at frequency f0, if past values of one brain recording ‘A’ help to predict future values of brain recording ‘B’ beyond what can be inferred from past values of recording B alone, then (according to GC), ‘A’ has a Granger causal effect on ‘B’. While not true causality, GC is useful for inferring directionality of neural information transfer [19].
The methods mentioned above can be applied to data from many neuroimaging modalities including fMRI, MEG, and EEG. However, it should be noted that the accuracy of determining coherence or GC at frequency f0 depends on the length of data. For example, to investigate low frequencies, longer recording time is required. Therefore, choice of frequency band plays a critical role in the interpretation of connectivity data, as will be discussed in later sections.
Figure 3. Magnitude versus Phase coherence.

The magnitude (or power) value (bottom left) and phase value (bottom right) of coherence for two artificial signals (top) x(t) = sin(Ωt) and y(t)= sin(Ωt+45°) where Ω=2πf and f=10Hz. The peak can be seen at 10Hz for the magnitude values and at 45° for phase value of coherence.
3-4. Graph theory measures
How does one summarize connectivity in a network with hundreds to thousands of edges? Edges weaker than a certain threshold strength are often eliminated to create a pruned network/graph. Next, the architecture of the network is described using graph theory measures, several of which are described below and illustrated in Figure 4.
Figure 4. Examples of three network architectures described by graph theory.
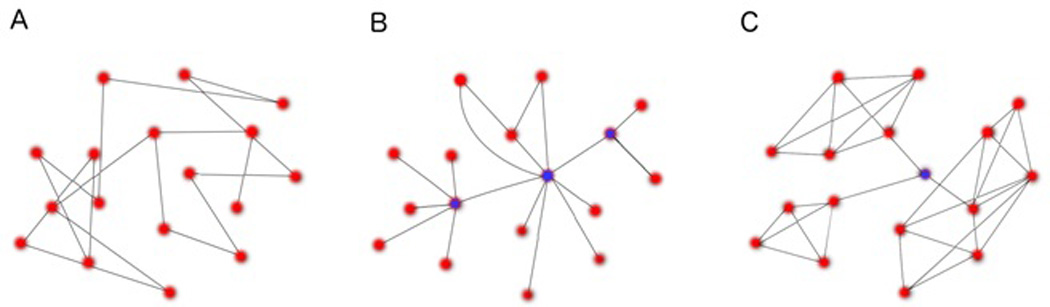
(A) An inefficient network with large path length and small clustering coefficient. Note that a metaphorical walk from one arbitrary node to another will take many more steps than the network in (B) owing to the lack of hub nodes in (A), i.e., nodes connected to many neighbors that facilitate quick trips across the network. (B) A small-world network with small path length and small clustering coefficient. Hub nodes (blue) greatly reduce the path length and increase the efficiency of the network, such that all nodes are connected by a small number of steps. (C) A highly modular small-world network with small path length and large clustering coefficient. Like (B), this network is highly efficient, but also more integrated owing to the larger proportion of realized edges (i.e., higher clustering coefficient) creating densely interconnected modules or sub-networks linked by a central hub node (blue).
Small-worldness
This refers to the property by which any two nodes in a network are connected by a small number of steps or ‘hops’ (Fig. 4). For instance, consider a global network of airports where any given city can be reached by three or fewer connecting flights. Such a network has small-world properties. As a result, within the brain’s small-world network, the information flow is highly efficient with minimal serial-synaptic conduction delay. Small-world networks are also more robust to deletion of random nodes or damage to the network.
Path length
The efficiency of a network is related to the path length, or the average number of edges between any two nodes, which is minimal for small-world networks (Fig. 4). For instance, social networks are said to have a path length of 6, meaning any two people in the world know each other through 6 series of acquaintances.
Modularity
Also relevant to efficiency and small-worldness, this term describes the tendency for nodes to form hierarchical and recursive clusters within clusters (Fig. 4). Closely related is the clustering coefficient, a measure of local interconnectedness or “cliquishness,” which reflects the degree to which clustering occurs around an average node.
4. Brain connectivity findings in Autism Spectrum Disorders
Considering the growing interest in brain connectivity in ASD (Fig. 1), a reasonable skeptic might ask if many of these studies are largely the product of a bandwagon effect. However, given the growing insights gained from autism genetics, with many pathways converging on synaptic function and structure, efforts to characterize connectivity in ASD hold biological validity. ASD can be better understood through the lens of network science, which may elucidate the role of genetic factors, clinical characteristics, and phenotypic heterogeneity.
4-1. Brain Connectivity and Genetics in ASD
Many potential autism risk genes regulate synaptic connectivity, with mutations leading to microscopic neuronal dysconnectivity [5–10]. The concordance rate for ASD between monozygotic twins is 77% for male twins and 50% for female twins [21], suggesting genetic risk patterns with strong but not absolute penetrance. Intermediate phenotypes of ASD should show similar levels of heritability and genetic influence. An analysis of small-world resting-state electroencephalogram (EEG) functional networks from twins and siblings computed with synchronization likelihood (a method which can deal with non-stationary dynamics of EEG data) has found that 37–62% of differences in path length are heritable [22]. Clustering coefficient showed similar genetic influence, with 46–89% of individual differences found to be heritable. The high heritability of these small-world parameters opens them to future consideration as ASD or ASD-risk endophenotypes. However, it should also be noted that many inherited and de novo ASD risk genes converge on synapses [4,8,23–26]. Thus, heritable brain networks—while promising as risk biomarkers—are incomplete endophenotypes of ASD risk and, moreover, agnostic with respect to specific genetic factors.
4-2. Long range vs. short range connectivity in adults with ASD
Results from studies of connectivity in ASD are variable, largely due to discrepancies in (1) the experiment and its cognitive or behavioral components, (2) the type of functional brain data (e.g., EEG, MEG, or fMRI), (3) the age of patients examined, (4) the anatomical region(s) examined, and (5) the time interval and frequency band(s) in which connectivity was analyzed. Considerable focus has been placed on long vs. short range connectivity patterns. Several fMRI studies support the prevailing notion that individuals with ASD have lower connectivity (or hypo-connectivity) between distant brain regions (such as the frontal and parietal lobes) and increased connectivity (or hyper-connectivity) between local brain regions (such as within the frontal lobe) [27–29]. Contrary to these findings, recent studies of neural connectivity with higher temporal resolution using EEG/MEG do not support this notion. For example, Khan et al [30] examined event-related MEG recordings from male young adults and adolescents with ASD and an age-matched control group of TD individuals during a face-viewing task. Source-localized signals in fusiform face area (FFA) were used as a seed-region, with local connectivity measured by phase-amplitude coupling—the strength of the relationship between the phase of oscillations in the alpha band (i.e., 8 to 12Hz) and the amplitude of oscillations in the gamma band (above 40Hz)—and long-range connectivity measured as coherence between FFA and other regions. Contrary to prior findings [27–29], Khan et al found significantly reduced local and long-range connectivity in cohort with ASD as compared with controls. For long-range connectivity, this difference was significant in alpha band coherence. Not only did participants with ASD feature hypo—rather than hyper—connectivity at the local scale, but moreover, reduced local connectivity correlated with the social component of the autism diagnostic observation schedule (ADOS) in this cohort.
In addition to alpha band coherence, differences in functional connectivity between ASD and TD controls have been found in other frequency bands. For example, a study by Barttfeld et al [31] supported the traditional view of local hyper-connectivity in ASD during resting-state EEG recordings from high functioning adults with ASD. Specifically, they found enhanced local, lateral frontal connections accompanied by reduced long range fronto-frontal and fronto-occipital connections as measured with delta (0.5 – 3.5 Hz) band synchronization likelihood. Furthermore, Barttfeld et al demonstrated that EEG networks from cohort with ASD featured lower clustering coefficient and higher path length as compared with an age- and gender- matched TD cohort. While this study only examined the delta band, the functional and/or mechanistic significance of delta oscillations in ASD remains unclear a priori, though delta band coherence abnormalities have also been found in REM sleep EEG recordings from young adults with ASD [32].
It is important to note that analyzing low frequency oscillations—such as delta oscillations or default mode network (DMN)—requires longer temporal segments of EEG recordings (at least twice the duration of the period of the slowest oscillation). This caveat alone may lead to inaccuracy of connectivity estimation due to the non-stationarity, i.e., the fact that statistical properties of the signal (such as its mean and variance) change over the temporal interval of one segment (Fig. 5).
Figure 5. Stationarity versus Non-stationary EEG signals.
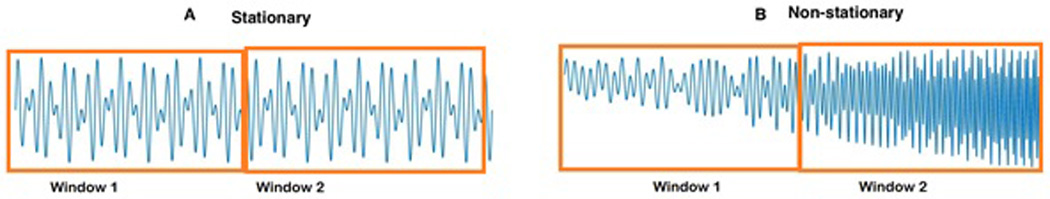
A stationary process is one whose statistical properties (such as its average, standard deviation, etc.) do not change over different time windows. For example, in panel A, the average oscillation frequency and standard deviation values are the same for both time windows 1 and 2. However, it is obvious these values are not the same for panel B in time windows 1 and 2.
Thus, studying connectivity mediated by relatively fast oscillations may be more accurate. For example, alpha oscillations, which are associated with restful focus and may relate to the ability of an individual to concentrate his or her focus while habituating to distracting stimuli [33,34], may be an ideal frequency band for computing functional connectivity. It has been shown that the coherence at alpha oscillations measured over right centro-parietal regions is inversely related to the tendency for adults with ASD to notice and process details [35]. Furthermore, in resting-state eyes-closed recordings, adults with ASD also have globally reduced alpha coherence in frontal networks as compared to TD adults [36]. Interestingly, the same study showed that the coherence of theta oscillations—which play a similar role as alpha in executive function and working memory [34,37]—are locally enhanced in left frontal and temporal regions in adults with ASD [36]. Thus, proper frequency ranges should be chosen while studying short or long range brain connectivity patterns.
4-3. Relating connectivity to clinical phenotypes and circuit dysfunction
Ultimately, future work along these lines relating connectivity differences to clinical phenotypes rather than broad diagnosis may be beneficial for stratifying this very heterogeneous disorder into more homogeneous subpopulations. Very few studies have correlated EEG or MEG connectivity metrics with behavioral symptoms or clinical phenotypes in ASD. In addition to the previously mentioned Khan et al study which correlated ADOS scores with local connectivity from a face processing task [30], Grice et al used evoked (for early sensory processing and local feature processing) and induced (for later configurational feature and top-down processing) gamma band coherence from EEG recording in adults with ASD to compare frontal connectivity in a face processing paradigm using upright faces and inverted faces as stimuli [38]. No significant change in induced/evoked gamma band coherence between frontal electrodes was reported for cohort with ASD, whereas TD adults showed greater induced gamma coherence for upright faces. In addition, they found no modulation of the gamma response compared to controls when the faces were inverted. This lack of sensitivity to the face inversion in the ASD group may represent deficits in the integration and information binding of local features during face processing. Similar work in the future may be beneficial for probing neural circuits implicated in core behaviors implicated in ASD. Therefore, choice of experimental task, latency of specific sensory/cognitive processes, frequencies of interest, and network features (nodes and edges) are important factors in quantifying and interpreting brain connectivity patterns and, consequently, classifying ASD into biologically relevant subgroups.
4-4. Connectivity as an ASD risk marker in early and middle development stages
Brain connectivity may have potential as a risk marker for ASD in early and development stages. Of paramount interest to clinicians are connectivity measures that can (1) identify ASD risk early in development prior to diagnosis or (2) inform prognosis of children with ASD. Given our understanding of the convergence of genetic risk factors on synaptic pathways, one could postulate that aberrant neuronal connectivity should be able to be quantified in early infancy. Recently, Orekhova et. al [39] analyzed functional brain connectivity by phase lag index in 14-month-old infants at high and low risk for ASD using EEG while infants attended to videos. At 36 months, the high-risk infants were assessed for symptoms of ASD. High-risk infants who were later diagnosed with ASD featured higher functional connectivity as compared to both low-risk infants and high-risk infants who did not meet criteria for ASD. The degree of hyper-connectivity in frontal regions at 14 months strongly correlated with the severity of restricted and repetitive behaviors in participants later diagnosed with ASD at 3 years. Another large study of sleep EEG recorded from 106 children with ASD and 70 TD controls ages 2 – 6 years identified distinct differences in coherence across different frequency bands in slow wave sleep [40].
A smaller study of 20 older children with ASD (ages 6 – 11 years) and 20 controls matched for age, IQ, and gender[41] identified distinct patterns of EEG coherence across multiple frequency bands in eyes-closed resting recordings, both within and between hemispheres. Relative to controls, children with ASD exhibited a pattern of hypo-connectivity, which included decreased intrahemispheric delta and theta coherences across short to long inter-electrode distances. Additionally, delta and theta coherences in the ASD group were low across the frontal region, interhemispherically.
However, these studies did not explicitly address concerns regarding multiple comparisons, spurious connectivity due to volume conductance, or non-stationarity in long EEG recording segments. Collectively, these studies suggest that brain connectivity may index risk for ASD diagnosis or altered developmental trajectory. However, careful consideration should be given to the selection of the appropriate brain connectivity method and important methodological factors that may confound results.
5. Conclusion
While many studies have identified differences in functional connectivity with EEG/MEG between individuals with ASD and TD individuals, more studies that investigate and identify such differences in early development as markers of ASD risk are greatly needed. There are few longitudinal studies of EEG/MEG connectivity in infants or young children with ASD. Moreover, further investigations of connectivity with respect to behavior and clinical phenotype are needed to probe underlying brain networks implicated in core deficits of ASD. Considering that the theoretical basis for studying connectivity in ASD is rooted in ASD risk genes pointing towards synaptic dysfunction [5–10], we recommend investigations of EEG functional connectivity in relation to single nucleotide polymorphisms (SNPs), copy number variants (CNVs), or other genotypic measures.
The vast majority of studies reviewed here have relied on coherence to measure EEG functional connectivity. Coherence is a linear measure of connectivity that is based on similarity of activations in different regions while not taking into account non-stationarity or directionality of information transfer. Additionally, volume conductance, especially between spatially adjacent recording electrodes, may lead to spurious connectivity and misinterpretation of results. For these reasons, we recommend that future studies compare cross-correlation or coherence to more sophisticated measures of connectivity, such as synchronization likelihood, which takes into account non-stationarity [42–44], or effective connectivity measures such as Granger Causality [45,46], which infers causation and directionality of information transfer. In addition, the above methods can be applied to data obtained from source localization methods rather than channel space data to eliminate the volume conductance problem [22]. In Table 1, we summarize and compare some frequently used functional/effective connectivity methods.
Table 1.
Summary of functional and effective connectivity measures
| Methods | Pros | Cons | Recommended applications |
Relevant findings |
|---|---|---|---|---|
| Cross-correlation |
|
|
|
Several fMRI studies support the notion that individuals with ASD have lower connectivity between distal brain regions and increased connectivity within proximal brain regions (such as within the frontal lobe) [27– 29] |
| Coherence |
|
|
|
|
| Granger causality (GC) and Directed Transfer Function (DTF) methods |
|
|
|
|
| Synchronization likelihood (SL) |
|
|
|
|
| Phase-amplitude coupling(PAC) |
|
|
|
|
| Phase lag index (PLI) |
|
|
|
Early hyper- connectivity in the alpha frequency range has been observed using PLI which can be an important feature of the ASD neurophysiological phenotype [39] |
Finally, dynamic changes in functional connectivity patterns have yet to be deeply investigated. The tendency of the brain to become “stuck” (versus flexibly adaptive) in a redundant pattern of functional connectivity may relate to motor and cognitive systems [50] in ASD which are also “stuck” in a series of repetitive behaviors or restricted interests, respectively. In this way, cortical and sub-cortical dynamics of coordinated activity lead to generation of inflexible brain connectivity patterns which may relate to core deficits of ASD such as repetitive behaviors [51]. In conclusion, cutting-edge methodologies sensitive to nonlinear and/or causal relationships drawn from multiple recording modalities may be fruitful for discovering risk and outcome markers of ASD.
Key Points.
Individuals with autism spectrum disorder (ASD) have different brain connectivity patterns compared to typically developing individuals.
There are discrepancies in brain connectivity results across studies that may be due to important methodological factors such as the type of connectivity measure used, the age of patients studied, the brain region(s) examined, and the time interval and frequency band(s) in which connectivity was analyzed.
We recommend that future studies compare cross-correlation or coherence to sophisticated measures of connectivity to determine whether the results converge.
Acknowledgments
The authors would like to thank Dr. Amaya Miquelajauregui and Xuan Tran for their insightful comments.
Financial support and sponsorship
None.
Footnotes
Conflicts of interest
The authors have no conflicts of interest.
References
Papers of particular interest, published within the annual period of review, have been highlighted as
* of special interest
** of outstanding interest
- 1.Association AP. Diagnostic and Statistical Manual of Mental Disorders:: DSM-5. ManMag; 2003. [Google Scholar]
- 2.Colburn W, DeGruttola VG, DeMets DL, Downing GJ, Hoth DF, Oates JA, Peck CC, Schooley RT, Spilker BA, Woodcock J. Biomarkers and surrogate endpoints: Preferred definitions and conceptual framework. Biomarkers Definitions Working Group. Clinical Pharmacol & Therapeutics. 2001;69:89–95. doi: 10.1067/mcp.2001.113989. [DOI] [PubMed] [Google Scholar]
- 3.Jeste SS, Frohlich J, Loo SK. CURRENT OPINION Electrophysiological biomarkers of diagnosis and outcome in neurodevelopmental disorders. Curr Opin Neurol. 2015;28:000–000. doi: 10.1097/WCO.0000000000000181. [DOI] [PMC free article] [PubMed] [Google Scholar]
- 4.Iossifov I, O’Roak BJ, Sanders SJ, Ronemus M, Krumm N, Levy D, Stessman HA, Witherspoon KT, Vives L, Patterson KE. The contribution of de novo coding mutations to autism spectrum disorder. Nature. 2014;515:216–221. doi: 10.1038/nature13908. [DOI] [PMC free article] [PubMed] [Google Scholar]
- 5.Durand CM, Betancur C, Boeckers TM, Bockmann J, Chaste P, Fauchereau F, Nygren G, Rastam M, Gillberg IC, Anckarsäter H. Mutations in the gene encoding the synaptic scaffolding protein SHANK3 are associated with autism spectrum disorders. Nature genetics. 2007;39:25–27. doi: 10.1038/ng1933. [DOI] [PMC free article] [PubMed] [Google Scholar]
- 6.Guilmatre A, Dubourg C, Mosca A-L, Legallic S, Goldenberg A, Drouin-Garraud V, Layet V, Rosier A, Briault S, Bonnet-Brilhault F. Recurrent rearrangements in synaptic and neurodevelopmental genes and shared biologic pathways in schizophrenia, autism, and mental retardation. Archives of general psychiatry. 2009;66:947–956. doi: 10.1001/archgenpsychiatry.2009.80. [DOI] [PMC free article] [PubMed] [Google Scholar]
- 7.Berkel S, Marshall CR, Weiss B, Howe J, Roeth R, Moog U, Endris V, Roberts W, Szatmari P, Pinto D. Mutations in the SHANK2 synaptic scaffolding gene in autism spectrum disorder and mental retardation. Nature genetics. 2010;42:489–491. doi: 10.1038/ng.589. [DOI] [PubMed] [Google Scholar]
- 8.Gilman SR, Iossifov I, Levy D, Ronemus M, Wigler M, Vitkup D. Rare de novo variants associated with autism implicate a large functional network of genes involved in formation and function of synapses. Neuron. 2011;70:898–907. doi: 10.1016/j.neuron.2011.05.021. [DOI] [PMC free article] [PubMed] [Google Scholar]
- 9. Chen JA, Peñagarikano O, Belgard TG, Swarup V, Geschwind DH. The Emerging Picture of Autism Spectrum Disorder: Genetics and Pathology. Annual Review of Pathology: Mechanisms of Disease. 2015;10:111–144. doi: 10.1146/annurev-pathol-012414-040405. This study points to an emerging convergence of autism spectrum by comcerning about the complex and etiologically heterogeneous of the disorder.
- 10.Ebrahimi-Fakhari D, Sahin M. Autism and the synapse: emerging mechanisms and mechanism-based therapies. Current opinion in neurology. 2015;28:91–102. doi: 10.1097/WCO.0000000000000186. [DOI] [PubMed] [Google Scholar]
- 11.Levisohn PM. The autism-epilepsy connection. Epilepsia. 2007;48:33–35. doi: 10.1111/j.1528-1167.2007.01399.x. [DOI] [PubMed] [Google Scholar]
- 12.Sporns O. Networks of the Brain. MIT press; 2011. [Google Scholar]
- 13.Scopus. Elsevier; 2015. [Google Scholar]
- 14.Le Bihan D, Mangin JF, Poupon C, Clark CA, Pappata S, Molko N, Chabriat H. Diffusion tensor imaging: concepts and applications. Journal of magnetic resonance imaging. 2001;13:534–546. doi: 10.1002/jmri.1076. [DOI] [PubMed] [Google Scholar]
- 15.Okada YC, Lahteenmäki A, Xu C. Experimental analysis of distortion of magnetoencephalography signals by the skull. Clinical neurophysiology. 1999;110:230–238. doi: 10.1016/s0013-4694(98)00099-6. [DOI] [PubMed] [Google Scholar]
- 16.Byars AW, Holland SK, Strawsburg RH, Bommer W, Dunn RS, Schmithorst VJ, Plante E. Practical aspects of conducting large-scale functional magnetic resonance imaging studies in children. Journal of Child Neurology. 2002;17:885–889. doi: 10.1177/08830738020170122201. [DOI] [PMC free article] [PubMed] [Google Scholar]
- 17.Marinkovic K, Cox B, Reid K, Halgren E. Head position in the MEG helmet affects the sensitivity to anterior sources. Neurology & clinical neurophysiology: NCN. 2004;2004:30. [PMC free article] [PubMed] [Google Scholar]
- 18.Srinivasan R, Winter WR, Ding J, Nunez PL. EEG and MEG coherence: measures of functional connectivity at distinct spatial scales of neocortical dynamics. Journal of neuroscience methods. 2007;166:41–52. doi: 10.1016/j.jneumeth.2007.06.026. [DOI] [PMC free article] [PubMed] [Google Scholar]
- 19. Coben R, Mohammad-Rezazadeh I, Cannon RL. Using quantitative and analytic EEG methods in the understanding of connectivity in autism spectrum disorders: a theory of mixed over-and under-connectivity. Frontiers in human neuroscience. 2014;8 doi: 10.3389/fnhum.2014.00045. This study compares the findings from MR-DTI, pairwise coherence, and Grancer causality using electroencehalography data on a patient with autism spectrum disorder.
- 20.Fries P. A mechanism for cognitive dynamics: neuronal communication through neuronal coherence. Trends in cognitive sciences. 2005;9:474–480. doi: 10.1016/j.tics.2005.08.011. [DOI] [PubMed] [Google Scholar]
- 21.Hallmayer J, Cleveland S, Torres A, et al. GEnetic heritability and shared environmental factors among twin pairs with autism. Archives of General Psychiatry. 2011;68:1095–1102. doi: 10.1001/archgenpsychiatry.2011.76. [DOI] [PMC free article] [PubMed] [Google Scholar]
- 22.Smit DJ, Stam CJ, Posthuma D, Boomsma DI, De Geus EJ. Heritability of “small-world” networks in the brain: a graph theoretical analysis of resting-state EEG functional connectivity. Human brain mapping. 2008;29:1368–1378. doi: 10.1002/hbm.20468. [DOI] [PMC free article] [PubMed] [Google Scholar]
- 23.Sebat J, Lakshmi B, Malhotra D, Troge J, Lese-Martin C, Walsh T, Yamrom B, Yoon S, Krasnitz A, Kendall J. Strong association of de novo copy number mutations with autism. Science. 2007;316:445–449. doi: 10.1126/science.1138659. [DOI] [PMC free article] [PubMed] [Google Scholar]
- 24.Neale BM, Kou Y, Liu L, Ma’Ayan A, Samocha KE, Sabo A, Lin C-F, Stevens C, Wang L-S, Makarov V. Patterns and rates of exonic de novo mutations in autism spectrum disorders. Nature. 2012;485:242–245. doi: 10.1038/nature11011. [DOI] [PMC free article] [PubMed] [Google Scholar]
- 25.O’Roak BJ, Vives L, Girirajan S, Karakoc E, Krumm N, Coe BP, Levy R, Ko A, Lee C, Smith JD. Sporadic autism exomes reveal a highly interconnected protein network of de novo mutations. Nature. 2012;485:246–250. doi: 10.1038/nature10989. [DOI] [PMC free article] [PubMed] [Google Scholar]
- 26.Sanders SJ, Murtha MT, Gupta AR, Murdoch JD, Raubeson MJ, Willsey AJ, Ercan-Sencicek AG, DiLullo NM, Parikshak NN, Stein JL. De novo mutations revealed by whole-exome sequencing are strongly associated with autism. Nature. 2012;485:237–241. doi: 10.1038/nature10945. [DOI] [PMC free article] [PubMed] [Google Scholar]
- 27.Vissers ME, Cohen MX, Geurts HM. Brain connectivity and high functioning autism: a promising path of research that needs refined models, methodological convergence, and stronger behavioral links. Neuroscience & Biobehavioral Reviews. 2012;36:604–625. doi: 10.1016/j.neubiorev.2011.09.003. [DOI] [PubMed] [Google Scholar]
- 28. Maximo JO, Cadena EJ, Kana RK. The implications of brain connectivity in the neuropsychology of autism. Neuropsychology review. 2014;24:16–31. doi: 10.1007/s11065-014-9250-0. This study shows how a multimodal brain connectivity approach may help to characterize the complex neurobiology of autism and lead to identification of biomarkers for autism.
- 29. Rane P, Cochran D, Hodge SM, Haselgrove C, Kennedy DN, Frazier JA. Connectivity in Autism: A Review of MRI Connectivity Studies. Harvard review of psychiatry. 2015;23:223–244. doi: 10.1097/HRP.0000000000000072. Very insightful review of the application of MRI in brain connectivity and autism.
- 30.Khan S, Gramfort A, Shetty NR, Kitzbichler MG, Ganesan S, Moran JM, Lee SM, Gabrieli JD, Tager-Flusberg HB, Joseph RM. Local and long-range functional connectivity is reduced in concert in autism spectrum disorders. Proceedings of the National Academy of Sciences. 2013;110:3107–3112. doi: 10.1073/pnas.1214533110. [DOI] [PMC free article] [PubMed] [Google Scholar]
- 31.Barttfeld P, Wicker B, Cukier S, Navarta S, Lew S, Sigman M. A big-world network in ASD: dynamical connectivity analysis reflects a deficit in long-range connections and an excess of short-range connections. Neuropsychologia. 2011;49:254–263. doi: 10.1016/j.neuropsychologia.2010.11.024. [DOI] [PubMed] [Google Scholar]
- 32.Léveillé C, Barbeau EB, Bolduc C, Limoges É, Berthiaume C, Chevrier É, Mottron L, Godbout R. Enhanced connectivity between visual cortex and other regions of the brain in autism: a REM sleep EEG coherence study. Autism Research. 2010;3:280–285. doi: 10.1002/aur.155. [DOI] [PubMed] [Google Scholar]
- 33.Klimesch W, Sauseng P, Hanslmayr S. EEG alpha oscillations: the inhibition–timing hypothesis. Brain research reviews. 2007;53:63–88. doi: 10.1016/j.brainresrev.2006.06.003. [DOI] [PubMed] [Google Scholar]
- 34.Sauseng P, Klimesch W, Schabus M, Doppelmayr M. Fronto-parietal EEG coherence in theta and upper alpha reflect central executive functions of working memory. International Journal of Psychophysiology. 2005;57:97–103. doi: 10.1016/j.ijpsycho.2005.03.018. [DOI] [PubMed] [Google Scholar]
- 35.Mathewson KJ, Jetha MK, Drmic IE, Bryson SE, Goldberg JO, Schmidt LA. Regional EEG alpha power, coherence, and behavioral symptomatology in autism spectrum disorder. Clinical Neurophysiology. 2012;123:1798–1809. doi: 10.1016/j.clinph.2012.02.061. [DOI] [PubMed] [Google Scholar]
- 36.Murias M, Webb SJ, Greenson J, Dawson G. Resting state cortical connectivity reflected in EEG coherence in individuals with autism. Biological psychiatry. 2007;62:270–273. doi: 10.1016/j.biopsych.2006.11.012. [DOI] [PMC free article] [PubMed] [Google Scholar]
- 37.Schack B, Klimesch W, Sauseng P. Phase synchronization between theta and upper alpha oscillations in a working memory task. International Journal of Psychophysiology. 2005;57:105–114. doi: 10.1016/j.ijpsycho.2005.03.016. [DOI] [PubMed] [Google Scholar]
- 38.Grice SJ, Spratling MW, Karmiloff-Smith A, Halit H, Csibra G, de Haan M, Johnson MH. Disordered visual processing and oscillatory brain activity in autism and Williams syndrome. Neuroreport. 2001;12:2697–2700. doi: 10.1097/00001756-200108280-00021. [DOI] [PubMed] [Google Scholar]
- 39. Orekhova EV, Elsabbagh M, Jones E, Dawson G, Charman T, Johnson MH, Team B. EEG hyper-connectivity in high-risk infants is associated with later autism. J. Neurodev. Disord. 2014;6:40. doi: 10.1186/1866-1955-6-40. In this study, functional brain connectivity in 14-month-old infants at high and low familial risk for ASD was analyzed using electroencephalography. The results show hyper-connectivity patterns in the alpha frequency range which can be an important feature of autism spectrum disorder phenotype.
- 40. Buckley AW, Scott R, Tyler A, Mahoney JM, Thurm A, Farmer C, Swedo S, Burroughs SA, Holmes GL. State-Dependent Differences in Functional Connectivity in Young Children With Autism Spectrum Disorder. EBioMedicine. 2015 doi: 10.1016/j.ebiom.2015.11.004. In this study, the importance of brain states (during sleep) when analyzing brain connectivity as a potential biomaker is investigated.
- 41.Coben R, Clarke AR, Hudspeth W, Barry RJ. EEG power and coherence in autistic spectrum disorder. Clinical Neurophysiology. 2008;119:1002–1009. doi: 10.1016/j.clinph.2008.01.013. [DOI] [PubMed] [Google Scholar]
- 42.Stam C, Van Dijk B. Synchronization likelihood: an unbiased measure of generalized synchronization in multivariate data sets. Physica D. Nonlinear Phenomena. 2002;163:236–251. [Google Scholar]
- 43.Stam CJ. Functional connectivity patterns of human magnetoencephalographic recordings: a ‘small-world’ network? Neuroscience letters. 2004;355:25–28. doi: 10.1016/j.neulet.2003.10.063. [DOI] [PubMed] [Google Scholar]
- 44.Montez T, Linkenkaer-Hansen K, Van Dijk B, Stam C. Synchronization likelihood with explicit time-frequency priors. Neuroimage. 2006;33:1117–1125. doi: 10.1016/j.neuroimage.2006.06.066. [DOI] [PubMed] [Google Scholar]
- 45.Granger CW. Some recent development in a concept of causality. Journal of econometrics. 1988;39:199–211. [Google Scholar]
- 46.Blinowska KJ, Kuś R, Kamiński M. Granger causality and information flow in multivariate processes. Physical Review E. 2004;70:050902. doi: 10.1103/PhysRevE.70.050902. [DOI] [PubMed] [Google Scholar]
- 47.Pollonini L, Patidar U, Situ N, Rezaie R, Papanicolaou AC, Zouridakis G. Engineering in Medicine and Biology Society (EMBC), 2010 Annual International Conference of the IEEE. IEEE; 2010. Functional connectivity networks in the autistic and healthy brain assessed using Granger causality; pp. 1730–1733. [DOI] [PubMed] [Google Scholar]
- 48.Hardmeier M, Hatz F, Bousleiman H, Schindler C, Stam CJ, Fuhr P. Reproducibility of functional connectivity and graph measures based on the phase lag index (PLI) and weighted phase lag index (wPLI) derived from high resolution EEG. 2014 doi: 10.1371/journal.pone.0108648. [DOI] [PMC free article] [PubMed] [Google Scholar]
- 49.Stam CJ, Nolte G, Daffertshofer A. Phase lag index: assessment of functional connectivity from multi channel EEG and MEG with diminished bias from common sources. Human brain mapping. 2007;28:1178–1193. doi: 10.1002/hbm.20346. [DOI] [PMC free article] [PubMed] [Google Scholar]
- 50.Rabinovich MI, Simmons AN, Varona P. Dynamical bridge between brain and mind. Trends in cognitive sciences. 2015;19:453–461. doi: 10.1016/j.tics.2015.06.005. [DOI] [PubMed] [Google Scholar]
- 51.Frohlich J, Irimia A, Jeste SS. Trajectory of frequency stability in typical development. Brain imaging and behavior. 2015;9:5–18. doi: 10.1007/s11682-014-9339-3. [DOI] [PMC free article] [PubMed] [Google Scholar]