Abstract
PURPOSE
Esophageal adenocarcinoma (EA) incidence has increased approximately 600% over the last four decades in the US. Little research has been conducted on the temporal trends of gastroesophageal reflux disease (GERD) and Barrett's esophagus (BE), yet it is important to establish whether these conditions have also increased with time or differ by age.
METHODS
The Cerner Health Facts® database contains information on 35 million patients between 2001 and 2010. GERD, BE, and EC cases were defined using ICD-9 codes. We calculated age-adjusted rates and 95% confidence intervals for GERD, BE, and EC.
RESULTS
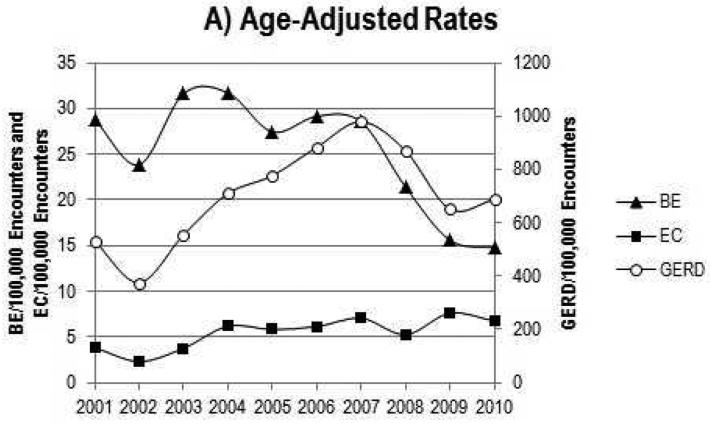
In this population, the overall, all-age rate per 100,000 encounters for GERD was 711.9, BE was 21.6, and EC was 6.1. During 2001–2010, GERD rates increased by approximately 50% and EC rates more than doubled, but BE rates declined by approximately 40%. Trends were similar by age, and all rates were higher in Caucasians and males.
CONCLUSIONS
These data indirectly support the idea that increased incidence of EC may be partially due to GERD, and raise the provocative hypothesis that BE rates may be decreasing possibly as a forerunner of continued stabilization of EA rates and a possible subsequent decline.
INTRODUCTION
In 2014, approximately half of the 18,170 anticipated incident esophageal cancers (EC) in the United States (US) were expected to be adenocarcinomas [1]. Esophageal adenocarcinoma (EA) incidence has increased approximately 600% over the last four decades in the US [2, 3]. Gastroesophageal reflux disease (GERD) is characterized by reflux of gastric contents into the esophagus [4]. It is a common condition that is estimated to affect 10–20% of adults in Western countries, and can cause loss of the native squamous epithelium, followed by development of Barrett's epithelium (BE) [5]. While it is not known if BE is a necessary precursor of EA [6], the dominant paradigm is that individuals may transition from GERD to BE and then to EA. However, studies have shown that GERD in the absence of BE appears to be a risk factor for EA as well [7]. Little research has been conducted on the temporal trends of GERD and BE, yet it is important to establish whether these conditions mirror EA secular changes, particularly by age. Therefore, we analyzed the overall and annual rates of GERD, BE, and EC in the Cerner Health Facts® Database [8]. We also examined sex-, age-, and race-specific rates of these conditions and annual rates stratified by age.
METHODS
Data Source
The data for this study is from the Cerner Health Facts® Database [8], with utilizes an automated electronic medical record system to capture hospital procedures (e.g., endoscopy), diagnostic information (e.g., diagnosis of esophageal disorders), demographics, medical history, admission, discharge, drug prescriptions, and laboratory tests over time [9]. A total of 152 hospitals contributed de-identified information on 35 million patients seen between January 1, 2001 and December 31, 2010. The Cerner Health Facts® Database is a HIPAA compliant, de-identified, longitudinal collection of individual level information generated from the Cerner® electronic medical record system which is utilized by both community and academic facilities across the United States. Due to the de-identified nature of the datasets obtained, this study was not considered human subjects research and was considered exempt from review by the Virginia Commonwealth University Institutional Review Board and the National Institutes of Health Office of Human Subjects Research.
Study Cohort
All patient encounters that occurred within the Cerner Health Facts® Database were utilized, yielding 81,392,956 inpatient and outpatient encounters. All instances of endoscopy were identified, utilizing International Classification of Diseases ninth edition clinical modification (ICD-9-CM) procedure codes. ICD-9-CM codes (42.23, 42.24, 42.33, 43.41, 44.13, 44.14, 44.22, 44.43, 45.13, 45.14, 45.30, 46.32, 51.10, 51.14, 51.84, 51.85, 51.87, 51.88, 52.13, 52.14, and 52.93) identified 167,185 endoscopies.
Outcomes
Esophageal disorders were identified utilizing ICD-9-CM diagnosis codes. Esophageal disorders included in this study were gastroesophageal reflux disease (ICD-9-CM 530.81 and 787.1), Barrett's esophagus (ICD-9-CM 530.85, and ICD-9-CM 530.2 prior to 2004), esophageal cancer (ICD-9-CM 150.0–150.9), esophagitis (ICD-9-CM 530.10–530.13 and 530.19), and reflux esophagitis (ICD-9-CM 530.11). Due to the unavailability of histology codes in this database, we were unable to distinguish between esophageal adenocarcinoma and esophageal squamous cell carcinoma. Thus, we analyzed all esophageal cancer cases together. There were 809,076 gastroesophageal reflux, 32,325 Barrett's esophagus, 10,934 esophageal cancer, 100,552 esophagitis, and 38,623 reflux esophagitis cases included. For the main analyses, GERD and esophagitis outcomes were allowed to repeat in an individual due to possible disease recurrence, whereas BE and EC diagnoses were each separately restricted to first (“incident”) diagnoses only.
Statistical Methods
We calculated rates and 95% confidence intervals (CI) for any recorded diagnosis of GERD or esophagitis and any initial diagnosis of BE and EC per 100,000 encounters with age-adjustment to the World Standard Population. We also used the number of endoscopies to crudely adjust the annual rates for increasing use of endoscopy during the time period. Thus, using years 2001–2002 as the referent, we divided the subsequent number of endoscopies per year by the referent to calculate an endoscopy ratio. Then, we divided the rates and 95% CI by the endoscopy ratio. Stratified analyses were conducted by sex, race (Caucasian, African-American, other), age (10 year age groups; 0–9, 10–19, ..., 70–79, 80+) and calendar year (2 year groups; 2001–2002, ..., 2009–2010). We also calculated the rate of esophageal disorders by age group and individual calendar year for graphical representation of temporal trends by age. Finally, we calculated the age-adjusted rate ratio of men:women by individual year for graphical representation.
As sensitivity analyses, we 1) computed the rates for individuals with at least two diagnostic codes for each BE and EC; 2) calculated a measure of person-years by allowing only one encounter per year per individual, and 3) computed the rates for only hospitals that contributed data in every year. All analyses were conducted using SAS version 9.3 (SAS Institute, Cary, NC).
RESULTS
In this population, the overall, all-age prevalence of GERD was approximately 1%, BE was 0.04%, and EC was 0.01%. As shown in Table 1 and Figure 1A, the rates of GERD per 100,000 encounters have increased by about 50% and EC rates more than doubled between 2001 and 2010. However, the rates of BE have been declining since the mid-2000s—the recent time period of 2009–2010 showed a 40% decline in rates when compared with 2001–2002. The same trends in BE rates were seen when examined per 100,000 endoscopies, instead of encounters, and restricted to diagnoses that were concurrent with an endoscopy procedure (Supplementary Table 1), yet it is noteworthy that the increase in EC rates dramatically subsided in this sensitivity analysis. Similar to BE, rates of esophagitis and reflux esophagitis have decreased by 30–40% during this time period (Supplementary Tables 2–3).
Table 1.
Age-adjusted rates of gastroesophageal reflux, Barrett's esophagus, and esophageal cancer per 100,000 encounters, Cerner Health Facts® Database, 2001–2010.
| Gastroesophageal
Reflux/ 100,000 encounters |
Barrett's
esophagus/ 100,000 encounters |
Esophageal
cancer/ 100,000 encounters |
|||||||
|---|---|---|---|---|---|---|---|---|---|
| Encounter N |
Endoscopies N |
Endoscopy Ratio |
GERD N | Rate (95% CI) | BE N | Rate (95% CI) | EC N | Rate (95% CI) | |
| Overall | 81,392,956 | 167,185 | 809,076 | 711.9 (709.9, 713.9) | 32,325 | 21.6 (21.3, 21.9) | 10,934 | 6.1 (6.0, 6.3) | |
| Years | |||||||||
| 2001-2002 | 8,892,780 | 22,143 | 59,101 | 452.9 (448.3, 457.5) | 4,293 | 26.3 (25.4, 27.2) | 623 | 3.1 (2.8, 3.3) | |
| 2003-2004 | 7,923,607 | 24,727 | 73,052 | 631.5 (625.3, 637.6) | 4,613 | 31.7 (30.6, 32.8) | 952 | 5.0 (4.6, 5.3) | |
| 2005-2006 | 10,090,055 | 28,956 | 122,509 | 834.4 (828.1, 840.7) | 5,154 | 28.4 (27.5, 29.3) | 1,369 | 6.0 (5.6, 6.4) | |
| 2007-2008 | 16,535,982 | 41,641 | 201,474 | 916.4 (911.3, 921.6) | 7,292 | 24.4 (23.8, 25.1) | 2,158 | 6.0 (5.7, 6.3) | |
| 2009-2010 | 37,950,532 | 49,718 | 352,940 | 669.2 (666.5, 672.0) | 10,973 | 15.2 (14.9, 15.5) | 5,832 | 7.2 (7.0, 7.4) | |
| Years, adjusted for number of endoscopies performed | |||||||||
| 2001-2002 | 8,892,780 | 22,143 | 1 | 59,101 | 452.9 (448.3, 457.5) | 4,293 | 26.3 (25.4, 27.2) | 623 | 3.1 (2.8, 3.3) |
| 2003-2004 | 7,923,607 | 24,727 | 1.1 | 73,052 | 565.5 (559.9, 571.0) | 4,613 | 28.4 (27.4, 29.3) | 952 | 4.5 (4.1, 4.8) |
| 2005-2006 | 10,090,055 | 28,956 | 1.3 | 122,509 | 638.0 (633.2, 642.9) | 5,154 | 21.7 (21.0, 22.4) | 1,369 | 4.6 (4.3, 4.9) |
| 2007-2008 | 16,535,982 | 41,641 | 1.9 | 201,474 | 487.3 (484.6, 490.1) | 7,292 | 13.0 (12.7, 13.3) | 2,158 | 3.2 (3.0, 3.4) |
| 2009-2010 | 37,950,532 | 49,718 | 2.2 | 352,940 | 298.1 (296.8, 299.3) | 10,973 | 6.8 (6.6, 6.9) | 5,832 | 3.2 (3.1, 3.3) |
| Sex | |||||||||
| Male | 31,423,289 | 74,152 | 288,389 | 693.2 (690.0, 696.4) | 18,611 | 33.3 (32.7, 33.9) | 7,899 | 11.3 (11.0, 11.6) | |
| Female | 49,969,667 | 93,033 | 455,421 | 629.9 (627.5, 632.3) | 12,513 | 13.4 (13.1, 13.6) | 2,054 | 1.8 (1.7, 1.9) | |
| Age | |||||||||
| 0-9 | 7,651,027 | 1,755 | 38,882 | 508.2 (503.1, 513.2) | 26 | 0.3 (0.2, 0.5) | 12 | 0.2 (0.1, 0.2) | |
| 10-19 | 6,103,494 | 2,549 | 16,694 | 273.5 (269.4, 277.7) | 111 | 1.8 (1.5, 2.2) | 10 | 0.2 (0.1, 0.3) | |
| 20-29 | 8,150,478 | 6,802 | 35,270 | 432.7 (428.2, 437.3) | 471 | 5.8 (5.3, 6.3) | 22 | 0.3 (0.2, 0.4) | |
| 30-39 | 8,576,937 | 11,681 | 65,034 | 758.2 (752.4, 764.1) | 1,578 | 18.4 (17.5, 19.3) | 150 | 1.7 (1.5, 2.0) | |
| 40-49 | 11,292,051 | 21,404 | 119,444 | 1057.8 (1051.8, 1063.8) | 4,570 | 40.5 (39.3, 41.6) | 777 | 6.9 (6.4, 7.4) | |
| 50-59 | 12,748,553 | 30,389 | 158,954 | 1246.8 (1240.7, 1253.0) | 7,987 | 62.7 (61.3, 64.0) | 2,414 | 18.9 (18.2, 19.7) | |
| 60-69 | 10,949,149 | 30,520 | 149,475 | 1365.2 (1358.3, 1372.1) | 7,823 | 71.4 (69.9, 73.0) | 3,378 | 30.9 (29.8, 31.9) | |
| 70-79 | 9,211,490 | 32,755 | 126,376 | 1371.9 (1364.4, 1379.5) | 6,346 | 68.9 (67.2, 70.6) | 2,890 | 31.4 (30.2, 32.5) | |
| 80+ | 6,709,777 | 29,330 | 98,947 | 1474.7 (1465.5, 1483.9) | 3,413 | 50.9 (49.2, 52.6) | 1,281 | 19.1 (18.0, 20.1) | |
| Race | |||||||||
| Caucasian | 63,582,557 | 139,755 | 617,716 | 680.2 (677.9, 682.6) | 29,367 | 24.1 (23.8, 24.5) | 8,624 | 5.8 (5.6, 5.9) | |
| African-American | 11,554,043 | 18,472 | 93,399 | 650.4 (645.9, 654.9) | 832 | 4.9 (4.5, 5.2) | 992 | 5.4 (5.1, 5.7) | |
| Other | 6,256,356 | 8,958 | 32,695 | 450.6 (445.5, 455.7) | 925 | 11.6 (10.8, 12.4) | 337 | 3.9 (3.5, 4.3) | |
Figure 1.
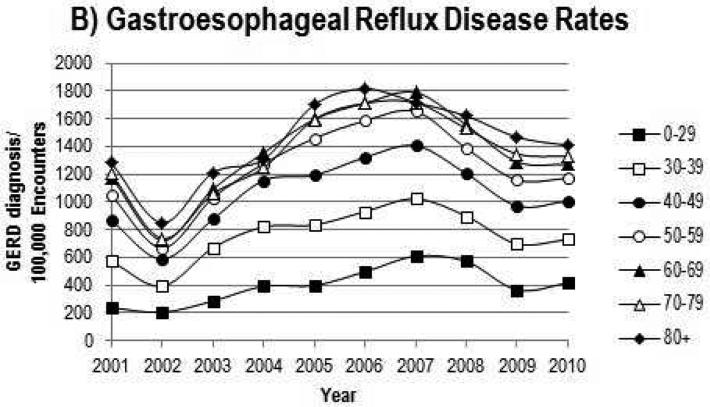
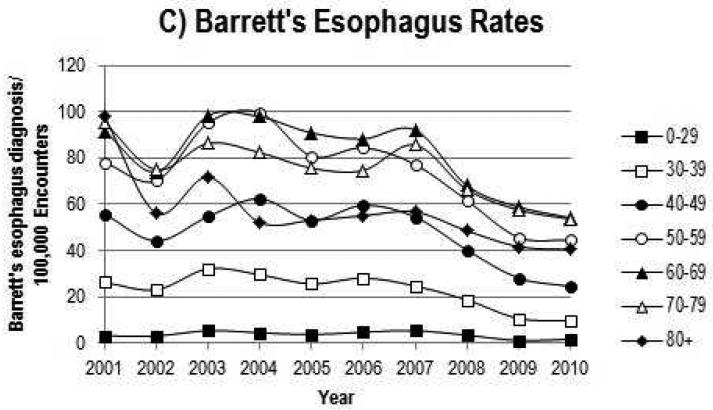
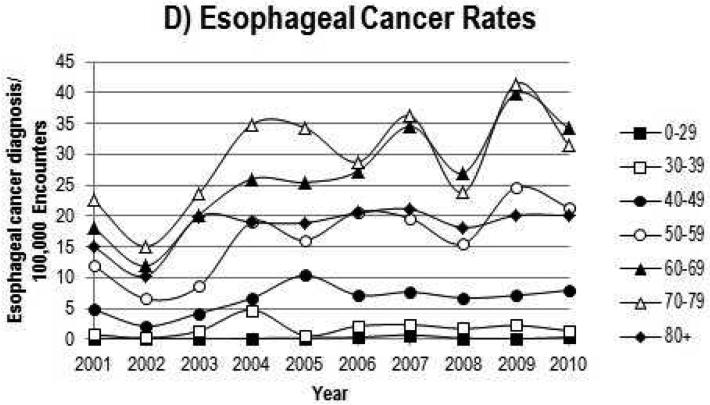
Temporal trends of gastroesophageal reflux, Barrett's esophagus and esophageal cancer overall (A), and by age (B–D), Cerner Health Facts® Database, 2001–2010.
The trends of increasing annual rates of GERD and decreasing annual rates of BE and esophagitis were observed for all ages (Figure 1B–C and Supplementary Figure 1A–B). For EC, rates increased substantially between 2001 and 2010 (Figure 1D). Rates for all three esophageal disorders were higher in Caucasians and males (Table 1), and the sex rate ratios remained stable overtime (Supplementary Figure 2). Additionally, rates increased with increasing age (Table 1 and Figure 1B–D).
While rates of esophageal disorders varied in the sensitivity analyses, the trends seen were consistent regardless of the definition for the esophageal disorders (Supplementary Table 5), estimated denominator (Supplementary Table 6), or hospital population (Supplementary Table 7).
CONCLUSIONS
The overall rates of BE [10, 11] and EC [1] are similar to previously reported estimates for US populations. However, the prevalence of GERD in this population is notably lower than previous US estimates of 20–30% for GERD symptoms in adults [12, 13]. As the current study is exclusively based on ICD-9 codes for a GERD diagnosis, we are likely only to capture severe cases of GERD. Regardless of the comparability of this population with prior survey-based prevalence estimates, the underlying trends of the severe GERD cases we have likely captured are valid and provide interesting results from which inferences can be made.
A limitation of this study is that the full patient history is unavailable. Thus, we were unable to distinguish individuals with newly diagnosed BE, which would require an endoscopy, from individuals with existing BE. For example, as shown in Supplementary Table 4, only eight percent of individuals that had a first-observed (“incident”) BE ICD-9 code during an encounter also had a concurrent endoscopy—however, when we restricted the BE analysis to this subpopulation, the temporal trend was unaltered (Supplementary Table 4 versus Table 1). This is likely a conservative underestimate, as the ICD code for BE may not be utilized until after the receipt of the pathology report in follow-up visit – possibly weeks or months post-endoscopy. We examined an alternative definition of concurrent endoscopy – up to six months prior to BE diagnosis, but this did not substantially change the number of individuals with a BE diagnosis that had an endoscopy recorded (data not shown). Referral from a “non-Cerner” specialist to a “Cerner tertiary center” is likely a primary reason why many of the Cerner BE diagnoses lack concurrent endoscopy. Another potential limitation is that hospitals contributed electronic medical record data to the Cerner Health Facts® Database for varying lengths of time. This could potentially explain the rapid decrease in cases of GERD and BE in the 2009–2010 timeframe. However, when we compared analyses of hospitals that contributed data to the entire study period with hospitals that contributed data only during the final years of the study period, we received similar results (data not shown). We also conducted an analysis only using outpatient encounters, and results were similar (data not shown).
The large increase in EC rates in the primary analysis may reflect increased overdiagnosis of indolent cancers due to expansion of gastroenterology services in some of the Cerner centers. The fact that the increasing EC trend was less apparent when adjustment was made for number of endoscopies offers support for this interpretation. Although EC rates have not dramatically increased in SEER registry data over the last decade, it is likely that the Cerner population is less representative of the total US population. Lastly, primary reason for endoscopy was not available, thus we were unable to assess EC trends by symptom which may have provided further insight into EC trends.
While this data has noted limitations, the size of the Cerner Health Facts® Database is extremely large, with over 81 million encounters captured during the study period. This allowed our study to examine these three esophageal disorders by both year and age to determine if rates of these conditions were increasing or decreasing in similar ways overtime and by age.
In summary, GERD rates increased, plateaued and then decreased slightly, BE rates decreased by approximately 40%, and EC rates increased. These patterns were fairly consistent when stratified by age. Additionally, we report higher rates of all three disorders among Caucasians and among males. These data indirectly support the idea that increased incidence of EC may be partially due to GERD, and raise the provocative idea that BE rates may be decreasing possibly as a forerunner of continued stabilization—and possible subsequent decline—of esophageal adenocarcinoma rates.
Supplementary Material
Acknowledgments
Funding: This research was supported in part by the National Institutes of Health (NIH) Intramural Research Program, National Cancer Institute, and grants from NIH (T32DK007150 and UL1TR00005).
Footnotes
Publisher's Disclaimer: This is a PDF file of an unedited manuscript that has been accepted for publication. As a service to our customers we are providing this early version of the manuscript. The manuscript will undergo copyediting, typesetting, and review of the resulting proof before it is published in its final citable form. Please note that during the production process errors may be discovered which could affect the content, and all legal disclaimers that apply to the journal pertain.
Conflict of Interest: The authors disclose no conflicts.
REFERENCES
- 1.Devesa SS, Blot WJ, Fraumeni JF., Jr Changing patterns in the incidence of esophageal and gastric carcinoma in the United States. Cancer. 1998 Nov 15;83(10):2049–53. [PubMed] [Google Scholar]
- 2.Brown LM, Devesa SS, Chow WH. Incidence of adenocarcinoma of the esophagus among white Americans by sex, stage, and age. J Natl Cancer Inst. 2008 Aug 20;100(16):1184–7. doi: 10.1093/jnci/djn211. [DOI] [PMC free article] [PubMed] [Google Scholar]
- 3.Simard EP, Ward EM, Siegel R, Jemal A. Cancers with increasing incidence trends in the United States: 1999 through 2008. CA: a cancer journal for clinicians. 2012 Mar-Apr;62(2):118–28. doi: 10.3322/caac.20141. [DOI] [PubMed] [Google Scholar]
- 4.Clouston AD. Timely topic: Premalignant lesions associated with adenocarcinoma of the upper gastrointestinal tract. Pathology. 2001 Aug;33(3):271–7. doi: 10.1080/00313020120070830. [DOI] [PubMed] [Google Scholar]
- 5.Riddell RH. The genesis of Barrett esophagus: has a histologic transition from gastroesophageal reflux disease-damaged epithelium to columnar metaplasia ever been seen in humans? Archives of pathology & laboratory medicine. 2005 Feb;129(2):164–9. doi: 10.5858/2005-129-164-TGOBEH. [DOI] [PubMed] [Google Scholar]
- 6.Shaheen N, Ransohoff DF. Gastroesophageal reflux, barrett esophagus, and esophageal cancer: scientific review. Jama. 2002 Apr 17;287(15):1972–81. doi: 10.1001/jama.287.15.1972. [DOI] [PubMed] [Google Scholar]
- 7.Chow WH, Finkle WD, McLaughlin JK, Frankl H, Ziel HK, Fraumeni JF., Jr The relation of gastroesophageal reflux disease and its treatment to adenocarcinomas of the esophagus and gastric cardia. JAMA. 1995 Aug 9;274(6):474–7. [PubMed] [Google Scholar]
- 8.Kosiborod M, Inzucchi SE, Krumholz HM, Xiao L, Jones PG, Fiske S, et al. Glucometrics in patients hospitalized with acute myocardial infarction: defining the optimal outcomes-based measure of risk. Circulation. 2008 Feb 26;117(8):1018–27. doi: 10.1161/CIRCULATIONAHA.107.740498. [DOI] [PubMed] [Google Scholar]
- 9.Larsen MD, Cars T, Hallas J. A MiniReview of the use of hospital-based databases in observational inpatient studies of drugs. Basic & clinical pharmacology & toxicology. 2013 Jan;112(1):13–8. doi: 10.1111/j.1742-7843.2012.00928.x. [DOI] [PubMed] [Google Scholar]
- 10.Musana AK, Resnick JM, Torbey CF, Mukesh BN, Greenlee RT. Barrett's esophagus: incidence and prevalence estimates in a rural Mid-Western population. The American journal of gastroenterology. 2008 Mar;103(3):516–24. doi: 10.1111/j.1572-0241.2007.01599.x. [DOI] [PubMed] [Google Scholar]
- 11.Corley DA, Kubo A, Levin TR, Block G, Habel L, Rumore G, et al. Race, ethnicity, sex and temporal differences in Barrett's oesophagus diagnosis: a large community-based study, 1994-2006. Gut. 2009 Feb;58(2):182–8. doi: 10.1136/gut.2008.163360. [DOI] [PMC free article] [PubMed] [Google Scholar]
- 12.Locke GR, 3rd, Talley NJ, Fett SL, Zinsmeister AR, Melton LJ., 3rd Prevalence and clinical spectrum of gastroesophageal reflux: a population-based study in Olmsted County, Minnesota. Gastroenterology. 1997 May;112(5):1448–56. doi: 10.1016/s0016-5085(97)70025-8. [DOI] [PubMed] [Google Scholar]
- 13.El-Serag HB, Petersen NJ, Carter J, Graham DY, Richardson P, Genta RM, et al. Gastroesophageal reflux among different racial groups in the United States. Gastroenterology. 2004 Jun;126(7):1692–9. doi: 10.1053/j.gastro.2004.03.077. [DOI] [PubMed] [Google Scholar]
Associated Data
This section collects any data citations, data availability statements, or supplementary materials included in this article.


