

Abstract
Childhood obesity is a major public health issue. Here we investigated whether differential DNA methylation was associated with childhood obesity. We studied DNA methylation profiles in whole blood from 78 obese children (mean BMI Z-score: 2.6) and 71 age- and sex-matched controls (mean BMI Z-score: 0.1). DNA samples from obese and control groups were pooled and analyzed using the Infinium HumanMethylation450 BeadChip array. Comparison of the methylation profiles between obese and control subjects revealed 129 differentially methylated CpG (DMCpG) loci associated with 80 unique genes that had a greater than 10% difference in methylation (P-value < 0.05). The top pathways enriched among the DMCpGs included developmental processes, immune system regulation, regulation of cell signaling, and small GTPase-mediated signal transduction. The associations between the methylation of selected DMCpGs with childhood obesity were validated using sodium bisulfite pyrosequencing across loci within the FYN, PIWIL4, and TAOK3 genes in individual subjects. Three CpG loci within FYN were hypermethylated in obese individuals (all P < 0.01), while obesity was associated with lower methylation of CpG loci within PIWIL4 (P = 0.003) and TAOK3 (P = 0.001). After building logistic regression models, we determined that a 1% increase in methylation in TAOK3, multiplicatively decreased the odds of being obese by 0.91 (95% CI: 0.86 – 0.97), and an increase of 1% methylation in FYN CpG3, multiplicatively increased the odds of being obese by 1.03 (95% CI: 0.99 – 1.07). In conclusion, these findings provide evidence that childhood obesity is associated with specific DNA methylation changes in whole blood, which may have utility as biomarkers of obesity risk.
Keywords: biomarkers, childhood obesity, epigenetics, genome-wide, methylation
Introduction
The prevalence of childhood obesity worldwide has increased over the past decade. An estimated 43 million preschool children were overweight or obese in 2010, a 60% increase since 1990.1 Childhood obesity is linked to both short- and long-term health issues.2,3 Obese children have a higher risk of obesity in later life as well as of co-morbidities, such as atherosclerosis, type-2 diabetes, hypertension, and some forms of cancer.4-6 The rapid rise in prevalence of obesity over such a short time frame cannot be explained solely by fixed genetic factors but suggests that environmental factors, such as diet and the level of physical activity, are likely to play a major role.7 There is now a substantial body of evidence from both animal and human studies linking environmental factors particularly in early life to later adiposity and the risk of metabolic disease.8 For instance, in animal studies, variations in maternal diet have been linked to alterations in metabolism and body composition in the offspring,9 while in humans, famine exposure during pregnancy,10 maternal obesity,11 or gestational diabetes,12 were associated with an increased risk of obesity in the adult offspring.
The mechanisms by which early environmental factors may influence phenotype and disease risk have been suggested to involve the altered epigenetic regulation of genes.13 Epigenetic processes, such as DNA methylation, induce heritable changes in gene expression without a change in nucleotide sequence. Epigenetic regulation is central to the control of gene expression, genomic imprinting, X chromosome inactivation, and cell specification. There is growing evidence that environmental factors can alter the epigenome and that such alterations are involved in the development and progression of non-communicable diseases. Epigenetic traits associated with type-2 diabetes,14 adiposity,15,16 cardiovascular disease,17 stress responses,18 and specific solid tumors,19 have also been identified in peripheral tissues, and such epigenetic marks may have utility as biomarkers to identify individuals at increased risk of disease.15,16 However, to date, there has been no systematic genome-wide screen to investigate whether childhood obesity is associated with differences in DNA methylation in peripheral blood. Identification of methylation differences in peripheral blood associated with severe childhood obesity may provide insights into the systemic changes associated with obesity in children and identify potential epigenetic biomarkers of childhood obesity. Here, we used the Illumina Infinium HumanMethylation450 BeadChip arrays (450K) in a case-control study using pooled DNA from obese children and age- and sex-matched controls to identify sites of differential methylation. We then sought to validate these sites using pyrosequencing in an extended number of individual subjects to investigate if variations in methylation status at identified CpG sites were associated with child's adiposity.
Results
Study participants
For the Infinium HumanMethylation450K BeadChip analysis, we used pooled DNA samples from 54 children (25 male) with severe obesity (median age: 12.6 years, age- and sex-adjusted BMI Z-score: 2.58) and from 54 controls (25 male) (median age: 12.4 years, age- and sex-adjusted BMI Z-score: 0.13) (Table S1). Validation of individual CpG loci selected from the 450K array was carried out by pyrosequencing on individual samples from an extended group of 78 obesity cases (40 male) and 71 controls (36 male); median ages of the obesity cases and the controls were 12.6 and 12.9 years, respectively, while median age- and sex-adjusted BMI Z-scores were 2.61 and 0.08, respectively (Table 1).
Table 1.
Cohort characteristics of severe obesity cases and controls
| Severe Obesity Cases | Controls | |
|---|---|---|
| Subjects used for Validation | ||
| Number | 78 | 71 |
| Sex | M:40 F:38 | M:36 F:35 |
| Age at Visit (years) | 12.55 (9.4 to 13.73) | 12.9 (10.7 to 14.10) |
| BMI Z-score | 2.61 (2.33 to 2.79) | 0.08 (−0.4 to 0.59) |
| Fasting Insulin | 20 (8 to 27) | 6 (3 to 10) |
| Fasting Glucose | 4.6 (4.4 to 5.0) | 4.7 (4.3 to 5.0) |
| SBP | 118 (108 to 130) | 101 (97 to 109) |
| DBP | 64 (61 to 72) | 60 (57 to 63) |
| Cholesterol | 4.5 (3.6 to 5.2) | 4.1 (3.6 to 4.7) |
| LDL | 2.60 (2.15 t 3.25) | 2.20 (1.85 to 2.98) |
| HDL | 1.05 (0.8 to 1.32) | 1.45 (1.20 to 1.60) |
| Triglycerides | 1.2 (0.8 to 2.0) | 0.6 (0.4 to 0.8) |
For age, BMI Z-score (CDC growth charts),52 and fasting insulin levels, the median and interquartile ranges are given
Identification of differentially methylated CpG loci associated with childhood obesity
A total of 1879 CpGs (associated with 1119 unique genes) were differentially methylated (P < 0.05) between the obese and control subject pools with a difference in methylation of more than 5% (Table S2). Of these, 129 CpGs (associated with 81 unique genes) had a greater than 10% difference in methylation between the case and control groups and were denoted differentially methylated CpGs (DMCpGs) (Table 2). As cellular heterogeneity can influence methylation profiles and drive some of the methylation differences detectable across individual blood samples,20 blood cellular content was estimated in all the pooled samples using a previously reported signature.21 Cellular composition was similar in the pooled obese and control samples (Table S3). Of the 1879 CpGs, 776 significantly covaried with cell type (Table S2), while 22 of the 129 DMCpGs with a 10% difference in methylation between the case and control groups significantly co-varied with one cell type (B-cells) (Table 2).
Table 2.
Differentially methylated CpGs (DMCpGs) with a greater than 10% difference in methylation and a P-value < 0.05 for the difference between severe obesity cases and controls, as identified by the Human Methylation450 BeadChip array
| Gene Name | Probe | CHR | Genomic | P-value | Control | Obese |
|---|---|---|---|---|---|---|
| |
|
|
Co-ordinate |
|
|
|
| Hypomethylated DMCpGs | ||||||
| LRIG1* | cg26131019 | 3 | 66550740 | 4.96E-05 | 0.244 | 0.0723 |
| OIT3* | cg24769348 | 10 | 74692580 | 0.0002 | 0.4437 | 0.3271 |
| MGMT | cg09993319 | 10 | 131529400 | 0.0003 | 0.7305 | 0.5051 |
| PIWIL4 | cg 16436762 | 11 | 94307970 | 0.0004 | 0.5275 | 0.4228 |
| cg04456492 | 7 | 20010780 | 0.0007 | 0.802 | 0.6206 | |
| PCBD1 | cg05601623 | 10 | 72647650 | 0.001 | 0.228 | 0.1008 |
| cg23892028 | 6 | 27256340 | 0.0015 | 0.4042 | 0.2748 | |
| FER1L5* | cg20312012 | 2 | 97331030 | 0.0016 | 0.5836 | 0.4771 |
| AMBRA1* | cg20090290 | 11 | 46543700 | 0.0016 | 0.4844 | 0.3821 |
| A1CF | cg16531903 | 10 | 52645850 | 0.002 | 0.871 | 0.7431 |
| ARNT* | cg00944785 | 1 | 150825400 | 0.002 | 0.4981 | 0.3921 |
| FAM107B | cg14152591 | 10 | 14587920 | 0.0021 | 0.493 | 0.3628 |
| cg14192979 | 17 | 12562530 | 0.0025 | 0.4944 | 0.2951 | |
| cg26261358 | 15 | 24043140 | 0.0026 | 0.4387 | 0.2601 | |
| cg11557901 | 9 | 128022400 | 0.003 | 0.6408 | 0.5322 | |
| cg26576353 | 10 | 126135200 | 0.0033 | 0.8465 | 0.7393 | |
| TMCC1* | cg12196294 | 3 | 129575100 | 0.0033 | 0.6321 | 0.5305 |
| cg22626683 | 1 | 172903100 | 0.0037 | 0.7357 | 0.6279 | |
| PRG2 | cg15971518 | 11 | 57159180 | 0.0043 | 0.5815 | 0.393 |
| cg19699682 | 3 | 119349800 | 0.0045 | 0.552 | 0.425 | |
| B3GNT7 | cg00424152 | 2 | 232263100 | 0.0045 | 0.7712 | 0.6492 |
| IGF2BP3* | cg17209188 | 7 | 23387400 | 0.0048 | 0.5024 | 0.4001 |
| TAOK3 | cg17627898 | 12 | 118782500 | 0.0049 | 0.4411 | 0.3409 |
| cg07879897 | 17 | 66201170 | 0.005 | 0.2838 | 0.149 | |
| SULF2* | cg21130926 | 20 | 46415320 | 0.0054 | 0.6266 | 0.4702 |
| cg09196346 | 13 | 23499330 | 0.0054 | 0.2887 | 0.135 | |
| cg04450797 | 8 | 337367 | 0.0057 | 0.7987 | 0.6379 | |
| FSCN2 | cg05248234 | 17 | 79495520 | 0.0077 | 0.7439 | 0.6027 |
| cg11725581 | 7 | 6140990 | 0.0084 | 0.745 | 0.6439 | |
| AP3S1 | cg03637218 | 5 | 115209100 | 0.0087 | 0.7055 | 0.593 |
| ZNF827* | cg07091220 | 4 | 146752100 | 0.009 | 0.5674 | 0.467 |
| NAPSB | cg25094735 | 19 | 50848020 | 0.0091 | 0.6449 | 0.5334 |
| RIPK2* | cg15723028 | 8 | 90776470 | 0.0098 | 0.5502 | 0.4427 |
| PDLIM7 | cg15225325 | 5 | 176921800 | 0.0101 | 0.5126 | 0.3925 |
| SH3PXD2B | cg24921943 | 5 | 171847600 | 0.0102 | 0.5018 | 0.3943 |
| MIR125B1 | cg26916936 | 11 | 121970600 | 0.0116 | 0.6221 | 0.5164 |
| MATN2* | cg19935471 | 8 | 99048260 | 0.0116 | 0.6963 | 0.5957 |
| SLC35E2 | cg12213037 | 1 | 1666808 | 0.0122 | 0.7003 | 0.5419 |
| C18orf62 | cg23936477 | 18 | 73139740 | 0.0126 | 0.7775 | 0.6599 |
| PCDHB3 | cg23918315 | 5 | 140479000 | 0.0138 | 0.4064 | 0.2979 |
| RALGPS1* | cg14306650 | 9 | 129829100 | 0.0141 | 0.705 | 0.6032 |
| cg27114706 | 12 | 92527250 | 0.0148 | 0.877 | 0.7548 | |
| DNAJC8 | cg03040423 | 1 | 28560940 | 0.0157 | 0.9116 | 0.807 |
| MEGF11* | cg00682263 | 15 | 66188800 | 0.0163 | 0.5975 | 0.4801 |
| LOC652276* | cg06035616 | 16 | 2653306 | 0.0209 | 0.1801 | 0.0665 |
| RAB36 | cg05338731 | 22 | 23489040 | 0.0217 | 0.4992 | 0.3863 |
| cg00968488 | 5 | 103876200 | 0.0217 | 0.6865 | 0.5749 | |
| cg16885113 | 6 | 29648510 | 0.0235 | 0.8421 | 0.7381 | |
| AURKA | cg09712306 | 20 | 54949300 | 0.0248 | 0.481 | 0.3621 |
| cg23661721 | 14 | 95991370 | 0.0271 | 0.5536 | 0.4314 | |
| LOC652276 | cg03314158 | 16 | 2653280 | 0.0278 | 0.1674 | 0.0465 |
| AGPAT1 | cg17213381 | 6 | 32139500 | 0.029 | 0.8273 | 0.6971 |
| cg21852792 | 2 | 71678460 | 0.03 | 0.5511 | 0.4473 | |
| DEAF1 | cg03951394 | 11 | 660455 | 0.0316 | 0.8874 | 0.7094 |
| SORL1 | cg10746778 | 11 | 121460800 | 0.0341 | 0.5232 | 0.3801 |
| TOP1MT | cg00033213 | 8 | 144399300 | 0.0383 | 0.6014 | 0.4747 |
| cg06864789 | 6 | 139013000 | 0.0386 | 0.5387 | 0.3803 | |
| SNORA1* | cg09719956 | 11 | 93465910 | 0.0386 | 0.6563 | 0.5343 |
| cg05320460 | 15 | 63179550 | 0.039 | 0.7531 | 0.6475 | |
| cg27245056 | 10 | 122356500 | 0.0396 | 0.6572 | 0.5472 | |
| cg12799049 | 1 | 197811500 | 0.0401 | 0.4571 | 0.3469 | |
| CTSS | cg26891210 | 1 | 150703100 | 0.0402 | 0.7015 | 0.5925 |
| CBX7 | cg13306870 | 22 | 39527580 | 0.0408 | 0.3769 | 0.2444 |
| LTBP1* | cg11918450 | 2 | 33359200 | 0.0425 | 0.645 | 0.5413 |
| B4GALT6 | cg11986743 | 18 | 29205360 | 0.0447 | 0.6977 | 0.5903 |
| OTUD6B* | cg19586698 | 8 | 92097850 | 0.0463 | 0.7898 | 0.6607 |
| TP53INP2 | cg20592836 | 20 | 33292130 | 0.0496 | 0.5504 | 0.3536 |
| Hypermethylated DMCpGs | ||||||
| SPON2 | cg10852718 | 4 | 1167230 | 7.59E-06 | 0.734 | 0.8759 |
| cg24591913 | 10 | 47062880 | 0.0002 | 0.6864 | 0.8203 | |
| IL32* | cg16730716 | 16 | 3114986 | 0.0015 | 0.8161 | 0.9198 |
| FYN | cg26846943 | 6 | 112165100 | 0.002 | 0.2063 | 0.33 |
| TOX2 | cg26365090 | 20 | 42574360 | 0.0021 | 0.1902 | 0.4129 |
| TNXB | cg14188106 | 6 | 32063900 | 0.0021 | 0.4143 | 0.5163 |
| cg12342501 | 2 | 8530521 | 0.0021 | 0.6035 | 0.7998 | |
| cg27596172 | 8 | 26727370 | 0.0034 | 0.7664 | 0.8698 | |
| UBE4A | cg25574849 | 11 | 118269800 | 0.0035 | 0.2916 | 0.4022 |
| C7orf50 | cg26542892 | 7 | 1133730 | 0.0035 | 0.6345 | 0.7703 |
| TMEM71 | cg10054641 | 8 | 133773100 | 0.0041 | 0.3066 | 0.429 |
| cg08506672 | 5 | 3959743 | 0.0059 | 0.2318 | 0.4672 | |
| KRTAP27-1 | cg05809586 | 21 | 31709690 | 0.0063 | 0.5095 | 0.7153 |
| cg03240981 | 6 | 26615070 | 0.0063 | 0.4289 | 0.5301 | |
| cg00696044 | 10 | 63240300 | 0.0063 | 0.3894 | 0.5672 | |
| SLC12A8 | cg09866143 | 3 | 124861500 | 0.0078 | 0.565 | 0.7826 |
| WTIP* | cg10771931 | 19 | 34972140 | 0.0083 | 0.7332 | 0.8829 |
| SLC25A21 | cg00814218 | 14 | 37445440 | 0.0084 | 0.6818 | 0.8043 |
| CCDC88C | cg23165913 | 14 | 91880060 | 0.0086 | 0.413 | 0.5392 |
| CCS | cg24851651 | 11 | 66362960 | 0.0087 | 0.3717 | 0.701 |
| TRPM4 | cg01997599 | 19 | 49689670 | 0.0103 | 0.4019 | 0.5334 |
| ABCD3* | cg26908356 | 1 | 94929490 | 0.0111 | 0.4584 | 0.6008 |
| cg02479782 | 2 | 71033150 | 0.0113 | 0.3091 | 0.5286 | |
| cg08754654 | 5 | 154026400 | 0.0117 | 0.2817 | 0.3824 | |
| NAV1 | cg04287574 | 1 | 201619600 | 0.0124 | 0.2851 | 0.3895 |
| CSMD2 | cg21440084 | 1 | 34615960 | 0.0125 | 0.4898 | 0.6454 |
| cg10384133 | 9 | 45733080 | 0.0126 | 0.7488 | 0.8503 | |
| USP36 | cg01385356 | 17 | 76837380 | 0.0139 | 0.2224 | 0.3224 |
| cg07371521 | 5 | 154026400 | 0.0142 | 0.2003 | 0.3382 | |
| cg04653913 | 16 | 53407750 | 0.0145 | 0.588 | 0.6985 | |
| cg18618432 | 19 | 34621910 | 0.0147 | 0.5521 | 0.6704 | |
| TRAPPC9 | cg16191297 | 8 | 140926700 | 0.0156 | 0.7429 | 0.8567 |
| cg14580085 | 2 | 239553400 | 0.0172 | 0.5782 | 0.6973 | |
| cg24643105 | 11 | 113928500 | 0.0189 | 0.6603 | 0.7965 | |
| cg19373347 | 1 | 219634800 | 0.019 | 0.4338 | 0.5557 | |
| IL12RB1 | cg26642774 | 19 | 18170380 | 0.0191 | 0.5503 | 0.7219 |
| cg02389264 | 16 | 88757750 | 0.0191 | 0.6135 | 0.7415 | |
| cg10510935 | 1 | 4059661 | 0.0209 | 0.3138 | 0.4174 | |
| cg09916840 | 16 | 87248610 | 0.0214 | 0.0156 | 0.1245 | |
| cg02100397 | 19 | 646890 | 0.0223 | 0.4163 | 0.5673 | |
| SH3GL1 | cg11592634 | 19 | 4370001 | 0.0224 | 0.1313 | 0.3691 |
| C10orf110 | cg12421087 | 10 | 1083304 | 0.0225 | 0.6924 | 0.8347 |
| ANKH | cg14843632 | 5 | 14870590 | 0.0236 | 0.2696 | 0.3867 |
| ARPC3 | cg10738648 | 12 | 110888900 | 0.0238 | 0.5427 | 0.7118 |
| IRGM | cg22000984 | 5 | 150226300 | 0.0239 | 0.1801 | 0.3087 |
| SLC6A5* | cg14524936 | 11 | 20627600 | 0.0253 | 0.3286 | 0.4456 |
| cg01584086 | 11 | 10373720 | 0.0254 | 0.1171 | 0.2833 | |
| cg07700233 | 4 | 39171230 | 0.0264 | 0.3269 | 0.4351 | |
| ATP9B* | cg09636756 | 18 | 77134250 | 0.0267 | 0.7454 | 0.8943 |
| cg02088292 | 1 | 235099200 | 0.0268 | 0.2089 | 0.3511 | |
| RAB1A | cg00570635 | 2 | 65355270 | 0.0318 | 0.1747 | 0.3775 |
| SPDEF | cg16527629 | 6 | 34524700 | 0.0324 | 0.331 | 0.4785 |
| C14orf119 | cg08253809 | 14 | 23568020 | 0.033 | 0.1935 | 0.3079 |
| HADHA | cg01188578 | 2 | 26464060 | 0.034 | 0.2665 | 0.4863 |
| cg18182981 | 6 | 1449399 | 0.037 | 0.6137 | 0.7345 | |
| MOSC2 | cg12466610 | 1 | 220950200 | 0.0394 | 0.1258 | 0.3988 |
| FLJ42875 | cg08121686 | 1 | 2981840 | 0.0397 | 0.5734 | 0.714 |
| cg10588622 | 2 | 45397780 | 0.0421 | 0.2567 | 0.3627 | |
| SPTBN1 | cg01286930 | 2 | 54783770 | 0.0458 | 0.4365 | 0.5427 |
| cg07044115 | 10 | 123100200 | 0.0478 | 0.5947 | 0.6962 | |
| PMF1 | cg25465065 | 1 | 156198400 | 0.0486 | 0.5544 | 0.7344 |
| cg01118640 | 14 | 52816920 | 0.0494 | 0.6159 | 0.7683 | |
The genes tagged by “*”are associated with B lymphocytes, counted by the Houseman method, with P-value < 0.05 in line regression
Among the DMCpGs independent of cellular composition, 50 showed hypomethylation and 57 showed hypermethylation in obese subjects, compared to the control group. CpGs located within O(6)-methylguanine-DNA methyltransferase (MGMT), TAO kinase 3 (TAOK3), piwi-like RNA-mediated gene silencing 4 (PIWIL4), mir-125b, and aurora Kinase A (AURKA) genes were hypomethylated in the obese pool, while sites located within spondin2 (SPON2), ras related protein Rab1A (RAB1A), and FYN oncogene related to SRC (FYN) were hypermethylated in the obese pool. The genomic distribution of DMCpGs in comparison to all the probes located on the 450K BeadChip array with respect to gene structure or CpG islands is shown in Figure 1. There was no significant enrichment of DMCpGs within specific gene regions (Fig. 1A); however, in relation to CpG content and distance to CpG islands, there was an enrichment of hypomethylated DMCpGs within open seas (P = 0.005), while there were fewer hypermethylated DMCpGs within CpG islands (P = 0.009) (Fig. 1B).
Figure 1.
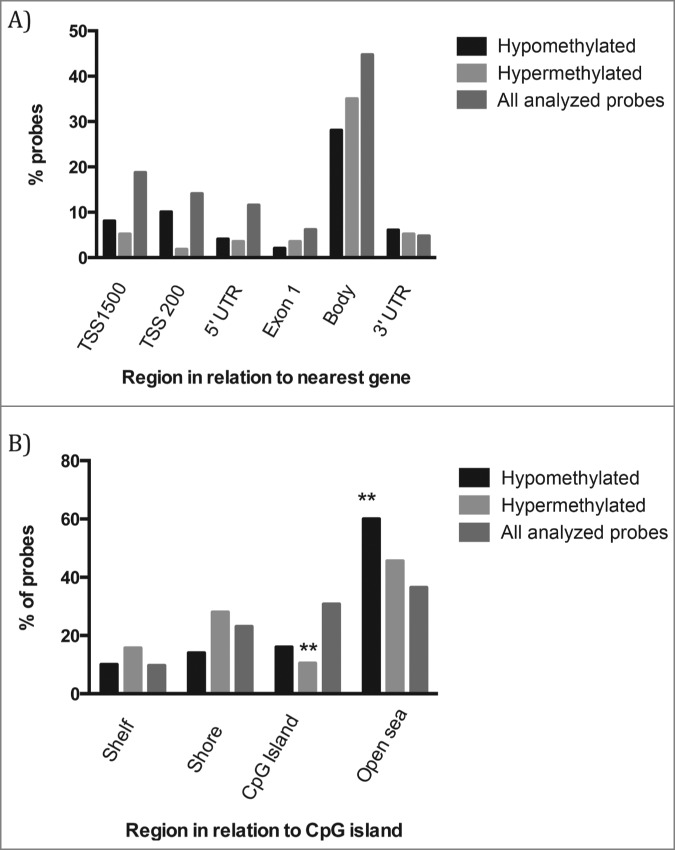
Distribution of hypo- and hypermethylated DMCpGs versus all analyzed CpGs sites on the Infinium HumanMethylation450 BeadChip in relation to (A) the nearest gene regions; (B) CpG island regions. Chi-square analysis was performed to test for over- or under-representation of sequence features among the DMCpGs. * = P-value < 0.05.
Validation of differentially methylated regions by pyrosequencing
Validation of individual CpG loci within FYN, PIWIL4, and TAOK3, selected from the 450K array, was carried out by pyrosequencing individual samples from an extended group of 78 obesity cases (40 male) and 71 controls (36 male); these samples included the 54 obese and 54 lean subjects analyzed by the 450K array. These DMCpGs were selected according to the following criteria: i) contiguous CpGs that were differentially methylated with respect to obesity; ii) independent of cellular composition; and iii) having a difference of methylation of above 10%, with both hypo- and hyper-methylated CpGs being assessed. Pyrosequencing analysis of the DMCpGs in individual subject samples confirmed both the statistical significance and direction of the associations between methylation levels and childhood obesity. FYN (Cg26846943- CpG1) was hypermethylated in obese individuals [median: 12.2% (interquartile range: 10.0–25.7%)] compared to controls [10.8% (9.2–18.2%)] (P=0.012) (Table 3, Fig. 2A). For FYN, the pyrosequencing assay also covered 2 adjacent CpG loci, where methylation levels were also higher in the obese group: For FYN CpG2 (GRCh37/hg19 112165053) the mean was 9.5% (8.2–24.2%) in the obese group vs. 8.7% (7.5–17.4%) in the control group (P=0.004); for FYN CpG3 (GRCh37/hg19 112165057) the mean was 16.6% (13.6–28.9%) in the obese group vs. 14.6% (12.3–21.5%) in the control group (P = 0.031). In contrast, methylation levels of CpG sites related to PIWIL4 and TAOK3 were lower in the obese group: median methylation levels for PIWIL4 Cg 6436762 were 26.8% (20.2 – 31.9%) in obese cases and 32.3% (25.1 – 37.9%) in controls (P = 0.003) (Table 3, Fig. 2B); for TAOK3 Cg17627898, methylation levels were 23.7% (19.7 – 28.3%) in the obese group compared to 27.2% (23.0 – 32.0) in the control group (P = 0.001) (Table 3, Fig. 2C). Genotyping analysis in all subjects excluded the presence of SNPs at the cytosine of the DMCpGs within PIWIL4, FYN, and TAOK3.
Table 3.
Methylation differences between obese (n = 79) and controls (n = 71) groups at the CpG loci identified within FYN, IGFBP3, PIWIL4, and TAOK3
| CpG Site | Median Methylation Cases | Median Methylation Controls | P-value |
|---|---|---|---|
| FYN CpG 1 (Cg26846943) Chr6:112165062 | 12.2 (10–25.7) | 10.8 ( 9.2 – 18.2) | 0.012 |
| FYN CpG 2 Chr6: 112165053 | 9.5 (8.2–24.2) | 8.7 (7.5–17.4) | 0.031 |
| FYN CpG 3 Chr6: 112165057 | 16.6 (13.6–28.9) | 14.6 (12.3–21.5) | 0.004 |
| PIWIL4 (Cg16436762) Chr11:94307971 | 26.8 (20.2–931.9 | 32.3 (25.1–37.9) | 0.003 |
| TAOK3 (Cg17627898) Chr12:118782453 | 23.7 (19.7 – 28.3) | 27.2 (23.0 – 32.0) | 0.001 |
Median and interquartile range are shown. FYN 112165062, TAOK3 118782453, PIWIL4 9430797
Figure 2.

Percentage methylation differences between obese (n=79) and controls (n=71) at (A) FYN; (B) PIWIL4 (Cg16436); and C) TAOK3. * = P-value < 0.05, ** = P-value <0.01.
Logistic models were built using case vs. control status as the outcome, and methylation of the CpG and gender used as predictors for each CpG of interest. All models were found to differ significantly from the null models, with CpG methylation being a significant predictor of case vs. control status for each model and P-values of 0.001 for TAOK3, 0.009 for PIWIL4, and 0.011 for FYN3. Nagelkerke R squared (a measure of the variation explained by each model) was between 7 and 12%. Gender was not a significant predictor of case vs. control status when CpG methylation was controled for. These models indicated that for each 1% increase in methylation of TAOK3, the odds of being a case increased by a factor of 1.11 for both genders.
A scatterplot matrix of methylation for all CpGs indicated high correlation between FYN CpGs1, 2, and 3 and also between the identified CpG loci associated with TAOK3 and PIWIL4, with Spearman correlation coefficients for highly correlated CpGs ≥ 0.89 (Fig. S1 and Table S4). It was not possible to include all CpGs in a regression model as a result of co-linearity in predictor variables. One CpG from each group of highly correlated CpGs was entered into a logistic regression model including gender. A logistic regression model with case vs. control status as outcome and FYN CpG3, TAOK3, and sex as predictor variables was significantly different from the null model (P = 0.002) and explained 13.8% of the variance (Nagelkerke R square = 0.138). An increase in methylation of 1% in TAOK3 multiplicatively decreased the odds of being a case by 0.91 (95% CI: 0.86 – 0.97) (P = 0.005), all other variables in the equation being held constant; an increase of 1% methylation in FYN CpG3 multiplicatively increased the odds of being a case by 1.03 (95% CI: 0.99 – 1.07) (P = 0.114).
Given the high correlation between the methylation status of TAOK3 and PIWIL4, we run Gapped Local Alignment of Motifs (GLAM2), which is part of the motif-based sequence analysis suite MEME (http://meme.nbcr.net/meme),22 to determine whether there was any commonality between the sequences surrounding these CpG sites. No statistically signicant common motif was found within 75 bp at either side of the identified CpGs associated with PIWIL4 or TAOK.
Pathway analysis
The extended list of CpGs with P < 0.05 for control vs. obese and a methylation difference of more than 5%, excluding those CpGs associated with cell type, was significantly enriched for multiple Gene Onotology (GO) processes involved in developmental processes, immune system regulation, regulation of cell signaling, and small GTPase-mediated signal transduction (Table S5). Among the significantly enriched GO molecular functions were ion binding, phosphotransferase activity, protein kinase activity, collagen binding, and Ras guanyl nucleotide exchange factor activity (Table S6).
Discussion
In this study, we identified 1879 CpG sites in peripheral blood cells with a greater than 5% difference in methylation between obese and control children, of which 129 CpGs had a greater than 10% difference in methylation. Both hypo- and hyper-methylation of CpGs loci in relation to obesity were observed. Interestingly, most of the differentially methylated CpGs were found within open seas or intergenic regions, with a paucity of DMCpGs within CpG islands. This is consistent with previous findings, which have suggested that DNA methylation may be more dynamically regulated outside CpG islands. For instance, tissue-specific DNA methylation often occurs in shores outside the CpG islands,23 while disease associated DMCpGs and environmentally induced epigenetic changes, such as those induced by exercise intervention, have been shown to be enriched within intergenic regions.24-26 The enrichment of DMCpGs within the intergenic regions may reflect the location of regulatory elements, such as enhancers or insulators, which are frequently located within the intergenic regions.27
The associations between the methylation of specific CpG loci within PIWIL4, TAOK3, and FYN in peripheral blood and childhood obesity observed in the genome wide-array were validated by sodium bisulfite pyrosequencing. Validation by pyrosequencing showed a signficant association between the methylation of these CpG loci and obesity with the direction of association, consistent with that observed by the 450K array. There was a difference in the magnitude of the methylation change observed between the case and control groups between the 2 techniques, but this may reflect the fact that additional subjects were analyzed in the validation step when using pyrosequencing and that different methods were used to assess DNA methylation. A number of previous studies have also reported small differences in DNA methylation levels measured by 450K arrays in comparison with pyrosequencing.28,29
DNA methylation patterns are often tissue specific; whether and how the methylation of such marks in blood may reflect methylation in other more metabolically relevant tissues is not known. However, there have been studies that show consistency in methylation between tissues. For instance, Murphy et al. have shown that methylation across the DMRs for H19, MEST, and PEG10 did not differ across a range of conceptual tissues (buccal, brain, eye, intestine, liver, lung, muscle, and umbilical cord blood).30 Talens et al. found that, for a number of non-imprinted genes, DNA methylation levels measured in blood were equivalent in buccal cells, despite the fact that these cell types arise from different germ layers (mesoderm and ectoderm, respectively).31 But whether altered methyaltion of the CpGs studied here are causally involved in the development of obesity or simply markers of the disease state is unknown. Interestingly, FYN has been previously linked to adipocyte development and function. FYN is a member of the Src family of non-receptor tyrosine kinases and plays an important role in inflammation,32,33 adipocyte differentiation,34 energy expenditure,35 and insulin signaling.36 FYN knockout mice displayed increased glucose clearance and whole body insulin sensitivity associated with decreased adiposity resulting from increased fatty acid use and energy expenditure,37 and preferentially laid down adipose tissue in the subcutaneous, rather than the visceral, compartment and showed reduced inflammatory cell infiltration.38 FYN knockout mice also remain fully glucose-tolerant and insulin-sensitive, even on a high-fat diet. These metabolic characteristics have been suggested to result from the regulation of LKB1 and AMPK by FYN in skeletal muscle and adipose tissue.39 The methylation of the 3 FYN CpG sites measured in this study, which lie in the 5′UTR of FYN, were highly correlated, suggesting that these CpG sites may be similarly regulated. For all 3 sites, higher methylation was associated with obesity. To date, however, little is known about the role that the 5′ UTR plays in the regulation of FYN expression or the effect that methylation in this region may have on transcription.
PIWIL4, which belongs to the Argonaute protein family, exhibits a ubiquitous expression pattern in human tissues and recent studies have shown that over-expression of PIWIL4 results in a 7-fold increase in the dimethylation state of H3K9 at the first intron of the p16INK4a gene and decreased p16INK4a expression,40 suggesting that PIWIL4 may be a regulator of p16INK4a, a known regulator of adipocyte proliferation, differentiation, and senescence.41
TAOK3 activates p38, inhibits cJun NH2-terminal kinase (JNK) signaling,42 and is a member of the mitogen activated protein kinase (MAPK) cascade, affecting fundamental cellular signaling pathways. JNK and MAPK signal transduction pathways are activated by obesity and are required for obesity-induced insulin resistance.43,44 These effects have been seen in adipose, muscle, and hypothalamic tissues.44 A mouse study has shown that JNK expression by macrophages promotes obesity-induced insulin resistance.45 In humans, indirect evidence of the importance of this locus comes from a study on a French Canadian population that identified a genetic region overlapping TAOK3 that was associated with anthropometric and metabolic traits.46 Similarly to the previous 2 loci, TAOK3 has a strong biological premise for an association with obesity; however, our data provide the first evidence that methylation of a TAOK3-related CpG site may be a biomarker of obesity.
Interestingly, the methylation status of identified CpG sites within PIWIL4 and TAOK3 were negatively associated with obesity and highly correlative with each other, suggesting that the obese phenotype may be associated with a hypomethylated state. TAOK3 is involved in cellular development and growth and recent studies have also implicated PIWIL4 in regulating the expression of the cell cycle inhibitor p16INK4a, suggesting that these genes may work within the same network, which may account for the high correlation observed between the methylation status of their CpG sites.
Pathway analysis revealed an enrichment of DMCpGs in GO processes involved in developmental processes, immune system regulation, regulation of cell signaling, and small GTPase-mediated signal transduction. Enrichment of genes involved in developmental process concurs with the growing body of literature showing that obesity has a strong developmental component.47 Alterations in pathways associated with immune function are consistent with the low grade chronic inflammation characteristic of the obese state.48 Small GTPases have also been shown to play a critical role in the inflammatory response as well as cell proliferation, differentiation, and survival.49 Whether the differential methylation of CpGs within genes associated with inflammation and cell signaling is a consequence or cause of the inflammation associated with obesity is unknown at present. However, these findings do suggest that altered methylation of such sites may act to sustain inflammation associated with obesity. Caution is nevertheless required when interpreting the enrichment of inflammation and immune pathways in whole blood samples.
Other human studies have begun to demonstrate associations between epigenetic changes and obesity.50-52 Dick et al. (2014) found that methylation in the first intron of the HIF3A gene measured in blood strongly correlated with adult BMI and this result was validated across independent cohorts including obese subjects.53 Milagro et al. found differences in methylation between CLOCK and BMAL1 genes in overweight/obese patients compared to normal weight women.50 Xu et al. showed a substantial number of differentially methylated CpG sites between obese and non-obese adolescents (14–20 years old).51 Interestingly, a number of these differentially methylated CpG sites were found to be associated with genes previously linked to obesity and Type 2 Diabetes, such as FTO, GCK, HNF1A and HNF1B, PPARγ, PTEN, and TCF7L2. In a separate study, Wang et al. reported methylation changes in genes associated with inflammatory response, immune response, cytokine production, and antigen binding in obese compared to lean adoloscents.52 In our study, we investigated methylation changes associated with severe obesity in peripheral blood of children aged 6–14 years, an age group not previously examined. Differences in the age of the individuals studied, the characteristics used to define the cases, the use of DNA either from whole blood, as used here, or purified leucocytes, together with differences in the techniques used to measure “epigenome-wide” methylation status, may explain some of the differences in DMCpGs identified in these different studies. Nevertheless, a number of the DMCpGs identified in this study in children 6–14 years old were also identified in the studies by Wang et al. (TRIM3, HIPK, NOTCH4) 52 and Xu et al. (FTO, PTEN),51 who examined methylation changes associated with obesity in adolescents, suggesting similar changes in methylation are observed in relation to obesity in both age groups.
Several limitations of this study need to be recognized. First, we used a pooling strategy for the 450K array analysis. Methylation analysis on pooled genomic DNA has previously been shown to provide an accurrate estimate of DNA methylation.54,55 and effective means for identifying DNA methylation changes associated with a diseased phenotype.14,56 when DNA availibility is limited. However, pooling does prevent insights on inter-individual methylation differences. Nevertheless, our pooling strategy successfully identify 3 CpG loci that were validated by pyrosequencing in individual samples, thereby practically demonstrating that it may be a useful approach to identify robust changes associated with particular phenotypes. The second limitation to this study was that we used DNA from whole blood, which represents different cell populations with distinct epigenetic profiles. To correct for the differences in methylation resulting from differences in cellular heterogeneity, the Houseman correction was used,21 and CpGs related to the different cell populations were not taken forward for subsequent validation or pathway analysis. However, we cannot rule out the possibility that some of the differences observed in methylation between case and control groups may result from the presence of cell types not accounted for within the algorithm. Nevertheless, even if these changes do represent changes in cellular composition, our studies suggest that altered methylation of the identified CpG loci and pathways are markers of childhood obesity. The third limitation was that we only excluded the possibility of SNPs within 45 bp of the CpG influencing methylation status of the CpGs of interest, as methylated quantitative trait loci are overwhelmingly found in cis and peak enrichment for SNP to CpG distance is within 45 bp,57 however, there is a possibility that SNPs further away or in trans may mediate methylation at these sites. A strength of this study is that all the participants studied were young, between 9–14 years old, and therefore the results are less likely to be confounded by obesity comorbidities or medication use, both of which are very common in adult subjects with obesity.
In conclusion, we have identified widespread DNA methylation changes in whole blood associated with childhood obesity, providing evidence that epigenetic dysregulation is associated with obesity in children. Although further studies are required to determine the causality of such changes, the identification of such alterations may provide novel insights into the development of obesity and potential biomarkers to identify those individuals at increased risk of disease.
Materials and Methods
Cohort characteristics
Children seeking treatment for obesity at the tertiary pediatric hospital Princess Margaret Hospital for Children (PMH) outpatient department in Western Australia were recruited as obese cases. The criteria for entry were: a age- and sex-adjusted BMI Z-score greater than 2.5 with 2 additional comorbidities or a BMI Z-score greater than 3.0. BMI Z-scores were individually calculated based on the Center for Disease Control and Prevention (CDC) growth charts.58 Age- and sex-matched controls were taken from the longitudinal Childhood Growth and Development (GAD) study of Western Australia, which followed children aged 6 to 14 years at recruitment annually for 3 years.59 In this study, healthy weight controls were recruited from randomly selected primary schools in the Perth metropolitan area. The PMH Ethics Committee approved the study. Table 1 shows the characteristics of all the samples used for pyrosequencing (validation studies). Table S1 shows the cohort characteristics of the subjects whose DNA was pooled for the 450K analysis.
Infinium humanMethylation450 beadchip array
DNA was prepared from whole blood cells of 54 case and 54 control subjects using a standard phenol:chloroform extraction and ethanol precipitation, as described previously.16 Four pools of DNA from obese subjects were used (Pool 1: Males, high-fasting insulin, n = 13; Pool 2: Males, low-fasting insulin, n = 12; Pool 3: Females, high-fasting insulin, n = 14; Pool 4: Females, low-fasting insulin, n = 15). Pools from age- and sex-matched control groups were: Pool 1 Control, Males, n = 13; Pool 2 Control, Males, n = 12; Pool 3 Control, Females, n = 14; Pool 4 Control, Females, n = 15) (Table 1 and Table S1). Genomic DNA (1 ug) from each of the 8 pools was bisulphite-converted using Zymo EZ DNA Methylation-Gold kit (ZymoResearch, Irvine, California, USA, D5007) and the DNA was analyzed using the Infinium HumanMethylation450 platform (Illumina, Inc., CA, USA) by The Genome Center, Barts and London, School of Medicine and Dentistry, John Vane Science Center, Charterhouse Square, London.
Infinium HumanMethylation450 BeadChip array data processing
Signal extraction was performed in GenomeStudio™ Methylation Module on the intensity files (.idat) produced by the Illumina iSCAN system. Raw β-values were extracted from GenomeStudio without further data processing (i.e., no background subtraction or normalization). CpGs with 2 beads or less for either methylated or unmethylated signal, for any sample, or with signal detection P-values (calculated from the individual bead intensities) higher than 0.05, for any sample, were discarded for all samples. A total of 479,379 CpGs remained for further analysis. To correct for color imbalance, values were normalized to values from control probes and background subtracted. After these intra-sample normalization procedures, M-values (logit transformation) were calculated. The Type II M-value range was fitted to the Type I range, as suggested by Dedeurwaerder et al.60 β-values were then calculated. Finally, inter-sample normalization was performed by quantile normalization. This procedure has been described and benchmarked in Pan et al., 2012.61 No batch or chip effects were possible, as samples were contained within one array and processed together. We performed one pool run as a replicate of the cases and another pool run as a replicate of the controls. Pearson correlation (R) within replicates were 0.9987 and 0.9989 for case and control, respectively. Principal component analysis showed replicates were clustered together. Therefore, final β-values were averaged between replicates. The four pools of obese subjects were compared to the 4 pools of control subjects, using paired t-tests, pairing the pools by gender and insulin resistance status, to determine changes associated with obesity and independent of sex and fasting insulin levels.
Estimation of cell fractions from the methylation data
To assess the potential impact of variation in cell fraction between samples, we used R package minfi.62 to estimate the fraction of CD8T-, CD4T-, NK- and B-cells, monocytes, and granulocytes in the samples. The R package minfi allows for estimating cell fractions in Illumina 450K methylation data from whole blood (Table S3). This method is based on the methylation data published for flow-sorted cells,63 and algorithms derived from the study by Houseman et al.21
Metacore pathway analysis
The Metacore Pathway Analysis software was used to investigate whether the genes mapped to differentially methylated CpGs were enriched for specific functional relationships.
Pyrosequencing
DMCpGs were validated using sodium bisulfite pyrosequencing. Genomic DNA was prepared and bisulphite conversion was carried out using the EZ DNA Methylation-Gold kit (ZymoResearch, Irvine, California, USA; D5007). The pyrosequencing reaction was carried out using primers listed in Table S5. Modified DNA was amplified using HotStar Taq Plus DNA polymerase (Qiagen, Germany; 203605). PCR products were immobilized on streptavidin–sepharose beads (GE Healthcare UK Ltd., Amersham, Buckinghamshire, UK; GZ17511301), washed, denatured, and released into annealing buffer containing the sequencing primers. Pyrosequencing was carried out using the PyroMark Gold Q96 Reagent kit (Qiagen, Germany; 972824) on a PyroMark Q96 MD machine (Biotage, Uppsala, Sweden) and the % methylation was calculated using the Pyro Q CpG software (Biotage). Within-assay precision was between 0.8 and 1.8% and detection limits were 2–5% methylation. SNP PCR was carried out to exclude the presence of SNPs at the CpGs of interest using primers listed in Table S7. DNA was amplified using HotStar Taq Plus DNA polymerase. PCR Products were treated as for pyrosequencing. Genotyping analysis was carried out using PyroMark MD 1.0 software (Biotage). Genotyping analysis in all subjects excluded the presence of SNPs at the cytosine of all 3 DMCpGs within PIWIL4, FYN, and TAOK3. Primers and sequencing probes were also designed to exclude any known SNP.
Statistical Analysis of Pyrosequencing Data
Statistical analysis was carried out using SPSS version 21.0 (IBM). Histograms of all continuous variables were plotted to check for normality. The distributions of methylation were not normally distributed and differences in methylation were therefore calculated using the non-parametric Mann-Whitney U test. Logistic regression models were built using case control status as the outcome for each CpG. Methylation of the particular CpG and gender were entered into the model as predictors. A separate model was formulated for each CpG of interest.
Chi-Square Analysis
Analysis was carried out to determine if the distribution of hypomethylated (or hypermethylated) CpG sites was the same as the distribution of analyzed probes for each gene location (TSS200, 3′UTR, etc.) and for each gene environment (island, shore, etc.). This analysis was performed using chi-square goodness of fit tests, if appropriate, or exact tests, if 20% or more of the expected cell frequencies were lower than 5 (4 tests in total).
Disclosure of Potential Conflicts of Interest
No potential conflicts of interest were disclosed.
Funding
KAL and KMG were supported by the National Institute for Health Research through the NIHR Southampton Biomedical Research Center. KAL. KMG and GCB were also supported by the European Union's Seventh Framework Program (FP7/2007-2013), project EarlyNutrition under grant agreement n°289346. RCH is supported by a NHMRC Fellowship [grant number 1053384]. Project is supported by Princess Margaret Hospital Foundation Grant.
Supplemental Material
Supplemental data for this article can be accessed on the publisher's website.
References
- 1.de Onis M, Blossner M, Borghi E. Global prevalence and trends of overweight and obesity among preschool children. Am J Clin Nutr 2010; 92:1257-64; http://dx.doi.org/ 10.3945/ajcn.2010.29786 [DOI] [PubMed] [Google Scholar]
- 2.Daniels SR, Arnett DK, Eckel RH, Gidding SS, Hayman LL, Kumanyika S, Robinson TN, Scott BJ, Jeor S, Williams CL. Overweight in children and adolescents: pathophysiology, consequences, prevention, and treatment. Circulation 2005; 111:1999-2012; PMID:15837955; http://dx.doi.org/ 10.1161/01.CIR.0000161369.71722.10 [DOI] [PubMed] [Google Scholar]
- 3.Dietz WH. Overweight in childhood and adolescence. N Engl J Med 2004; 350:855-7; http://dx.doi.org/ 10.1056/NEJMp048008 [DOI] [PubMed] [Google Scholar]
- 4.Guo SS, Chumlea WC. Tracking of body mass index in children in relation to overweight in adulthood. Am J Clinical Nutri 1999; 70:145S-8S [DOI] [PubMed] [Google Scholar]
- 5.Freedman DS, Khan LK, Dietz WH, Srinivasan SR, Berenson GS. Relationship of childhood obesity to coronary heart disease risk factors in adulthood: the Bogalusa Heart Study. Pediatr 2001; 108:712-8; PMID:11533341; http://dx.doi.org/ 10.1542/peds.108.3.712 [DOI] [PubMed] [Google Scholar]
- 6.Freedman DS, Khan LK, Serdula MK, Dietz WH, Srinivasan SR, Berenson GS. The relation of childhood BMI to adult adiposity: the Bogalusa Heart Study. Pediatr 2005; 115:22-7; PMID:15629977 [DOI] [PubMed] [Google Scholar]
- 7.Pruess-Uestuen A, Corvalan C. How much disease burden can be prevented by environmental interventions? Epidemiol 2007; 18:167-78; http://dx.doi.org/ 10.1097/01.ede.0000239647.26389.80 [DOI] [PubMed] [Google Scholar]
- 8.Burdge GC, Lillycrop KA. Nutrition, epigenetics, and developmental plasticity: implications for understanding human disease. Annu Rev Nutr 2010; 30:315-39; PMID:20415585; http://dx.doi.org/ 10.1146/annurev.nutr.012809.104751 [DOI] [PubMed] [Google Scholar]
- 9.Bertram CE, Hanson MA. Animal models and programming of the metabolic syndrome. Br Med Bull 2001; 60:103-21; PMID:11809621; http://dx.doi.org/ 10.1093/bmb/60.1.103 [DOI] [PubMed] [Google Scholar]
- 10.Roseboom T, de RS, Painter R. The Dutch famine and its long-term consequences for adult health. Early Hum Dev 2006; 82:485-91; PMID:16876341; http://dx.doi.org/ 10.1016/j.earlhumdev.2006.07.001 [DOI] [PubMed] [Google Scholar]
- 11.O'Reilly JR, Reynolds RM. The risk of maternal obesity to the long-term health of the offspring. Clinical Endocrinol 2013; 78:9-16; http://dx.doi.org/ 10.1111/cen.12055 [DOI] [PubMed] [Google Scholar]
- 12.Catalano PM, Kirwan JP, Haugel-de Mouzon S, King J. Gestational diabetes and insulin resistance: role in short- and long-term implications for mother and fetus. J Nutri 2003; 133:1674S-83S [DOI] [PubMed] [Google Scholar]
- 13.Godfrey KM, Lillycrop KA, Burdge GC, Gluckman PD, Hanson MA. Epigenetic mechanisms and the mismatch concept of the developmental origins of health and disease. Pediatr Res 2007; 61:5R-10R; PMID:17413851; http://dx.doi.org/ 10.1203/pdr.0b013e318045bedb [DOI] [PubMed] [Google Scholar]
- 14.Toperoff G, Aran D, Kark JD, Rosenberg M, Dubnikov T, Nissan B, Wainstein J, Friedlander Y, Levy-Lahad E, Glaser B, et al.. Genome-wide survey reveals predisposing diabetes type 2-related DNA methylation variations in human peripheral blood. Human Mol Genetics 2012; 21:371-83; PMID:21994764; http://dx.doi.org/ 10.1093/hmg/ddr472 [DOI] [PMC free article] [PubMed] [Google Scholar]
- 15.Godfrey KM, Sheppard A, Gluckman PD, Lillycrop KA, Burdge GC, McLean C, Rodford J, Slater-Jefferies JL, Garratt E, Crozier SR, et al.. Epigenetic gene promoter methylation at birth is associated with child's later adiposity. Diabetes 2011; 60:1528-34; PMID:21471513; http://dx.doi.org/ 10.2337/db10-0979 [DOI] [PMC free article] [PubMed] [Google Scholar]
- 16.Clarke-Harris R, Wilkin TJ, Hosking J, Pinkney J, Jeffery AN, Metcalf BS, Godfrey KM, Voss LD, Lillycrop KA, Burdge GC. Peroxisomal proliferator activated receptor-gamma-co-activator-1alpha promoter methylation in blood at 5–7 years predicts adiposity from 9 to 14 years (EarlyBird 50). Diabetes 2014; 63(7):2528-37; PMID:24622795 [DOI] [PubMed] [Google Scholar]
- 17.Zhuang J, Peng W, Li H, Wang W, Wei Y, Li W, Xu Y. Methylation of p15INK4b and expression of ANRIL on chromosome 9p21 are associated with coronary artery disease. PloS one 2012; 7:e47193; PMID:23091611; http://dx.doi.org/ 10.1371/journal.pone.0047193 [DOI] [PMC free article] [PubMed] [Google Scholar]
- 18.McGowan PO, Sasaki A, D'Alessio AC, Dymov S, Labonte B, Szyf M, Turecki G, Meaney MJ. Epigenetic regulation of the glucocorticoid receptor in human brain associates with childhood abuse. NatNeurosci 2009; 12:342-8 [DOI] [PMC free article] [PubMed] [Google Scholar]
- 19.Brennan K, Garcia-Closas M, Orr N, Fletcher O, Jones M, Ashworth A, Swerdlow A, Thorne H, Riboli E, Vineis P, et al.. Intragenic ATM methylation in peripheral blood DNA as a biomarker of breast cancer risk. Cancer Res 2012; 72:2304-13; PMID:22374981; http://dx.doi.org/ 10.1158/0008-5472.CAN-11-3157 [DOI] [PubMed] [Google Scholar]
- 20.Jaffe AE, Irizarry RA. Accounting for cellular heterogeneity is critical in epigenome-wide association studies. Genome Biol 2014; 15:R31; PMID:24495553 [DOI] [PMC free article] [PubMed] [Google Scholar]
- 21.Houseman EA, Accomando WP, Koestler DC, Christensen BC, Marsit CJ, Nelson HH, Wiencke JK, Kelsey KT. DNA methylation arrays as surrogate measures of cell mixture distribution. BMC Bioinformatics 2012; 13:86; PMID:22568884; http://dx.doi.org/ 10.1186/1471-2105-13-86 [DOI] [PMC free article] [PubMed] [Google Scholar]
- 22.Frith MC, Saunders NF, Kobe B, Bailey TL. Discovering sequence motifs with arbitrary insertions and deletions. PLoS Computational Biol 2008. 4(5):e1000071; http://dx.doi.org/ 10.1371/journal.pcbi.1000071 [DOI] [PMC free article] [PubMed] [Google Scholar]
- 23.Irizarry RA, Ladd-Acosta C, Wen B, Wu Z, Montano C, Onyango P, Cui H, Gabo K, Rongione M, Webster M, et al.. The human colon cancer methylome shows similar hypo- and hypermethylation at conserved tissue-specific CpG island shores. Nature Genetics 2009; 41:178-86; PMID:19151715; http://dx.doi.org/ 10.1038/ng.298 [DOI] [PMC free article] [PubMed] [Google Scholar]
- 24.Ronn T, Volkov P, Davegardh C, Dayeh T, Hall E, Olsson AH, Nilsson E, Tornberg A, Dekker Nitert M, Eriksson KF, et al.. A six months exercise intervention influences the genome-wide DNA methylation pattern in human adipose tissue. PLoS Genetics 2013; 9:e1003572; PMID:23825961; http://dx.doi.org/ 10.1371/journal.pgen.1003572 [DOI] [PMC free article] [PubMed] [Google Scholar]
- 25.Shen J, Wang S, Zhang YJ, Wu HC, Kibriya MG, Jasmine F, Ahsan H, Wu DP, Siegel AB, Remotti H, et al.. Exploring genome-wide DNA methylation profiles altered in hepatocellular carcinoma using Infinium HumanMethylation 450 BeadChips. Epigenetics 2013; 8:34-43; http://dx.doi.org/ 10.4161/epi.23062 [DOI] [PMC free article] [PubMed] [Google Scholar]
- 26.Grundberg E, Meduri E, Sandling JK, Hedman AK, Keildson S, Buil A, Busche S, Yuan W, Nisbet J, Sekowska M, et al.. Global analysis of DNA methylation variation in adipose tissue from twins reveals links to disease-associated variants in distal regulatory elements. Am J Human Genetics 2013; 93:876-90; http://dx.doi.org/ 10.1016/j.ajhg.2013.10.004 [DOI] [PMC free article] [PubMed] [Google Scholar]
- 27.Kowalczyk MS, Hughes JR, Garrick D, Lynch MD, Sharpe JA, Sloane-Stanley JA, McGowan SJ, De Gobbi M, Hosseini M, Vernimmen D, et al.. Intragenic enhancers act as alternative promoters. Mol Cell 2012; 45:447-58; PMID:22264824; http://dx.doi.org/ 10.1016/j.molcel.2011.12.021 [DOI] [PubMed] [Google Scholar]
- 28.Roessler J, Ammerpohl O, Gutwein J, Hasemeier B, Lukman S, Kreipe H, Lehmann U. Quantitative cross-validation and content analysis of the 450k DNA methylation array from Illumina, Inc. BMC Res Notes 2012; 5:210; PMID:22546179; http://dx.doi.org/ 10.1186/1756-0500-5-210 [DOI] [PMC free article] [PubMed] [Google Scholar]
- 29.Benton MC, Johnstone A, Eccles D, Harmon B, Hayes MT, Lea RA, Griffiths L, Hoffman EP, Stubbs RS, Macartney-Coxson D. An analysis of DNA methylation in human adipose tissue reveals differential modification of obesity genes before and after gastric bypass and weight loss. Genome Biol 2015; 16:8; PMID:25651499; http://dx.doi.org/ 10.1186/s13059-014-0569-x [DOI] [PMC free article] [PubMed] [Google Scholar]
- 30.Murphy SK, Huang Z, Hoyo C. Differentially methylated regions of imprinted genes in prenatal, perinatal and postnatal human tissues. PloS One 2012; 7:e40924; PMID:22808284; http://dx.doi.org/ 10.1371/journal.pone.0040924 [DOI] [PMC free article] [PubMed] [Google Scholar]
- 31.Talens RP, Boomsma DI, Tobi EW, Kremer D, Jukema JW, Willemsen G, Putter H, Slagboom PE, Heijmans BT. Variation, patterns, and temporal stability of DNA methylation: considerations for epigenetic epidemiology. FASEB J 2010; 24:3135-44; PMID:20385621; http://dx.doi.org/ 10.1096/fj.09-150490 [DOI] [PubMed] [Google Scholar]
- 32.Gadue P, Morton N, Stein PL. The Src family tyrosine kinase Fyn regulates natural killer T cell development. J Exp Med 1999; 190:1189-96; http://dx.doi.org/ 10.1084/jem.190.8.1189 [DOI] [PMC free article] [PubMed] [Google Scholar]
- 33.Parravicini V, Gadina M, Kovarova M, Odom S, Gonzalez-Espinosa C, Furumoto Y, Saitoh S, Samelson LE, O'Shea JJ, Rivera J. Fyn kinase initiates complementary signals required for IgE-dependent mast cell degranulation. Nature Immunol 2002; 3:741-8 [DOI] [PubMed] [Google Scholar]
- 34.Tse MC, Liu X, Yang S, Ye K, Chan CB. Fyn regulates adipogenesis by promoting PIKE-A/STAT5a interaction. Mol Cell Biol 2013; 33:1797-808; PMID:23438599; http://dx.doi.org/ 10.1128/MCB.01410-12 [DOI] [PMC free article] [PubMed] [Google Scholar]
- 35.Yamada E, Pessin JE, Kurland IJ, Schwartz GJ, Bastie CC. Fyn-dependent regulation of energy expenditure and body weight is mediated by tyrosine phosphorylation of LKB1. Cell Metabolism 2010; 11:113-24; PMID:20142099; http://dx.doi.org/ 10.1016/j.cmet.2009.12.010 [DOI] [PMC free article] [PubMed] [Google Scholar]
- 36.Sun XJ, Pons S, Asano T, Myers MG Jr., Glasheen E, White MF. The Fyn tyrosine kinase binds Irs-1 and forms a distinct signaling complex during insulin stimulation. J Biol Chem 1996; 271:10583-7; http://dx.doi.org/ 10.1074/jbc.271.18.10583 [DOI] [PubMed] [Google Scholar]
- 37.Lee TW, Kwon H, Zong H, Yamada E, Vatish M, Pessin JE, Bastie CC. Fyn deficiency promotes a preferential increase in subcutaneous adipose tissue mass and decreased visceral adipose tissue inflammation. Diabetes 2013; 62:1537-46; PMID:23321073; http://dx.doi.org/ 10.2337/db12-0920 [DOI] [PMC free article] [PubMed] [Google Scholar]
- 38.Lee TWA, Kwon H, Zong HH, Yamada E, Vatish M, Pessin JE, Bastie CC. Fyn Deficiency Promotes a Preferential Increase in Subcutaneous Adipose Tissue Mass and Decreased Visceral Adipose Tissue Inflammation. Diabetes 2013; 62:1537-46; PMID:23321073; http://dx.doi.org/ 10.2337/db12-0920 [DOI] [PMC free article] [PubMed] [Google Scholar]
- 39.Yamada E, Lee TW, Pessin JE, Bastie CC. Targeted therapies of the LKB1/AMPK pathway for the treatment of insulin resistance. Future Med Chem 2010; 2:1785-96; PMID:21428801; http://dx.doi.org/ 10.4155/fmc.10.264 [DOI] [PMC free article] [PubMed] [Google Scholar]
- 40.Sugimoto K, Kage H, Aki N, Sano A, Kitagawa H, Nagase T, Yatomi Y, Ohishi N, Takai D. The induction of H3K9 methylation by PIWIL4 at the p16(Ink4a) locus. Biochemical Biophysical Research Communications 2007; 359:497-502; PMID:17544373; http://dx.doi.org/ 10.1016/j.bbrc.2007.05.136 [DOI] [PubMed] [Google Scholar]
- 41.Overhoff MG, Garbe JC, Koh J, Stampfer MR, Beach DH, Bishop CL. Cellular senescence mediated by p16INK4A-coupled miRNA pathways. Nucleic Acids Res 2013; 42(3):1606-18; PMID:24217920 [DOI] [PMC free article] [PubMed] [Google Scholar]
- 42.Kapfhamer D, King I, Zou ME, Lim JP, Heberlein U, Wolf FW. JNK Pathway Activation Is Controlled by Tao/TAOK3 to Modulate Ethanol Sensitivity. Plos One 2012; 7:e50594; PMID:23227189; http://dx.doi.org/ 10.1371/journal.pone.0050594 [DOI] [PMC free article] [PubMed] [Google Scholar]
- 43.Sabio G, Kennedy NJ, Cavanagh-Kyros J, Jung DY, Ko HJ, Ong H, Barrett T, Kim JK, Davis RJ. Role of Muscle c-Jun NH2-Terminal Kinase 1 in Obesity-Induced Insulin Resistance. Mol Cell Biol 2010; 30:106-15; PMID:19841069; http://dx.doi.org/ 10.1128/MCB.01162-09 [DOI] [PMC free article] [PubMed] [Google Scholar]
- 44.Crunkhorn S, Dearie F, Mantzoros C, Gami H, da Silva WS, Espinoza D, Faucette R, Barry K, Bianco AC, Patti ME. Peroxisome proliferator activator receptor gamma coactivator-1 expression is reduced in obesity - Potential pathogenic role of saturated fatty acids and p38 mitogen-activated protein kinase activation. J Biol Chem 2007; 282:15439-50; PMID:17416903; http://dx.doi.org/ 10.1074/jbc.M611214200 [DOI] [PubMed] [Google Scholar]
- 45.Han MS, Jung DY, Morel C, Lakhani SA, Kim JK, Flavell RA, Davis RJ. JNK Expression by Macrophages Promotes Obesity-Induced Insulin Resistance and Inflammation. Science 2013; 339:218-22; PMID:23223452; http://dx.doi.org/ 10.1126/science.1227568 [DOI] [PMC free article] [PubMed] [Google Scholar]
- 46.Seda O, Tremblay J, Gaudet D, Brunelle PL, Gurau A, Merlo E, Pilote L, Orlov SN, Boulva F, Petrovich M, et al.. Systematic, genome-wide, sex-specific linkage of cardiovascular traits in french Canadians. Hypertension 2008; 51:1156-62; PMID:18259002; http://dx.doi.org/ 10.1161/HYPERTENSIONAHA.107.105247 [DOI] [PubMed] [Google Scholar]
- 47.Desai M, Beall M, Ross MG. Developmental Origins of Obesity: Programmed Adipogenesis Curr Diab Rep. 2013. 13:27-33; PMID:23188593 [DOI] [PMC free article] [PubMed] [Google Scholar]
- 48.Emanuela F, Grazia M, Marco de R, Maria Paola L, Giorgio F, Marco B. Inflammation as a Link between Obesity and Metabolic Syndrome. J Nutr Metab 2012; 2012:476380; http://dx.doi.org/ 10.1155/2012/476380 [DOI] [PMC free article] [PubMed] [Google Scholar]
- 49.Hancock JF. Ras proteins: different signals from different locations. Nat Rev Mol Cell Biol 2003; 4:373-84; PMID:12728271; http://dx.doi.org/ 10.1038/nrm1105 [DOI] [PubMed] [Google Scholar]
- 50.Milagro FI, Campion J, Cordero P, Goyenechea E, Gomez-Uriz AM, Abete I, Zulet MA, Martinez JA. A dual epigenomic approach for the search of obesity biomarkers: DNA methylation in relation to diet-induced weight loss. Faseb J 2011; 25:1378-89; PMID:21209057; http://dx.doi.org/ 10.1096/fj.10-170365 [DOI] [PubMed] [Google Scholar]
- 51.Xu X, Su S, Barnes VA, De Miguel C, Pollock J, Ownby D, Shi H, Zhu H, Snieder H, Wang X. A genome-wide methylation study on obesity: Differential variability and differential methylation. Epigenetics 2013; 8:522-33; http://dx.doi.org/ 10.4161/epi.24506 [DOI] [PMC free article] [PubMed] [Google Scholar]
- 52.Wang X, Zhu H, Snieder H, Su S, Munn D, Harshfield G, Maria BL, Dong Y, Treiber F, Gutin B, et al.. Obesity related methylation changes in DNA of peripheral blood leukocytes. BMC Med 2010; 8:87. [DOI] [PMC free article] [PubMed] [Google Scholar]
- 53.Dick KJ, Nelson CP, Tsaprouni L, Sandling JK, Aissi D, Wahl S, Meduri E, Morange PE, Gagnon F, Grallert H, et al.. DNA methylation and body-mass index: a genome-wide analysis. Lancet 2014; 383(9933):1990-8; PMID:24630777 [DOI] [PubMed] [Google Scholar]
- 54.Docherty SJ, Davis OS, Haworth CM, Plomin R, Mill J. Bisulfite-based epityping on pooled genomic DNA provides an accurate estimate of average group DNA methylation. Epigenetics Chromatin 2009; 2:3; PMID:19284538; http://dx.doi.org/ 10.1186/1756-8935-2-3 [DOI] [PMC free article] [PubMed] [Google Scholar]
- 55.Docherty SJ, Davis OS, Haworth CM, Plomin R, Mill J. DNA methylation profiling using bisulfite-based epityping of pooled genomic DNA. Methods 2010; 52, 255-8; PMID:20599507; http://dx.doi.org/ 10.1016/j.ymeth.2010.06.017 [DOI] [PubMed] [Google Scholar]
- 56.Nardone S, Sama DS, Reuveni E, Getselter D, Oron O, Karpuj M, Elliott E. DNA methylation analysis of the autistic brain reveals multiple dysregulated biological pathways. Transl Psychiatry 2014; 4:e433; PMID:25180572; http://dx.doi.org/ 10.1038/tp.2014.70 [DOI] [PMC free article] [PubMed] [Google Scholar]
- 57.Gibbs JR., van der Brug MP, Hernandez DG, Traynor BJ, Nalls MA, Lai SL, Arepalli S,Dillman A, Rafferty IP, Troncoso J, et al.. Abundant Quantitative Trait Loci Exist for DNA Methylation and Gene Expression in Human Brain. PLoS Genet 2010; 6:e1000952; PMID:20485568; http://dx.doi.org/ 10.1371/journal.pgen.1000952 [DOI] [PMC free article] [PubMed] [Google Scholar]
- 58.Ogden CL, Kuczmarski RJ, Flegal KM, Mei Z, Guo S, Wei R, Grummer-Strawn LM, Curtin LR, Roche AF, Johnson CL. Centers for Disease Control and Prevention 2000 growth charts for the United States: Improvements to the 1977 National Center for Health Statistics version. Pediatr 2002; 109:45-60; PMID:11773541; http://dx.doi.org/ 10.1542/peds.109.1.45 [DOI] [PubMed] [Google Scholar]
- 59.Suriano K, Curran J, Byrne SM, Jones TW, Davis EA. Fatness, Fitness, and Increased Cardiovascular Risk in Young Children. J Pediatr 2010; 157:552-8; PMID:20542285; http://dx.doi.org/ 10.1016/j.jpeds.2010.04.042 [DOI] [PubMed] [Google Scholar]
- 60.Dedeurwaerder S, Defrance M, Calonne E, Denis H, Sotiriou C, Fuks F. Evaluation of the Infinium Methylation 450K technology. Epigenomics 2011; 3,:771-84; PMID:22126295; http://dx.doi.org/ 10.2217/epi.11.105 [DOI] [PubMed] [Google Scholar]
- 61.Pan H, Chen L, Dogra S, Teh AL, Tan JH, Lim YI, Lim YC, Jin S, Lee YK, Ng PY, et al.. Measuring the methylome in clinical samples: improved processing of the Infinium Human Methylation450 BeadChip Array. Epigenetics 2012; 7:1173-87; http://dx.doi.org/ 10.4161/epi.22102 [DOI] [PMC free article] [PubMed] [Google Scholar]
- 62.Aryee MJ, Jaffe AE, Corrada-Bravo H, Ladd-Acosta C, Feinberg AP, Hansen KD, Irizarry RA. Minfi: a flexible and comprehensive Bioconductor package for the analysis of Infinium DNA methylation microarrays. Bioinformatics 2014. 30(10):1363-9; PMID:24478339 [DOI] [PMC free article] [PubMed] [Google Scholar]
- 63.Reinius LE, Acevedo N, Joerink M, Pershagen G, Dahlen SE, Greco D, Soderhall C, Scheynius A, Kere J. Differential DNA methylation in purified human blood cells: implications for cell lineage and studies on disease susceptibility. PLoS One 2012; 7:e41361; PMID:22848472; http://dx.doi.org/ 10.1371/journal.pone.0041361 [DOI] [PMC free article] [PubMed] [Google Scholar]
Associated Data
This section collects any data citations, data availability statements, or supplementary materials included in this article.