

Abstract
The relationship between DNA methylation and gene expression is complex and elusive. To further elucidate these relations, we performed an integrative analysis of the methylome and transcriptome of 4 circulating immune cell subsets (B cells, monocytes, CD4+, and CD8+ T cells) from healthy females. Additionally, in light of the known sex bias in the prevalence of several immune-mediated diseases, the female datasets were compared with similar public available male data sets. Immune cell-specific differentially methylated regions (DMRs) were found to be highly similar between sexes, with an average correlation coefficient of 0.82; however, numerous sex-specific DMRs, shared by the cell subsets, were identified, mainly on autosomal chromosomes. This provides a list of highly interesting candidate genes to be studied in disorders with sexual dimorphism, such as autoimmune diseases. Immune cell-specific DMRs were mainly located in the gene body and intergenic region, distant from CpG islands but overlapping with enhancer elements, indicating that distal regulatory elements are important in immune cell specificity. In contrast, sex-specific DMRs were overrepresented in CpG islands, suggesting that the epigenetic regulatory mechanisms of sex and immune cell specificity may differ. Both positive and, more frequently, negative correlations between subset-specific expression and methylation were observed, and cell-specific DMRs of both interactions were associated with similar biological pathways, while sex-specific DMRs were linked to networks of early development or estrogen receptor and immune-related molecules. Our findings of immune cell- and sex-specific methylome and transcriptome profiles provide novel insight on their complex regulatory interactions and may particularly contribute to research of immune-mediated diseases.
Keywords: DNA methylation, epigenetics, immune cell subsets, immune mediated diseases, regulation of RNA expression, sex
Introduction
DNA methylation (DNAm) is an epigenetic mechanism linking genetics and the environment. The addition of a methyl group to a cytosine base within a CpG dinucleotide producing 5-methylcytosine (5mC) has mainly been associated with decreased gene expression, while the oxidation of 5mC to 5-hydroxymethylcytosine (5hmC) by Tet enzymes has been suggested to promote demethylation and thus to increase gene expression.1,2 Today, accumulating data have shown that the relationship between 5mC, 5hmC, and gene expression is far more complex, and depends upon the density and specific location of the CpGs.3,4 It is estimated that the human genome contains about 30 million methylated CpG dinucleotide sites, of which 70–80% are methylated.5 CpG islands (CGIs) are genomic regions characterized by a CpG dinucleotide content of at least 60% and are often, but not exclusively, located upstream transcription start sites (TSSs).4,6 Hypermethylated promoter CGIs are found mainly in long-term suppressed genes and are maintained throughout life. These include genes expressed only during early development, imprinted genes, or genes on the inactive X chromosome.4,7 In contrast to promoter CGI hypermethylation, gene body CGIs methylation has been associated with active genes and associated with tissue-specific methylation.4,8 Methylation of intragenic and gene body CGIs could play a role in the regulation of alternative or orphan promoters,4,8-10 and gene body methylation has also been suggested to be involved in exon recognition and alternative splicing mechanisms.11,12 The unclear gene annotation of intergenic CpG regions leaves their functional role unknown. In the last few years, additional CpG elements have been defined according to their distance from CGIs: northern and southern shore, northern and southern shelves, and open sea. CpG shores are located within 2 kb from CGIs and are variable and dynamic regions that have been shown to be involved in tissue specificity.5,13,14 CpG shelves are defined as occurring 2-4 kb from CGIs, while open sea are regions >4 kb from CGIs. CpG shelves may also be associated with tissue specific methylation,15 while differentially methylated regions (DMRs) associated with disease have frequently been detected in open sea CpGs.16-18
Accumulating evidence points to altered DNAm patterns serving a critical role in development, differentiation, aging, autoimmune diseases, and cancer.13,19-21 High rates of hyper- and hypo-methylation as a function of age have been shown in mice and human,22 and aberrant methylation of promoter CpG islands was associated with silencing of tumor suppressor genes and may be a risk factor for cancer.13,18 Sexual dimorphism is established early in development and reinforced in adults by hormonal regulation, which is in part regulated by DNA methylation.23-25 Sex is a known factor affecting the methylation pattern mainly on the X chromosome, but also on autosomal chromosomes.26,27 The general prevalence, course, and severity of several diseases, including autoimmune diseases, are higher in females compared to males.23,28,29 This sex bias could be due to sex-specific hormones or to differences between male and female immune responses.28 Females have been shown to produce stronger humoral and cellular immune responses to antigen than males, suggesting that this increased immune reactivity makes women more prone to develop autoimmune diseases.30,31 In line with the above, systematic mapping of genomic regions, which are differentially methylated between males and females, might highlight CpG sites that are more likely to be associated with autoimmune diseases.
Peripheral blood mononuclear cells (PBMCs) are easily accessible in humans and therefore commonly used for biomarkers detection both in clinical practice and in research. PBMCs are a mixture of different immune cell subsets, each characterized by a distinct functional role.8 Since DNA methylation and gene expression patterns are cell type specific, this specificity may be masked within the PBMCs mixture.3,32 Immune cell frequencies can be altered in disease states and in response to therapeutic agents and these might complicate proper interpretation of methylation results in health and disease.3,32,33 It is therefore critical to generate genomic and methylomic datasets from purified cell subsets. In the current study, we determined cell-specific expression and DNAm patterns of PBMCs and 4 circulating immune cell subsets: B cells, monocytes, CD4+Foxp3− and CD8+ T cells and identified the location of cell-specific CpG methylation. We demonstrated the unique profile of each immune cell subset and the value of working with purified cell subsets. We defined the correlation between DNA methylation and gene expression profiles of these subsets and characterized the relation between methylation status, correlation direction, and CpG location, as well as possible functionality using pathway analysis. We compared immune cell methylation patterns of males and females, and found that while cell subset-specific profiles were highly similar between males and females, sex-specific methylation patterns, mostly shared in all subsets, could be found. These data sets can be used as baseline reference for studying the role of abnormal methylation in immune-mediated diseases, as well as data for studying the complex role of DNA methylation in gene regulation.
Results
Distinct expression and methylation profiles characterize each immune cell subset
The expression and methylation profiles of immune cell-subsets and PBMCs from 5 healthy Caucasian females, age 30-52 y (average age 41 y), were acquired using HumanHT-12 for expression and HumanMethylation450 for methylation. Details on healthy donors are found in Table S1. Variance component analysis revealed that most of the variance was contributed by cell subset distinctiveness (∼70%) and an additional 18% of the variance was due to differences between donors (Figs. S1, S2). The similarity between samples and distinction between cell subsets can be visualized in Figure 1A–B for expression and methylation, respectively. Monocytes and B cells create distinct clusters, both in transcription and in methylation pattern, while CD4+ and CD8+ T cells overlap, suggesting high similarity between the 2 T cell subsets, despite their diverse functional roles (Fig. 1A–B). Interestingly, PBMCs methylation pattern overlaps with CD4+ and CD8+ T cells (Fig. 1B), most likely reflecting the T cell abundance within PBMCs, whereas PBMCs expression pattern forms a distinct group (Fig. 1A), suggesting that the final cell subset-specific pattern of gene activation is more defined.
Figure 1.
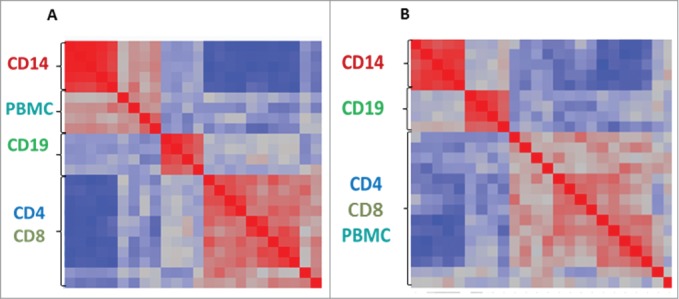
Expression and methylation patterns are distinct between different immune cell subsets. Heat plot correlation diagrams of expression (A) and methylation (B) patterns of 4 different immune subsets (CD14, CD4, CD8, and CD19) and whole PBMCs from 5 healthy females. Clustering of samples is based on similarity, with red to blue color scale indicating high to low similarity, respectively. Name of cell subset sample appears next to the plot.
Gene expression and DNA methylation validation of immune cell subset-specific genes confirmed BeadChip results
One way analysis of variance (ANOVA) was used to identify differentially expressed genes (DEGs) between subsets with a ≥1.6-fold change in expression at an adjusted P-value < 0.05 after FDR correction. Monocytes had the largest number of DEGs (1878 specific transcripts), followed by B cells with 415 DEGs, while there were only 66 DEGs in the CD4+ T cell subset, and 107 in the CD8+ T cell subset (Table 1). Similarly, differentially methylated genes (DMGs) between cell subsets were identified using a cut-off of an adjusted P-value <0.05 combined with ≥15% difference in methylation β-values. About 7747 DMGs were found in monocytes, 3141 in B cells, while only 875 DMGs were found in the CD4+ subset and 853 DMGs in the CD8+ T cell subset (Table 1). A complete list of immune cell subset DEGs and DMGs can be found in Tables S2-S5 for expression and Tables S6-S9 for methylation. These numbers are consistent with the results of the descriptive analysis presented in the previous paragraph. The relatively large numbers of DEGs and DMGs found in monocytes most likely reflect the distance between the myeloid and the lymphoid lineages, whereas the low numbers found in CD4+ and CD8+ cells reflect their closeness within the lymphoid lineage.
Table 1.
Number of immune cell-specific DEGs and DMGs per immune cell subset in female and male3 data sets
| Sex | DMG/DEG | CD8+ T cells | CD4+ T cells | B cells | Monocyte |
|---|---|---|---|---|---|
| Female | DEG | 107 | 66 | 415 | 1878 |
| Male | DEG | 363 | 155 | 638 | 2484 |
| Female | DMG | 834 | 854 | 2983 | 6750 |
| Male | DMG | 1946 | 1303 | 1550 | 9330 |
DEGs were defined as transcripts with a ≥ 1.6-fold change of expression; DMRs were defined as ≥15% difference in methylation β-values, both at a ≤0.05 FDR adjusted P-value.
As proof of concept, 42 cell-specific DEGs were validated by RT-PCR using a microfluidic device (http://www.fluidigm.com/) (Fig. 2A). DEGs showing large difference in expression were selected from each subset, and included both known cell-specific genes, such as the monocyte-specific CD14+ and the B cell-specific BANK1, but also less known transcripts, such as VAV1 in monocytes or AXIN2 in CD4+ T cells. In addition to the female RNA samples previously used in the microarray experiment, RNA from 4 immune cell subsets was collected from 6 healthy, Caucasian males, age-matched to our female group (average age 41.3 y; details in Table S1) and included in the RT-PCR assay, in order to determine if these cell-specific DEGs were shared by both sexes. As can be visualized by the heat plot, samples from both sexes clustered together according to cell subset, thus confirming the subset specificity of all 42 genes selected, while no sex differences were detected. The negative control RPL4 was non-cell-specific, as expected.
Figure 2.

Validation of cell specific genes confirmed BeadChip results with no significant difference between males and females. Heat plots presenting average RNA expression (A) and DNA methylation (B) with gene names on the Y-axis and cell subsets on the X-axis. (A) The subset-specific expression level of 42 selected subset-specific DEGs was validated in immune cell samples from 5 healthy females, previously analyzed by the BeadArray, and additional RNA samples obtained from 6 healthy males by RT-PCR; the average relative quantification 2−ΔΔCT of each subset is presented. RPL4 was used as a non-subset-specific negative control. Red color indicates increased expression and blue indicates decreased expression in the specific cell subset. (B) The methylation level of 3-5 CpGs within 9 cell subset-specific DMGs was evaluated in immune cell samples from 5 healthy females using the TBS method, and average methylation percentage of each cell subset presented. Red color indicates increased methylation and blue indicates decreased methylation in the specific cell subset. (C) A heat plot presenting differences in methylation level between immune cell subset samples in the BeadArray data set from the 5 females and similar public data from 6 males3. Plot shows 2-way unsupervised clustering of methylation β difference, with red indicating increased methylation and blue indicating decreased methylation between the 2 cell subsets compared (M: male, F: female, followed by the names of cell subsets compared). Cell subset-specific CpG identifier can be found in Tables S6-S9.
For the validation of methylation results, a novel assay that combines target bisulfite amplification with next generation sequencing was developed and named Target Bisulfite Sequencing (TBS) (details in the Methods section). Nine cell subset-specific DMGs with multiple differentially methylated CpG sites (≥3) were selected with one to 2 amplicons per gene. These nine genes were also included in the qRT-PCR validation presented above and showed inverted correlation between expression and methylation in the BeadArray experiments. Since no difference in expression between males and females was found in the selected subset-specific genes, only the female DNA samples were used in the TBS validation assay. Average methylation percentage was calculated as the number of cytosine sequenced in a specific position after bisulfite conversion, out of the total number of sequences for each sample. The average methylation of 3 to 5 representative DMRs per cell subset are presented in Figure 2B as a heat plot, confirming the cell subset-specificity of each DMG. The methylation percentages we calculated based on the BeadArray (Tables S6–S9) and on the TBS results (data not shown) were found to be remarkably similar, despite the differences in the assay biochemistry and methodology. The numbers of validated genes are a fraction of the cell subset DMRs identified by the BeadArray and the complete list can be found in Tables S6–S9.
Immune cell subset-specific DMGs are not associated with distinct sex-specific patterns
In order to compare our datasets with similar data sets and to identify any sex-specific differences, we downloaded, from ArrayExpress (http://www.ebi.ac.uk/arrayexpress/), public available immune cell subset gene expression (GEX) and methylation datasets generated from 6 healthy Caucasian males, aged 36–51 y (average age 45 y), non-smokers, hence age- and ethnicity-matched to our female samples.3 By performing the same analysis, we created one list of male cell subset-specific for DEGs and another for DMGs. However, due to the different platforms used for GEX data generation, Affymetrix versus Illumina, expected to distort results, only the methylomes (performed on the same Illumina platform) were compared.34,35 The numbers of DEGs and DMGs from the male public data set are presented in Table 1, together with our female analysis. The larger numbers of DEGs and DMGs obtained in the male datasets most properly reflect better power (data set based upon 6 males vs. 5 females); however, the relative number of DEGs and DMGs between the subsets was quite similar to the results from females, with the highest number of cell-specific DEGs or DMGs found in monocytes. The male list of cell subset-specific DMGs was highly similar to the female DMR list, as can be visualized in Figure 2C. Correlation levels between male and female cell subset-specific DMR lists were calculated using Pearson correlation. The correlation between the 2 lists was 90% for monocytes, 77% for B cells, 83% for CD4+ T cells, and 81% for CD8+ T cells. We suspect the lower correlation in B cells reflects a relatively low purification of B cells in the male samples (73%), as reported by the authors,3 compared to 95% purity of B cells in our female samples (Table S1). This comparison of the 2 datasets indicates that immune cell-specific methylation is highly alike in males and females. Moreover, the ability to reproduce highly comparable results in a second data set increases the confidence in the validity of the analysis, and indicates that technical artifacts, such as batch effect, which might distort results, have a marginal effect on current results.
A significant enrichment of cell-specific DMGs was found in the gene body and open sea
The interactions between methylation and transcription are complex and seem to depend upon location and density of CpGs involved. Using the bead chip annotation file, the distribution of CpG sites (%) according to location (promoter, 5′UTR, 1st Exon, Body, 3′UTR, and intergenic regions) was compared between total CpG sites and cell subset-specific DMGs; results are presented in Figure 3A and summarized in Table 2. Enrichment in subset-specific DMGs was found in the gene body, 42% versus 33% of the total CpG sites, while less than expected DMGs were found in the promoter, 16% vs. 25% of the total CpG sites. This suggests that cell subset-specific DMGs within the gene body could have an important role in regulating specific immune cell transcription and, possibly, function. A similar analysis of the percentage of CpGs according to their distance from CGIs [island, shores (north and south), shelves (north and south), and open sea] between cell subset-specific DMGs and the total CpG sites are presented in Figure 3B and summarized in Table 2. Cell subset-specific DMGs were enriched in the shores, shelves, and especially open sea, while decreased in CGIs (25%, 14%, 55%, and 7% versus 23%, 10%, 36%, and 31% of the total CpG sites, respectively), suggestive of an important role of non-CGIs in distinction of immune cells. Furthermore, under-representation of DMGs in promoter CGIs, while overrepresentation in gene body CGIs was found (8.8% vs. 36.3% and 57.5% versus 25.4% of the total CpG sites, respectively) (Fig. 3C and Table 2), implying a different functional role for CGIs depending on genomic location. We downloaded an enhancers annotation list from a Broad Institute portal (http://www.broadinstitute.org/pubs/finemapping/?q=data-portal)36 and crossed with our cell subsets DMGs list. We found a significant enrichment of cell subset DMGs within enhancer elements of 75% vs. 64% of the total CpG sites (Table 2), suggesting that distal regulatory elements might be important for differentiation and regulation of immune cells. While CpGs can be divided into hypomethylated, partially methylated, or hypermethylated CpGs, most studies have been focused upon the interactions between hypermethylation or hypomethylation and transcription, especially in the well-known context of hypermethylated CGIs in the promoter region, associated with gene inactivation, or hypomethylated CGIs, associated with gene activation. In the current study, both hypomethylated and hypermethylated DMGs were mainly found within the gene body (32–51%) and open sea (50–59%) (Fig. S3B–C), with hypomethylated DMGs more frequent than hypermethylated DMGs (Fig. S3A). In CD8+ and CD4+ cells, the relative proportion of hypermethylated DMGs in the gene body was lower compared to other cell subsets (Fig. S3B). In CD4+ cells, a relatively lower proportion of hypomethylated DMGs were found within CGIs, while a relatively higher proportion was found in the open sea, compared to the other subsets (Fig. S3C). This indicates that each immune cell subset-specific methylome is comprised of a pattern of both specific hypo- and hyper-methylated CpGs, mainly located in non-CGIs within the intra- and inter-genic regions.
Figure 3.
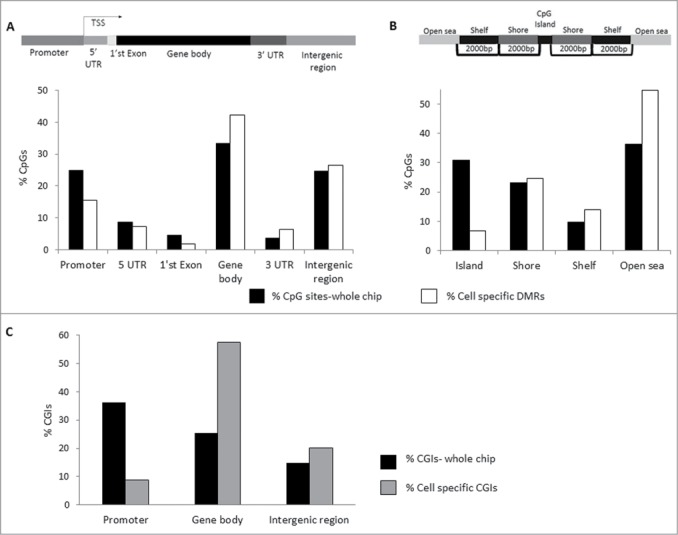
Immune cell subset-specific DMRs are mainly located in the gene body and mostly found in non-CGI regions. The genomic location of the cell subset-specific DMRs (described in Tables S6-S9) from 4 different immune subsets in 5 healthy females was analyzed and compared to the total CpG cover on chip. (A) Genomic location of CpGs defined as promoter, 5′ UTR, 1st Exon, Gene Body, 3′ UTR, and intergenic region. The percentages of total CpG sites scanned (black) and of cell subset-specific DMRs (white) within each genomic location are presented. (B) Distribution of CpG positions relative to CGI: Island, Shore, Shelf, and Open Sea. The percentages of total CpG sites scanned (black) and of cell subset-specific DMRs (white) relative to CpG position are presented. (C) The percentages of total CGIs scanned (black) and of cell subset-specific CGIs (gray) are presented in 3 genomic regions: promoter, gene body, and intergenic region.
Table 2.
Summary of location and enrichment of cell subset- and sex-specific DMGs
| DMRs | Promoter | Gene body | Enhancer | CGIs | Open sea | |
|---|---|---|---|---|---|---|
| Immune cell subset-specific | DMRs | 16% versus 25% of total CpG sites (reduced) | 42% versus 33% of total CpG sites (enriched) | 75% versus 64% of total CpG sites (enriched) | 7% versus 31% of total CpG sites (reduced) | 55% versus 36% of total CpG sites (enriched) |
| % DMGs of negatively correlated DEG-DMG pairs | 27% | 47% | ||||
| % DMGs of positively correlated DEG-DMG pairs | 12% | 70% | ||||
| Sex-specific | DMGs | 20% versus 25% of total CpG sites (reduced) | 36% versus 33% of total CpG sites (no change) | 60% versus 64% of total CpG sites (no change) | 38% versus 31% of total CpG sites (enriched) | 31% versus 36% of total CpG sites (reduced) |
Percentage of DMGs in a specific location, compared to the total CpG sites scanned by the chip in the location. We defined a difference ≥ 5% as enrichment or reduction.
Percentage of DMGs in the promoter or gene body out of correlated DEG-DMG pairs (other locations not included)
The genomic distribution of negative and positive correlations between immune cell subset-specific methylome and transcriptome
It is well accepted today that DNAm has several functional roles; however, its main function remains being the regulation of gene expression, with a negative correlation between expression and methylation being the more common outcome. The relation between gene expression and methylation was evaluated by merging the DMGs and DEGs datasets for each cell subset using the gene symbol as a common field. This procedure was performed for both the male and female data sets and the number of both negatively as well as positively DMG-DEG pairs determined. The number of correlating genes was surprisingly small, especially in CD4+ and CD8+ cell subsets (Fig. 4A); hence, only CD14+ and CD19+ data are presented in Figure 4B–C. The low number of correlating genes may be due to incomplete annotation of CpGs, such as open sea CpGs without association to defined transcripts, to transcripts not included in the GEX chip, such as srRNA, or to the simple method used to combine the 2 datasets by gene ID. For some of our correlated pairs, such as AXIN2 and CD82, the correlation between expression and methylation has previously been described37,38; however, for most pairs, such as CD93 and KLRD1, the correlation is novel (a complete list of correlating genes can be found in Table S10). Approximately 70% of the positively correlated, but less than 50% of negatively correlated, DMG-DEG pairs were located within the gene body, while in the promoter the numbers were ∼12% and ∼27%, respectively, supporting our previous results on the importance of DNA methylation within the gene body (Fig. 4B). Negative correlation between hypomethylated DMG-DEG pairs was more frequent (Fig. 4A, C), but positive correlations, of either hypomethylated and silenced genes or hypermethylated and active genes, could be observed in all subsets (Fig. 4A, C). Our results support the considerable evidence of a negative correlation between hypomethylation and gene activation; we found that this is observed in similar proportion in the promoter and gene body genomic regions. In addition, the number of positive correlated pairs was noteworthy; however, these interactions were observed mainly in the gene body.
Figure 4.
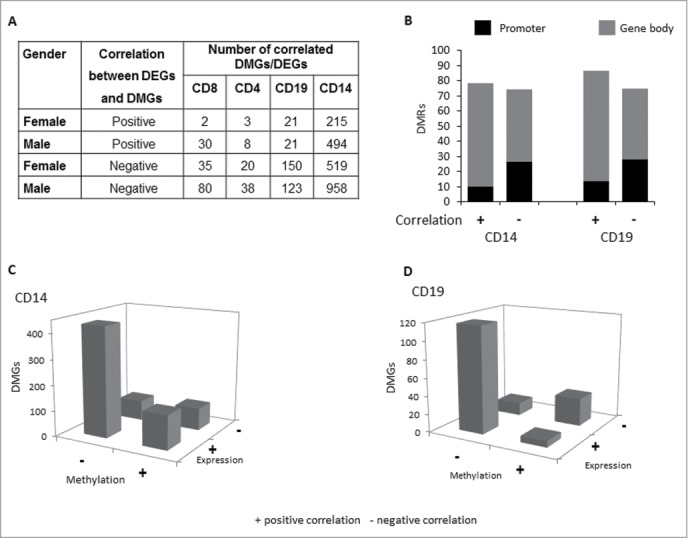
Hypomethylated DMGs negatively correlate with DEGs in all subsets. (A) Table presenting the number of negative and positive correlated DMG-DEG pairs in each cell subset, as obtained from the datasets of 5 healthy females and public data sets from 6 healthy males3. (B) The percentage of positive (+) and negative (−) correlated DMG-DEG pairs in CD14 and CD19 cells by genomic region: promoter (black) and gene body (gray). (C, D) Plots showing the correlation of cell subset-specific genes changing both in methylation and in gene expression between cell subsets, with either increased (+) or decreased (−) methylation or expression, in CD14 (C) or CD19 (D) cells.
Pathway analysis shows distinct functional pathway enrichment for negatively and positively correlated DEGs and DMGs
Correlations between DNA methylation and gene expression in a population context have been reported to be both positive and negative,39,40 with positively correlated methylation appearing mainly, but not solely, in the gene body.39 In fact, both negative and positive correlated methylation seems to be highly replicated across cell types, with effect sizes being cell type specific.39 Since hypermethylated promoter CpGs are often negatively correlated with expression and mainly found in long-term suppressed genes involved in development, and gene body methylation is often positively correlated with expression and associated with active genes and tissue specificity,4 we hypothesized that the direction of correlation may be associated with different biological functions and pathways or may reflect differences in the regulatory mechanisms. To test this, negatively and positively correlated DMG-DEG pairs from either female and male monocyte data sets, were analyzed using Ingenuity Pathway Analysis (IPA) software. As was shown in Figure 2C, immune cell subsets DMGs of males and females were comparable; however, the lists of correlating DMG-DEG pairs overlap by less than a third between males and females, as can be seen in the Venn-diagram in Figure 5A–B. We cannot rule out that this difference might be due to sex-associated differences in expression, but the most plausible explanation is the difference between gene expression platforms (Affymetrix versus Illumina).34,35 Despite the limited overlap, the lists of top enriched pathways with a Z-score>1.8 included similar functions for the male and female datasets, as summarized in Figure 5C-D. Several of the pathways, such as cell movement, cell migration, and cell proliferation, all quite general pathways, appear for both positively and negatively correlated genes, suggesting that these genes are integral parts of the regulation of specific immune cell functions, and that both interactions between methylation and expression are part of this mechanism. However, the inflammatory response appeared only in the negatively correlated list, while cell death appeared only in the positively correlated list, implying that these 2 biological pathways might be regulated by different mechanisms.
Figure 5.

Similar pathway enrichment is found in the gene-lists of both negatively and positively correlating cell subset-specific DMG-DEG pairs. (A, B) Venn diagrams showing the overlap between the female and male lists of negatively (A) and positively (B) correlating cell subset-specific DMG-DEG pairs in CD14 cells, obtained from the datasets of 5 healthy females and public data sets from 6 healthy males3. (C, D) Top enriched pathways and biological functions, receiving the highest Z-scores in an IPA analysis of the lists of negatively (C) and positively (D) correlating cell subset-specific DMG-DEG pairs in CD14 cells in either males or females. A Z-score below −1.8 or above 1.8 was considered significant.
Detection of sex-specific methylation patterns shared by all immune cell subsets
In order to detect sex-specific DMGs, statistical analysis was performed on the male and female methylation data sets, using 2 way ANOVA for sex and cell subsets after excluding cross-reacting probes.41 This analysis highlighted sex-specific methylation in about 14,000 CpG sites (Fig. 6). Of these, about 6,500 were located on the X-chromosome, while the remaining 7,500 DMGs were located on autosomal chromosomes (Table S11). About 75% of these sex-specific DMGs were found to be hypermethylated in females compared to males (Supplemental Table S11). The distribution of autosomal sex-specific DMGs in different genomic locations was found to be relatively similar to the total CpG sites distribution, but with a minor enrichment in gene body and intergenic region (36% and 29% vs. 33% and 25% of the total CpG sites, respectively) (Fig. 7A and Table 2), similar to cell subset-specific DMGs (Fig. 3A). The distribution of autosomal sex-specific DMGs relatively to CGI showed enrichment in island and shore, but reduction in open sea CpGs (38%, 26%, and 31% versus 31%, 23%, and 36 % of the total CpG sites, respectively) (Fig. 7B and Table 2), in contrast to what we showed for cell subset-specific DMGs (Fig. 3B). Compared to total CpG sites, autosomal sex-specific DMR CGIs were highly enriched in the gene body, 41% vs. 25%, and intergenic region, 25% versus 15%, while reduced in the promoter, 17% vs. 36% (Fig. 7C and Table 2). No such deviation was observed on the sex chromosomes (data not shown), and unlike immune cell-specific subset DMGs, no enrichment in enhancer elements was found in sex-specific DMGs (summarized in Table 2). Taken together, these results indicate that, compared to immune cell-specific DMGs, which were mainly found in non CGI regions, the autosomal sex-specific DMGs are found more frequently in CGIs, suggesting some difference in the role of methylation in the regulation of sex- versus cell subset-specificity.
Figure 6.

Sex-specific DMRs in haematopoietic cells are abundant. The methylome datasets of 4 immune cell subsets from 5 females and 6 males3 were compared and sex-specific DMRs identified. The average methylation β-values of these DMRs are presented in a heat plot with red and blue colors indicating high and low methylation levels, respectively. On the X-axis: sex and cell subset-specific name (M: male, F: female). On the Y-axis, each line represents a different DMR. A complete list of sex-specific DMRs is presented in Table S11.
Figure 7.
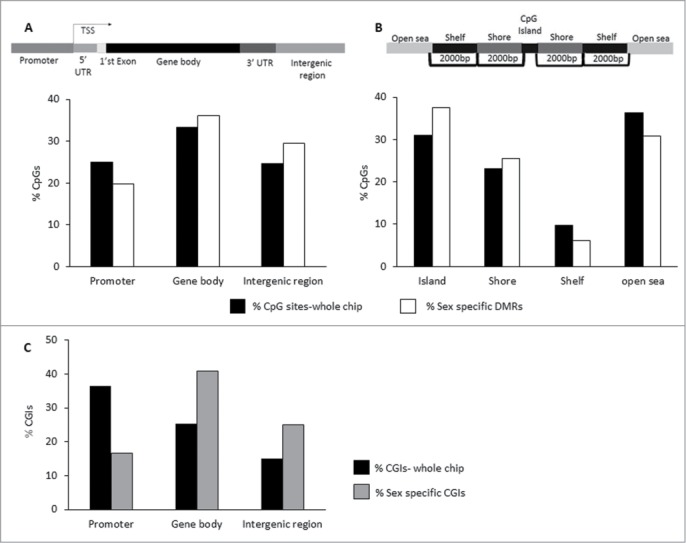
Autosomal sex-specific DMRs are mainly located in promoter CGIs. The genomic location of the 7,500 sex-specific, autosomal DMRs described in Table S11 was analyzed and compared to the total CpG covered on chip. (A) Genomic location of CpGs defined as: promoter, 5′ UTR, 1st Exon, Gene Body, 3′ UTR, and intergenic region. The percentaged of total CpG sites scanned (black) and of sex-specific DMRs (white) within the 3 major genomic locations are presented. (B) Distribution of CpG positions relative to CGI: Island, Shore, Shelf, and Open Sea. The percentages of total CpG sites scanned (black) and of sex-specific DMRs (white) relative to CpG position are presented. (C) The percentages of total CGIs scanned in 3 genomic regions, promoter, gene body, and intergenic region (black), and of sex-specific CGIs (gray) are presented.
Pathway analysis of sex-specific DMGs
Sex-specific DMGs on the sex chromosomes and on autosomal chromosomes were evaluated using IPA software. Using extremely stringent criteria, only genes with an average difference in methylation of at least 15% between females and males and with at least 3 hyper- or hypo-methylated CpGs were selected. No enrichment to any specific pathway was found for the 461 DMGs on the sex chromosome, most prabably because the massive methylation due to X-chromosome inactivation masks the sex-specific DMGs. IPA analysis of the 224 autosomal sex-specific DMGs linked 7 transcription regulators as upstream regulators of 13 sex-specific DMGs, with an enrichment Z-score above 2 or below −2, as can be visualized in Figure 8A. These 13 transcripts and 7 transcription regulators were connected to biological functions, such as cellular proliferation (Z score = 2.435), cellular differentiation (Z score = 2.554), and embryonic development (Z score = 1.729). Sox-2 and POU5F1(Oct-4) are master regulators of transcription and have been shown to be essential for mammalian development,42 and Sox1, Sox2, and Sox3 have been shown to interact with their putative co-factor Oct4 during early development.43 Thus, this result seems to connect some of the sex-specific DMGs to regulation of early development. The three networks with highest score obtained in IPA network analysis for autosomal sex-specific DMGs are presented in Table 3, and network number 2 is presented in Figure 8B. Although the biological significance of the network is still unclear, it links several immune-related molecules, such as CD3, lymphocyte-specific protein 1(LSP1), IgM, BCL11B, TNFRSF4, and the NFKB complex, to the female endocrine system, via the estrogen receptor (ER). Thus, this network shows a possible crosstalk between the immune system and female hormones that potentially could alter immune response in females compared to males.
Figure 8.

Sex-specific autosomal DMGs are enriched in networks of regulators of early development and linked to estrogen receptor and immune-related factors. Gene networks and pathways highlighted by ingenuity pathway analysis (IPA) of autosomal sex-specific DMGs. (A) An enriched interaction network (Z-score above 1.8 or below −1.8) of 7 transcription regulators ( symbols), presented as light gray (predicted to be activated) and dark gray (predicted to be inhibited), regulate 13 genes, all hypermethylated in the female data set compared to the male dataset, as indicated by the black color. The different shapes indicate molecular family as defined in IPA path designer (enzyme, cytokine, peptidase, transcription regulator, transporter, kinase, and other). (B) A top score network of hypermethylated genes (gray fill) and hypomethylated genes (black fill) in females versus males, connecting immune molecules, such as CD3, LIF, BCL11B, and TNFRSF4 and the NFKB pathway to the female endocrine system, via the estrogen receptor. Details on this network are found in Table 3.
Table 3.
Three top enriched IPA networks for the autosomal sex-DMGs
| Top pathways (negatively correlated autosomal sex-specific DEGs/DMGs) | Score | Focus molecule | |
|---|---|---|---|
| 1 | Cell to signaling and interaction, molecular transport, small molecule biochemistry | 42 | 26 |
| 2 | Cell morphology, cell mediated immune response, cellular development | 33 | 22 |
| 3 | Dermatological diseases and conditions, organismal injury and abnormalities, Cardiovascular disease | 28 | 20 |
Novel networks from a user gene list favoring denser connectivity networks, and maximization of genes from list, i.e., focus molecules, out of possible 35 per network. The score of each network, expressed as –log10(P-value), is calculated as the probability of finding for more Focus Genes in a set of n genes randomly selected from the Global.
Discussion
DNA methylation has been shown to be implicated in the establishment, maintenance, and activation of cell type specific expression.8,14,44 The distinct expression and methylation profiles we found for each subset, while overlapping the profile of PBMCs, strongly emphasizes that DNA methylation patterns must be studied in purified cell subsets. Our data on immune cell profiles is expected to contribute to the creation of a methylome atlas, reflecting different interpretations of genome-wide methylation signals that will eventually be functionally interrogated.3,8,32 Cell subset-specific hypomethylated regions have previously been shown by others to be enriched for SNPs associated with immune-mediated disease in genome-wide association studies, indicating that altered methylation might contribute to disease risk.3 Disease-specific immune cell DNA methylation patterns have been identified in autoimmune patients with systemic lupus erythematosus, partly associated with a disease-mediated change in the composition of the CD4+ population.21 Peripheral blood-derived DNA methylation profiles have been shown to be able to predict several non-haematopoietic cancers, perhaps by identifying shifts in leukocyte populations, representative of disease, thus representing a powerful diagnostic tools,45 and DNA hypomethylation in blood leukocytes has been related to cancer risk.46 Our aim was to create cell- and sex-specific datasets of immune cell subsets to study the interaction between transcription and methylation in both health and disease. We produced such a data set from healthy females and, when combining this with a parallel male dataset from the public domain,3 we found a very high overlap in cell subset methylation profiles between males and females, with an average correlation factor of 0.82. The fact that independent data sets generated by 2 different research groups gave such comparable results suggests that DNA methylation profiles are highly reproducible.
The HumanMethylation450 BeadChip has recently become an attractive choice for quantitative DNA methylation studies, among others reasons due to its cost-benefit aspects.47 However, as can be seen in Figure 3, this product has a relatively high coverage of promoter regions and CGIs, and less coverage of gene body or more distal CpG elements. Tissue specific methylation has been shown to occur over a wide range of CpG densities, mainly in intragenic and intergenic regions.9,15,48 The majority of immune cell-specific DMGs in the current study were found in the gene body and intergenic regions, located in CpG shores and open sea, while, to a much lesser extent, in the promoter region and in CGIs. The immune cell-specific DMGs were enriched within enhancer elements, and this is specifically of interest since ∼60% of SNPs associated with autoimmune diseases has been mapped to immune cell enhancers.36 Taken together, our results, summarized in Table 2, point to that immune cell-specific methylation is located mainly in inter- and intra-genic, non-CGI CpGs, in line with recently published studies of immune cells.3,14 Hence, better coverage of CpGs in distal genomic regions by bead arrays is expected to provide epigenetic researchers with more valuable information, especially for comprehending immune-mediated diseases.
Immune cells differentiate throughout life from a common haematopoietic progenitor into myeloid and lymphoid blood lineages, and continue to differentiate and maturate in response to physiological changes and environmental exposure, thus demonstrating high plasticity. Lineage commitment, acquisition of mature cell phenotype, and repression of the naive cell state have been shown to be accompanied by extensive DNA methylation remodeling, preferentially of CpGs located in enhancer elements distal from defined CpG islands and shores, and enriched for specific transcription factors (TFs) binding sites.49,50 Our results support that methylation patterns within intragenic and intergenic regions are important for immune cell subset specificity and differentiation, perhaps by modifying distal regulatory elements.
The expression and methylation datasets were combined and the relationship between the two defined, revealing a modest number of correlated genes pairs. As indicated previously, this might be due to limitations in the gene annotation of CpGs or the CpG coverage of the arrays. Novel methods to discover more complex relations between gene expression and DNA methylation are being developed, but remain to be validated.51,52 Both negative and positive correlations between expression and methylation were found, with the negatively correlated, hypomethylated, active genes being more frequent in all cell subsets evaluated. The positively correlated DMGs were mainly found in the gene body, while negatively correlated genes were common both in the promoter and in the gene body. The latter is in line with the frequently observed inverse correlation between methylation CGIs and transcription.4,53,54 Several papers have described positive correlations between methylation and transcription, mainly of intragenic or intergenic CpGs,4,8,9,53,55,56 similar to our results (summarized in Table 2). It was shown that while negative correlations between expression and methylation were more frequently associated with activation markers sites, such as H3K4me3 and DNase I hypersensitive sites (DHS), positive correlations were associated with repressive chromatin marker sites, such as H3K27me3.57 Work on DHS published by the ENCODE project indicated an inverse correlation between DNA methylation and chromatin accessibility as assessed by DHS, as well as with transcription factor expression.58 In general, the depletion of DNA methylation does not necessarily induce gene activation but rather renders a permissive state for activation.59 Thus, it has been suggested that combined epigenetic marks, such as histone markers, chromatin state, and DNA methylation, might be better predictors for expression level than position of the CpG sites with respect to the gene.57 A confounding factor in defining this relationship is the fact that assays based upon bisulfite conversion, such as HumanMethylation450 BeadChips, do not distinguish between 5hmC and 5mC. Since 5hmC has been associated with demethylation and possible gene activation,1,2 it is possible that at least part of the positive correlations observed between methylation and transcription could be due to hydroxylation of 5mCs.55 5hmC is mostly depleted in CGIs, but found in the exons of gene bodies and highly enriched in distal regulatory elements, which include enhancers, insulators, p300-binding sites, and DHSs.59-61 Thus, the observed enrichment of immune cell-specific DMGs in enhancer elements could at least in part include 5hmC sites.59 Pathway analysis revealed similar biological pathways for negatively and positively correlated genes, indicating that the direction of correlation is not specific to a biological function. However, 2 pathways, the inflammatory response and cell death pathways, were specific to only one of the directions, suggesting that the regulatory mechanism of these pathways may be different. These results emphasize the complexity of the relation between methylation and gene expression, and the need for future studies to decipher these interactions.
In light of the well-known sexual dimorphism in the prevalence of several disease states, including autoimmune diseases,62 we assessed whether DNA methylation in immune cells may differ between males and females. Sex differences in the human transcriptome have been described in several tissues, including in peripheral blood, where 582 DEGs were identified on autosomal chromosomes.63 Of these, female-biased DEGs were enriched for several immune pathways, for estradiol-regulated genes and linked to rheumatoid arthritis, thus emphasizing the importance of studying the sex bias in gene regulation.63 Using a public available methylome data set from males, we found that male immune cell-specific DMGs highly overlapped with the female methylome obtained, with only minor sex differences being observed. However, we detected 14,000 sex-specific DMGs not associated with a specific cell subset. Of these, 46 % were detected on the sex chromosome, reflecting, most likely, sex chromosome dosage,64,65 but 54% sex-specific DMGs were located on autosomal chromosomes (Table S11). Even after excluding cross-reacting probes, which have been shown to include ∼10% of the array probes,41 the number of sex-specific DMGs, despite our stringent criteria, is still unexpectedly high, compared to previous publications.27,66,67 We cannot rule out that some batch effect may occur, since the 2 datasets were generated in different laboratories. However, since the cell subset-specific DMR lists in males and females were highly similar (average correlation of 0.82), and since DMGs were defined by highly stringent criteria, we believe that the batch effect is minor in the current analysis. Furthermore, some of the sex-specific DMGs were found in the vicinity of known sex specific genes, such as TDGF1, NDN, PLAGL1, ERN1, and PEG10,68 thus providing further confidence that the results are not confounded. We also detected many novel sex-specific DMGs, such as MED8, PFKM, and TEKT4; their role in sex-specific regulation and function remains to be explored. The large number of sex-specific DMGs found in our immune cell samples, suggests that autosomal sex-specific DMGs are in part tissue-specific, and that autosomal sex-specific DMGs are more abundant in some tissues than in others. This is supported by a recent publication showing that autosomal sex-specific methylation is unique to the specific brain tissue in a murine model.69,70 Thus, the result of the current study provides a list of highly interesting candidate genes to be studied in diseases with sexual dimorphism such as immune-mediated/autoimmune diseases. The effect of sex on methylation is well documented,66 including the recognition that X-chromosome inactivation in females is accompanied with widespread CpG hypermethylation.64 Sex differences appear in embryos before the production of hormonal factors by the gonads, causing long-lasting epigenetic changes that, together with later hormonal regulation, may eventually create sexual dimorphism.71 Some of the autosomal sex-DMGs, such as TLE1 and NUPL1, found by both us and Liu et al. could already be detected in samples from umbilical cord blood at time of birth.66,72 However, sex-specific methylation has been shown to be modified by sex hormones,23,69 as suggested also from preliminary studies showing hormone-related changes in DNA methyltransferase expression during menstrual cycles or pregnancy in the uterus,59,73 indicating that the mechanism of sex differences in CpG methylation is complex and dynamic. Compared to immune cell subset-specific DMGs, autosomal sex-specific DMGs were much more common in CGIs, suggesting some difference in the mechanisms of sex-related vs. immune cell-specific regulation; however, in both cases, the DMGs were mainly found in the gene body.
Pathway analysis of autosomal DMGs revealed a network of transcription factors known to be master regulators, essential in early mammalian embryo development.42,74,75 Some of the DMGs connected in this network have been shown to be involved in gonad differentiation, such as WNT5A, or to be differently expressed between male and female mice, such as the mesoderm-specific transcript/imprinted paternally expressed gene 1 (MEST).76,77 Hence, it is possible that sex-specific DMGs observed in the current study arise already during early embryonic development and may be reinforced by sex hormones after puberty. The results of a network analysis of the autosomal sex-specific DMGs included a high-score network connecting ER and molecules with major roles in immunity, such as the pathway to the sex-specific DMGs. The role of ER in both innate and adaptive immunity is well known and modulation of ER function has been suggested as a potential target for therapy in autoimmune diseases.78,79 Thus, these sex-specific DMGs could be involved in the sex-biased prevalence of autoimmune diseases; however, this aspect needs to be further investigated. All in all, further classification and examination of sex-related changes in expression, methylation, chromatin accessibility, and functional pathways is necessary in order to understand the molecular basis of sex-specific modifications in health and disease.28,46,65
In this study, we determined the expression and methylation profiles of 4 immune cell subsets and characterized the specific genomic locations of differential methylation in immune cells as well as the correlation between methylome and transcriptome. Furthermore, we identified extensive sex-specific methylation located on the autosomal chromosomes, and propose that these changes could have a biological significance that might contribute to sex-specific bias in pathological states, such as autoimmune diseases. Our comprehension of the role of methylation in gene regulation is limited due to the complexity of the relation between methylation and expression, depending, among other things, upon location and density of the CpGs, as demonstrated in this study. Further obstacles include the limitations of available databases of regulatory elements, as well as the difficulty in manipulating CpG methylation in a site-specific manner in order to study functional effect. Hence, better and more comprehensive algorithms will be required to capture the diversity of the crosstalk between expression, chromatin state, regulatory elements, and methylation. The current study may contribute another building block in defining a control immune cell methylome and transcriptome that may serve as references for studying abnormal patterns of immune cell profiles in pathological states, such as autoimmune diseases.
Materials and Methods
Subjects
Six female and 6 male healthy donors (ages 30-52 years) were recruited at the Institute of Myology, Paris, France, with approval of the local ethical committee (Ref afssaps B100384-30) in accordance with the Helsinki Declaration of 1975, after signing a written informed consent. All donors had no known medical conditions and were not receiving any regular medication. Details on donors are presented in Table S1. Female RNA and DNA samples were used for both gene expression and methylation analysis as described below, while male RNA samples were used for gene expression validation by qRT-PCR.
Cell separation and DNA/RNA extraction
PBMCs were purified from 60 ml blood by Ficoll density gradient centrifugation (U16 NovaMed). Some PBMCs were set aside, and the rest were used for subset isolation. The CD14 subset was isolated using EasySep™ Human Monocyte Enrichment Kit (#19059 Stemcell). B and T cell subsets were purified by FACS ARIA sorting (Becton Dickinson) using anti-CD19 antibody (Ab) (R0808, DAKO), anti-CD4 Ab (556345, BD PharMingen), and anti-CD8 Ab (F0765,Dako). Recovery was 65-80% and purity >89% (detailed in Table S1). FoxpP3+ CD4+ cells (Tregs) were also sorted by the FACS ARIA, but not used in this analysis; therefore, the CD4+ T cells included in the study are Foxp3−. From each sample, both RNA and DNA was extracted using AllPrep kit (#80204 Qiagen), according to manufacturer's protocol. DNA concentration was measured by picogreen and stored at 4°C until use. RNA quantity and quality was measured by NanoDrop and Agilent BioAnalyzer, respectively, and stored at −80°C until use.
Genome-wide expression and DNA methylation data generation
Data generation was performed at the Genomics Core Facility at the Rappaport Faculty of Medicine, Technion, according to the manufacturer's protocol. RNA and DNA samples from 5 females were hybridized to Illumina HumanHT-12 v4® (BD-103-0204 Illumina) or HumanMethylation450 BeadChip (WG-314-1003 Illumina), respectively. The data has been submitted to Gene Expression Omnibus (GEO): accession number GSE71245. The methylation BeadChip detects the methylation status of 450,000 CpG sites throughout the genome; the quantitative measurement of methylation for each CpG is expressed as a β-value ranging between 0 and 1, with 0 indicating an unmethylated and 1 indicating a fully methylated CpG site.80 In addition, public available gene expression (GEX) and DNA methylation data sets generated from 5 primary immune subsets from 6 Caucasian, non-smoking males, age 36–51 y (average age 45 y), was downloaded from ArrayExpress [accession number: E-ERAD-179 (K450 Illumina methylation arrays), E-MTAB-2062 (GEX Affymetrix arrays)],3 for comparison with our female datasets.
Statistical and pathway analysis
Gene expression data was analyzed using JMP Genomics V6 software (SAS Institute Inc., Cary, NC), as previously described.81,82 DEGs were defined as transcripts with a ≥1.6-fold change of expression at a ≤ 0.05 False Discovery Rate (FDR) adjusted P-value.83 The methylation BeadChip data was preprocessed using an R-script pipeline developed by Touleimat and Tost 80 and the normalized methylation β-values were imported into JMP-genomic software. Cross reacting probes between X- and Y-chromosomes, and probes that overlapped SNPs were excluded.41 DMGs between cell subsets were defined as ≥15% difference in methylation β-values at a ≤ 0.05 FDR adjusted P-value. The same analysis was performed on the public downloaded data sets from males, creating a list of male DMGs and DMGs. Due to the different platforms used for GEX data generation, Affymetrix versus Illumina, only the methylome datasets were compared between females and males. The correlation levels between the male and female subset-specific DMR lists were determined by Pearson correlation calculated using the JMP Genomics V6 software (SAS Institute Inc., Cary, NC), as previously described.81,82 The direction of correlation between expression and methylation was independently assessed for the data sets of both females and males. An enhancer annotation list from a Broad Institute Portal (http://www.broadinstitute.org/pubs/finemapping/?q=data-portal)36 was downloaded; annotation regarding enhancer position was added to the Illumina-provided annotation file. Ingenuity Pathway Analysis (IPA 8.0, Ingenuity® Systems, Redwood City, CA) was used to identify statistically significant functional categories in the dataset. Gene lists were imported into IPA and mapped to biological functional pathways. Z-score, a statistical method for rescaling and standardizing data, was used to determine enrichment, with Z-scores greater than 1.8 or smaller than 1.8 considered significant.84 The IPA algorithm generates novel networks from a user gene list, favoring denser connectivity networks with low probability to be generated by random chance, and maximization of genes from list, known as focus molecules. The score of each network, expressed as –log10(P-value) is calculated as the probability of finding for more Focus Genes in a set of n genes randomly selected from the Global Molecular Network.84,85
cDNA preparation and RT-PCR
Microfluidic dynamic arrays (BMK-M10-96.96-EG/1 Fluidigm) were used to perform high-throughput gene expression measurements by RT-PCR of 44 genes on RNA samples from 4 cell subset in 5 females and 6 males, according to the manufacturer's protocol.86 Ubiquitin-conjugating enzyme E2D2 (UBE2D2) was used as a reference gene. Ribosomal Protein L4 (RPL4) was used as a negative control gene, since this gene was known from previous experiments in our lab not to be cell-specific. Relative quantification was calculated by the comparative CT method (2−ΔΔCT), and results are shown as fold change of expression.
Target bisulfite amplification and next generation sequencing
We have developed a novel assay for DNA methylation that we named target bisulfite sequencing (TBS). This new assay combines target bisulfite amplification with next generation sequencing and will be described in more detail in a separated manuscript (under preparation). Genomic DNA (gDNA) was treated with the EpiTect Bisulfite conversion kit (#59104 Qiagen), primers were designed using the Bisearch primer web site (http://bisearch.enzim.hu/), and target specific amplification was performed with EpiMark Hot Start Taq DNA Polymerase (NEB-M0490L New England Biolab). The amplicons were sequenced using Ion Torrent, according to manufacturer's protocol.87 Alignment of the sequences to our target bisulfite reference sequences and base calling was performed using Torrent Suite software version 2.0.1 and Ampliseq™ Variant Caller plug-in (Life Technologies). The Integrative Genomics Viewer (IGV) was used to visualize the read alignment.88 For each transcript 3-20 CpG sites located within 200-400 bp amplicons were identified and methylation percentage calculated as the number of cytosine sequenced out of the total number of sequences.
Disclosure of Potential Conflicts of Interest
No potential conflicts of interest were disclosed.
Acknowledgments
We thank Melinee Frenkian, Institute of Myology Pitie-Salpetriere, France, for assistance and coordination of this study. The authors acknowledge Catherine Blanc and Benedicte Hoareau from the Flow Cytometry Core CYPS, Pierre & Marie Curie University, Pitié-Salpêtrière Hospital, Paris, France for the cell sorting experiments, and Dr. Liat Linde, the Genomics Core Facility at the Rappaport Faculty of Medicine, Technion, Israel for generation of the gene expression and DNA methylation data.
Supplemental Material
Supplemental data for this article can be accessed on the publisher's website
Funding
This work was supported by 7th Framework Program of the European Union FIGHT-MG [grant no. 242210] and by AFM-Téléthon [grant no. 16910].
References
- 1.Thalhammer A, Hansen AS, El-Sagheer AH, Brown T, Schofield CJ. Hydroxylation of methylated CpG dinucleotides reverses stabilisation of DNA duplexes by cytosine 5-methylation. Chem Commun (Camb) 2011; 47:5325-7; PMID:21451870; http://dx.doi.org/ 10.1039/c0cc05671e [DOI] [PubMed] [Google Scholar]
- 2.Guo JU, Su Y, Zhong C, Ming GL, Song H. Hydroxylation of 5-methylcytosine by TET1 promotes active DNA demethylation in the adult brain. Cell 2011; 145:423-34; PMID:21496894; http://dx.doi.org/ 10.1016/j.cell.2011.03.022 [DOI] [PMC free article] [PubMed] [Google Scholar]
- 3.Zilbauer M, Rayner TF, Clark C, Coffey AJ, Joyce CJ, Palta P, Palotie A, Lyons PA, Smith KG. Genome-wide methylation analyses of primary human leukocyte subsets identifies functionally important cell-type-specific hypomethylated regions. Blood 2013; 122:e52-60; PMID:24159175; http://dx.doi.org/ 10.1182/blood-2013-05-503201 [DOI] [PMC free article] [PubMed] [Google Scholar]
- 4.Jones PA. Functions of DNA methylation: islands, start sites, gene bodies and beyond. Nat Rev Genet 2012; 13:484-92; PMID:22641018; http://dx.doi.org/ 10.1038/nrg3230 [DOI] [PubMed] [Google Scholar]
- 5.Ziller MJ, Gu H, Muller F, Donaghey J, Tsai LT, Kohlbacher O, De Jager PL, Rosen ED, Bennett DA, Bernstein BE, et al.. Charting a dynamic DNA methylation landscape of the human genome. Nature 2013; 500:477-81; PMID:23925113; http://dx.doi.org/ 10.1038/nature12433 [DOI] [PMC free article] [PubMed] [Google Scholar]
- 6.Bibikova M, Barnes B, Tsan C, Ho V, Klotzle B, Le JM, Delano D, Zhang L, Schroth GP, Gunderson KL, et al.. High density DNA methylation array with single CpG site resolution. Genomics 2011; 98:288-95; PMID:21839163; http://dx.doi.org/ 10.1016/j.ygeno.2011.07.007 [DOI] [PubMed] [Google Scholar]
- 7.Straussman R, Nejman D, Roberts D, Steinfeld I, Blum B, Benvenisty N, Simon I, Yakhini Z, Cedar H. Developmental programming of CpG island methylation profiles in the human genome. Nat Struct Mol Biol 2009; 16:564-635; PMID:19377480; http://dx.doi.org/ 10.1038/nsmb.1594 [DOI] [PubMed] [Google Scholar]
- 8.Deaton AM, Webb S, Kerr AR, Illingworth RS, Guy J, Andrews R, Bird A. Cell type-specific DNA methylation at intragenic CpG islands in the immune system. Genome Res 2011; 21:1074-86; PMID:21628449; http://dx.doi.org/ 10.1101/gr.118703.110 [DOI] [PMC free article] [PubMed] [Google Scholar]
- 9.Maunakea AK, Nagarajan RP, Bilenky M, Ballinger TJ, D'Souza C, Fouse SD, Johnson BE, Hong C, Nielsen C, Zhao Y, et al.. Conserved role of intragenic DNA methylation in regulating alternative promoters. Nature 2010; 466:253-7; PMID:20613842; http://dx.doi.org/ 10.1038/nature09165 [DOI] [PMC free article] [PubMed] [Google Scholar]
- 10.Cao-Lei L, Leija S, Kumsta R, Wüst S, Meyer J, Turner J, Muller C. Transcriptional control of the human glucocorticoid receptor: identification and analysis of alternative promoter regions. Hum Genet 2011; 129:533-76; PMID:21234764; http://dx.doi.org/ 10.1007/s00439-011-0949-1 [DOI] [PubMed] [Google Scholar]
- 11.Anastasiadou C, Malousi A, Maglaveras N, Kouidou S. Human epigenome data reveal increased CpG methylation in alternatively spliced sites and putative exonic splicing enhancers. DNA Cell Biol 2011; 30:267-342; PMID:21545276; http://dx.doi.org/ 10.1089/dna.2010.1094 [DOI] [PubMed] [Google Scholar]
- 12.Malousi A, Maglaveras N, Kouidou S. Intronic CpG content and alternative splicing in human genes containing a single cassette exon. Epigenetics 2008; 3:69-73; PMID:18418084; http://dx.doi.org/ 10.4161/epi.3.2.6066 [DOI] [PubMed] [Google Scholar]
- 13.Irizarry RA, Ladd-Acosta C, Wen B, Wu Z, Montano C, Onyango P, Cui H, Gabo K, Rongione M, Webster M, et al.. The human colon cancer methylome shows similar hypo- and hypermethylation at conserved tissue-specific CpG island shores. Nat Genet 2009; 41:178-86; PMID:19151715; http://dx.doi.org/ 10.1038/ng.298 [DOI] [PMC free article] [PubMed] [Google Scholar]
- 14.Ji H, Ehrlich LI, Seita J, Murakami P, Doi A, Lindau P, Lee H, Aryee MJ, Irizarry RA, Kim K, et al.. Comprehensive methylome map of lineage commitment from haematopoietic progenitors. Nature 2010; 467:338-42; PMID:20720541; http://dx.doi.org/ 10.1038/nature09367 [DOI] [PMC free article] [PubMed] [Google Scholar]
- 15.Slieker RC, Bos SD, Goeman JJ, Bovee JV, Talens RP, van der Breggen R, Suchiman HE, Lameijer EW, Putter H, van den Akker EB, et al.. Identification and systematic annotation of tissue-specific differentially methylated regions using the Illumina 450k array. Epigenetics Chromatin 2013; 6:26; PMID:23919675; http://dx.doi.org/ 10.1186/1756-8935-6-26 [DOI] [PMC free article] [PubMed] [Google Scholar]
- 16.Qu Y, Lennartsson A, Gaidzik VI, Deneberg S, Karimi M, Bengtzen S, Hoglund M, Bullinger L, Dohner K, Lehmann S. Differential methylation in CN-AML preferentially targets non-CGI regions and is dictated by DNMT3A mutational status and associated with predominant hypomethylation of HOX genes. Epigenetics 2014; 9:1108-19; PMID:24866170; http://dx.doi.org/ 10.4161/epi.29315 [DOI] [PMC free article] [PubMed] [Google Scholar]
- 17.Dayeh T, Volkov P, Salo S, Hall E, Nilsson E, Olsson AH, Kirkpatrick CL, Wollheim CB, Eliasson L, Ronn T, et al.. Genome-wide DNA methylation analysis of human pancreatic islets from type 2 diabetic and non-diabetic donors identifies candidate genes that influence insulin secretion. PLoS Genet 2014; 10:e1004160; PMID:24603685; http://dx.doi.org/ 10.1371/journal.pgen.1004160 [DOI] [PMC free article] [PubMed] [Google Scholar]
- 18.Shen J, Wang S, Zhang YJ, Wu HC, Kibriya MG, Jasmine F, Ahsan H, Wu DP, Siegel AB, Remotti H, et al.. Exploring genome-wide DNA methylation profiles altered in hepatocellular carcinoma using Infinium HumanMethylation 450 BeadChips. Epigenetics 2013; 8:34-43; PMID:23208076; http://dx.doi.org/ 10.4161/epi.23062 [DOI] [PMC free article] [PubMed] [Google Scholar]
- 19.Zouali M. Epigenetics in lupus. Ann N Y Acad Sci 2011; 1217:154-65; PMID:21251010; http://dx.doi.org/ 10.1111/j.1749-6632.2010.05831.x [DOI] [PubMed] [Google Scholar]
- 20.Hannum G, Guinney J, Zhao L, Zhang L, Hughes G, Sadda S, Klotzle B, Bibikova M, Fan JB, Gao Y, et al.. Genome-wide methylation profiles reveal quantitative views of human aging rates. Mol Cell 2013; 49:359-67; PMID:23177740; http://dx.doi.org/ 10.1016/j.molcel.2012.10.016 [DOI] [PMC free article] [PubMed] [Google Scholar]
- 21.Absher DM, Li X, Waite LL, Gibson A, Roberts K, Edberg J, Chatham WW, Kimberly RP. Genome-wide DNA methylation analysis of systemic lupus erythematosus reveals persistent hypomethylation of interferon genes and compositional changes to CD4+ T-cell populations. PLoS Genet 2013; 9:e1003678; PMID:23950730; http://dx.doi.org/ 10.1371/journal.pgen.1003678 [DOI] [PMC free article] [PubMed] [Google Scholar]
- 22.Maegawa S, Hinkal G, Kim HS, Shen L, Zhang L, Zhang J, Zhang N, Liang S, Donehower LA, Issa JP. Widespread and tissue specific age-related DNA methylation changes in mice. Genome Res 2010; 20:332-40; PMID:20107151; http://dx.doi.org/ 10.1101/gr.096826.109 [DOI] [PMC free article] [PubMed] [Google Scholar]
- 23.Ammerpohl O, Bens S, Appari M, Werner R, Korn B, Drop SL, Verheijen F, van der Zwan Y, Bunch T, Hughes I, et al.. Androgen receptor function links human sexual dimorphism to DNA methylation. PLoS One 2013; 8:e73288; PMID:24023855; http://dx.doi.org/ 10.1371/journal.pone.0073288 [DOI] [PMC free article] [PubMed] [Google Scholar]
- 24.Vige A, Gallou-Kabani C, Junien C. Sexual dimorphism in non-Mendelian inheritance. Pediatr Res 2008; 63:340-7; PMID:18356736; http://dx.doi.org/ 10.1203/PDR.0b013e318165b896 [DOI] [PubMed] [Google Scholar]
- 25.Orozco LD, Rubbi L, Martin LJ, Fang F, Hormozdiari F, Che N, Smith AD, Lusis AJ, Pellegrini M. Intergenerational genomic DNA methylation patterns in mouse hybrid strains. Genome Biol 2014; 15:R68; PMID:24887417; http://dx.doi.org/ 10.1186/gb-2014-15-5-r68 [DOI] [PMC free article] [PubMed] [Google Scholar]
- 26.El-Maarri O, Becker T, Junen J, Manzoor SS, Diaz-Lacava A, Schwaab R, Wienker T, Oldenburg J. Gender specific differences in levels of DNA methylation at selected loci from human total blood: a tendency toward higher methylation levels in males. Hum Genet 2007; 122:505-14; PMID:17851693; http://dx.doi.org/ 10.1007/s00439-007-0430-3 [DOI] [PubMed] [Google Scholar]
- 27.Xu H, Wang F, Liu Y, Yu Y, Gelernter J, Zhang H. Sex-biased methylome and transcriptome in human prefrontal cortex. Hum Mol Genet 2014; 23:1260-70; PMID:24163133; http://dx.doi.org/ 10.1093/hmg/ddt516 [DOI] [PMC free article] [PubMed] [Google Scholar]
- 28.Ngo ST, Steyn FJ, McCombe PA. Gender differences in autoimmune disease. Front Neuroendocrinol 2014; 35:347-69; PMID:24793874; http://dx.doi.org/ 10.1016/j.yfrne.2014.04.004 [DOI] [PubMed] [Google Scholar]
- 29.Ober C, Loisel DA, Gilad Y. Sex-specific genetic architecture of human disease. Nat Rev Genet 2008; 9:911-22; PMID:19002143; http://dx.doi.org/ 10.1038/nrg2415 [DOI] [PMC free article] [PubMed] [Google Scholar]
- 30.Hewagama A, Patel D, Yarlagadda S, Strickland FM, Richardson BC. Stronger inflammatory/cytotoxic T-cell response in women identified by microarray analysis. Genes Immun 2009; 10:509-16; PMID:19279650; http://dx.doi.org/ 10.1038/gene.2009.12 [DOI] [PMC free article] [PubMed] [Google Scholar]
- 31.Zandman-Goddard G, Peeva E, Shoenfeld Y. Gender and autoimmunity. Autoimmun Rev 2007; 6:366-72; PMID:17537382; http://dx.doi.org/ 10.1016/j.autrev.2006.10.001 [DOI] [PubMed] [Google Scholar]
- 32.Liang L, Cookson WO. Grasping nettles: cellular heterogeneity and other confounders in epigenome-wide association studies. Hum Mol Genet 2014; 23(R1):R83-8; PMID:24927738 [DOI] [PMC free article] [PubMed] [Google Scholar]
- 33.Li H, Zheng T, Chen B, Hong G, Zhang W, Shi T, Li S, Ao L, Wang C, Guo Z. Similar blood-borne DNA methylation alterations in cancer and inflammatory diseases determined by subpopulation shifts in peripheral leukocytes. Br J Cancer 2014; 111:525-31; PMID:24960404; http://dx.doi.org/ 10.1038/bjc.2014.347 [DOI] [PMC free article] [PubMed] [Google Scholar]
- 34.Shi L, Reid LH, Jones WD, Shippy R, Warrington JA, Baker SC, Collins PJ, de Longueville F, Kawasaki ES, Lee KY, et al.. The MicroArray Quality Control (MAQC) project shows inter- and intraplatform reproducibility of gene expression measurements. Nat Biotechnol 2006; 24:1151-61; PMID:16964229; http://dx.doi.org/ 10.1038/nbt1239 [DOI] [PMC free article] [PubMed] [Google Scholar]
- 35.Maouche S, Poirier O, Godefroy T, Olaso R, Gut I, Collet JP, Montalescot G, Cambien F. Performance comparison of two microarray platforms to assess differential gene expression in human monocyte and macrophage cells. BMC Genomics 2008; 9:302; PMID:18578872; http://dx.doi.org/ 10.1186/1471-2164-9-302 [DOI] [PMC free article] [PubMed] [Google Scholar]
- 36.Farh KK-H, Marson A, Zhu J, Kleinewietfeld M, Housley WJ, Beik S, Shoresh N, Whitton H, Ryan RJH, Shishkin AA, et al.. Genetic and epigenetic fine mapping of causal autoimmune disease variants. Nature 2015; 518:337-43; PMID:25363779; http://dx.doi.org/ 10.1038/nature13835 [DOI] [PMC free article] [PubMed] [Google Scholar]
- 37.Drucker L, Tohami T, Tartakover-Matalon S, Zismanov V, Shapiro H, Radnay J, Lishner M. Promoter hypermethylation of tetraspanin members contributes to their silencing in myeloma cell lines. Carcinogenesis 2006; 27:197-204; PMID:16113057; http://dx.doi.org/ 10.1093/carcin/bgi209 [DOI] [PubMed] [Google Scholar]
- 38.Koinuma K, Yamashita Y, Liu W, Hatanaka H, Kurashina K, Wada T, Takada S, Kaneda R, Choi YL, Fujiwara SI, et al.. Epigenetic silencing of AXIN2 in colorectal carcinoma with microsatellite instability. Oncogene 2006; 25:139-46; PMID:16247484 [DOI] [PubMed] [Google Scholar]
- 39.Gutierrez-Arcelus M, Lappalainen T, Montgomery SB, Buil A, Ongen H, Yurovsky A, Bryois J, Giger T, Romano L, Planchon A, et al.. Passive and active DNA methylation and the interplay with genetic variation in gene regulation. Elife 2013; 2:e00523; PMID:23755361 [DOI] [PMC free article] [PubMed] [Google Scholar]
- 40.Gutierrez-Arcelus M, Ongen H, Lappalainen T, Montgomery SB, Buil A, Yurovsky A, Bryois J, Padioleau I, Romano L, Planchon A, et al.. Tissue-specific effects of genetic and epigenetic variation on gene regulation and splicing. PLoS Genet 2015; 11:e1004958; PMID: 25634236; http://dx.doi.org/ 10.1371/journal.pgen.1004958 [DOI] [PMC free article] [PubMed] [Google Scholar]
- 41.Chen YA, Lemire M, Choufani S, Butcher DT, Grafodatskaya D, Zanke BW, Gallinger S, Hudson TJ, Weksberg R. Discovery of cross-reactive probes and polymorphic CpGs in the Illumina Infinium HumanMethylation450 microarray. Epigenetics 2013; 8:203-9; PMID:23314698; http://dx.doi.org/ 10.4161/epi.23470 [DOI] [PMC free article] [PubMed] [Google Scholar]
- 42.Rizzino A. Sox2 and Oct-3/4: a versatile pair of master regulators that orchestrate the self-renewal and pluripotency of embryonic stem cells. Wiley Interdiscip Rev Syst Biol Med 2009; 1:228-36; PMID:20016762; http://dx.doi.org/ 10.1002/wsbm.12 [DOI] [PMC free article] [PubMed] [Google Scholar]
- 43.Archer TC, Jin J, Casey ES. Interaction of Sox1, Sox2, Sox3 and Oct4 during primary neurogenesis. Dev Biol 2011; 350:429-40; PMID:21147085; http://dx.doi.org/ 10.1016/j.ydbio.2010.12.013 [DOI] [PMC free article] [PubMed] [Google Scholar]
- 44.Futscher BW, Oshiro MM, Wozniak RJ, Holtan N, Hanigan CL, Duan H, Domann FE. Role for DNA methylation in the control of cell type specific maspin expression. Nat Genet 2002; 31:175-9; PMID:12021783; http://dx.doi.org/ 10.1038/ng886 [DOI] [PubMed] [Google Scholar]
- 45.Koestler DC, Marsit CJ, Christensen BC, Accomando W, Langevin SM, Houseman EA, Nelson HH, Karagas MR, Wiencke JK, Kelsey KT. Peripheral blood immune cell methylation profiles are associated with nonhematopoietic cancers. Cancer Epidemiol Biomarkers Prev 2012; 21:1293-302; PMID:22714737; http://dx.doi.org/ 10.1158/1055-9965.EPI-12-0361 [DOI] [PMC free article] [PubMed] [Google Scholar]
- 46.Gao Y, Baccarelli A, Shu XO, Ji BT, Yu K, Tarantini L, Yang G, Li HL, Hou L, Rothman N, et al.. Blood leukocyte Alu and LINE-1 methylation and gastric cancer risk in the Shanghai Women's Health Study. Br J Cancer 2012; 106:585-91; PMID:22173668; http://dx.doi.org/ 10.1038/bjc.2011.562 [DOI] [PMC free article] [PubMed] [Google Scholar]
- 47.Dedeurwaerder S, Defrance M, Calonne E, Denis H, Sotiriou C, Fuks F. Evaluation of the Infinium Methylation 450K technology. Epigenomics 2011; 3:771-84; PMID:22126295; http://dx.doi.org/ 10.2217/epi.11.105 [DOI] [PubMed] [Google Scholar]
- 48.Liang P, Song F, Ghosh S, Morien E, Qin M, Mahmood S, Fujiwara K, Igarashi J, Nagase H, Held WA. Genome-wide survey reveals dynamic widespread tissue-specific changes in DNA methylation during development. BMC Genomics 2011; 12:231; PMID:21569359; http://dx.doi.org/ 10.1186/1471-2164-12-231 [DOI] [PMC free article] [PubMed] [Google Scholar]
- 49.Ronnerblad M, Andersson R, Olofsson T, Douagi I, Karimi M, Lehmann S, Hoof I, de Hoon M, Itoh M, Nagao-Sato S, et al.. Analysis of the DNA methylome and transcriptome in granulopoiesis reveals timed changes and dynamic enhancer methylation. Blood 2014; 123:e79-89; PMID:24671952; http://dx.doi.org/ 10.1182/blood-2013-02-482893 [DOI] [PubMed] [Google Scholar]
- 50.Scharer CD, Barwick BG, Youngblood BA, Ahmed R, Boss JM. Global DNA methylation remodeling accompanies CD8 T cell effector function. J Immunol 2013; 191:3419-29; PMID:23956425; http://dx.doi.org/ 10.4049/jimmunol.1301395 [DOI] [PMC free article] [PubMed] [Google Scholar]
- 51.Vanderkraats ND, Hiken JF, Decker KF, Edwards JR. Discovering high-resolution patterns of differential DNA methylation that correlate with gene expression changes. Nucleic Acids Res 2013; 41:6816-27; PMID:23748561; http://dx.doi.org/ 10.1093/nar/gkt482 [DOI] [PMC free article] [PubMed] [Google Scholar]
- 52.Dyson MT, Roqueiro D, Monsivais D, Ercan CM, Pavone ME, Brooks DC, Kakinuma T, Ono M, Jafari N, Dai Y, et al.. Genome-wide DNA methylation analysis predicts an epigenetic switch for GATA factor expression in endometriosis. PLoS Genet 2014; 10:e1004158; PMID:24603652; http://dx.doi.org/ 10.1371/journal.pgen.1004158 [DOI] [PMC free article] [PubMed] [Google Scholar]
- 53.Yu DH, Ware C, Waterland RA, Zhang J, Chen MH, Gadkari M, Kunde-Ramamoorthy G, Nosavanh LM, Shen L. Developmentally programmed 3′ CpG island methylation confers tissue- and cell-type-specific transcriptional activation. Mol Cell Biol 2013; 33:1845-58; PMID:23459939; http://dx.doi.org/ 10.1128/MCB.01124-12 [DOI] [PMC free article] [PubMed] [Google Scholar]
- 54.Marx A, Kahan T, Simon I. Integrative analysis of methylome and transcriptome reveals the importance of unmethylated CpGs in non-CpG island gene activation. Biomed Res Int 2013; 2013:785731; PMID:23936848; http://dx.doi.org/ 10.1155/2013/785731 [DOI] [PMC free article] [PubMed] [Google Scholar]
- 55.Banovich NE, Lan X, McVicker G, van de Geijn B, Degner JF, Blischak JD, Roux J, Pritchard JK, Gilad Y. Methylation QTLs Are Associated with Coordinated Changes in Transcription Factor Binding, Histone Modifications, and Gene Expression Levels. PLoS Genet 2014; 10:e1004663; PMID:25233095; http://dx.doi.org/ 10.1371/journal.pgen.1004663 [DOI] [PMC free article] [PubMed] [Google Scholar]
- 56.Portela A, Esteller M. Epigenetic modifications and human disease. Nat Biotechnol 2010; 28:1057-125; PMID:20944598; http://dx.doi.org/ 10.1038/nbt.1685 [DOI] [PubMed] [Google Scholar]
- 57.Wagner JR, Busche S, Ge B, Kwan T, Pastinen T, Blanchette M. The relationship between DNA methylation, genetic and expression inter-individual variation in untransformed human fibroblasts. Genome Biol 2014; 15:R37; PMID:24555846; http://dx.doi.org/ 10.1186/gb-2014-15-2-r37 [DOI] [PMC free article] [PubMed] [Google Scholar]
- 58.Thurman RE, Rynes E, Humbert R, Vierstra J, Maurano MT, Haugen E, Sheffield NC, Stergachis AB, Wang H, Vernot B, et al.. The accessible chromatin landscape of the human genome. Nature 2012; 489:75-82; PMID:22955617; http://dx.doi.org/ 10.1038/nature11232 [DOI] [PMC free article] [PubMed] [Google Scholar]
- 59.Gao F, Das SK. Epigenetic regulations through DNA methylation and hydroxymethylation: clues for early pregnancy in decidualization. Biomol Concepts 2014; 5:95-107; PMID:25372745; http://dx.doi.org/ 10.1515/bmc-2013-0036 [DOI] [PMC free article] [PubMed] [Google Scholar]
- 60.Yu P, Xiao S, Xin X, Song CX, Huang W, McDee D, Tanaka T, Wang T, He C, Zhong S. Spatiotemporal clustering of the epigenome reveals rules of dynamic gene regulation. Genome Res 2013; 23:352-64; PMID:23033340; http://dx.doi.org/ 10.1101/gr.144949.112 [DOI] [PMC free article] [PubMed] [Google Scholar]
- 61.Stadler MB, Murr R, Burger L, Ivanek R, Lienert F, Scholer A, van Nimwegen E, Wirbelauer C, Oakeley EJ, Gaidatzis D, et al.. DNA-binding factors shape the mouse methylome at distal regulatory regions. Nature 2011; 480:490-5; PMID:22170606 [DOI] [PubMed] [Google Scholar]
- 62.Avidan N, Le Panse R, Berrih-Aknin S, Miller A. Genetic basis of myasthenia gravis - a comprehensive review. J Autoimmun 2014; 52:146-53; PMID:24361103; http://dx.doi.org/ 10.1016/j.jaut.2013.12.001 [DOI] [PubMed] [Google Scholar]
- 63.Jansen R, Batista S, Brooks AI, Tischfield JA, Willemsen G, van Grootheest G, Hottenga JJ, Milaneschi Y, Mbarek H, Madar V, et al.. Sex differences in the human peripheral blood transcriptome. BMC Genomics 2014; 15:33; PMID:24438232; http://dx.doi.org/ 10.1186/1471-2164-15-33 [DOI] [PMC free article] [PubMed] [Google Scholar]
- 64.Carrel L, Willard HF. X-inactivation profile reveals extensive variability in X-linked gene expression in females. Nature 2005; 434:400-4; PMID:15772666; http://dx.doi.org/ 10.1038/nature03479 [DOI] [PubMed] [Google Scholar]
- 65.Bermejo-Alvarez P, Rizos D, Lonergan P, Gutierrez-Adan A. Transcriptional sexual dimorphism during preimplantation embryo development and its consequences for developmental competence and adult health and disease. Reproduction 2011; 141:563-70; PMID:21339284; http://dx.doi.org/ 10.1530/REP-10-0482 [DOI] [PubMed] [Google Scholar]
- 66.Liu J, Morgan M, Hutchison K, Calhoun VD. A study of the influence of sex on genome wide methylation. PLoS One 2010; 5:e10028; PMID:20386599; http://dx.doi.org/ 10.1371/journal.pone.0010028 [DOI] [PMC free article] [PubMed] [Google Scholar]
- 67.McCarthy NS, Melton PE, Cadby G, Yazar S, Franchina M, Moses EK, Mackey DA, Hewitt AW. Meta-analysis of human methylation data for evidence of sex-specific autosomal patterns. BMC Genomics 2014; 15:981; PMID:25406947; http://dx.doi.org/ 10.1186/1471-2164-15-981 [DOI] [PMC free article] [PubMed] [Google Scholar]
- 68.Boks MP, Derks EM, Weisenberger DJ, Strengman E, Janson E, Sommer IE, Kahn RS, Ophoff RA. The relationship of DNA methylation with age, gender and genotype in twins and healthy controls. PLoS One 2009; 4:e6767; PMID:19774229; http://dx.doi.org/ 10.1371/journal.pone.0006767 [DOI] [PMC free article] [PubMed] [Google Scholar]
- 69.Ghahramani NM, Ngun TC, Chen PY, Tian Y, Krishnan S, Muir S, Rubbi L, Arnold AP, de Vries GJ, Forger NG, et al.. The effects of perinatal testosterone exposure on the DNA methylome of the mouse brain are late-emerging. Biol Sex Differ 2014; 5:8; PMID:24976947; http://dx.doi.org/ 10.1186/2042-6410-5-8 [DOI] [PMC free article] [PubMed] [Google Scholar]
- 70.Laguna-Barraza R, Bermejo-Alvarez P, Ramos-Ibeas P, de Frutos C, Lopez-Cardona AP, Calle A, Fernandez-Gonzalez R, Pericuesta E, Ramirez MA, Gutierrez-Adan A. Sex-specific embryonic origin of postnatal phenotypic variability. Reprod Fertil Dev 2012; 25:38-47; PMID:23244827; http://dx.doi.org/ 10.1071/RD12262 [DOI] [PubMed] [Google Scholar]
- 71.Arnold AP. The end of gonad-centric sex determination in mammals. Trends Genet 2012; 28:55-61; PMID:22078126; http://dx.doi.org/ 10.1016/j.tig.2011.10.004 [DOI] [PMC free article] [PubMed] [Google Scholar]
- 72.Adkins RM, Thomas F, Tylavsky FA, Krushkal J. Parental ages and levels of DNA methylation in the newborn are correlated. BMC Med Genet 2011; 12:47; PMID:21453505; http://dx.doi.org/ 10.1186/1471-2350-12-47 [DOI] [PMC free article] [PubMed] [Google Scholar]
- 73.Logan PC, Ponnampalam AP, Steiner M, Mitchell MD. Effect of cyclic AMP and estrogen/progesterone on the transcription of DNA methyltransferases during the decidualization of human endometrial stromal cells. Mol Hum Reprod 2013; 19:302-12; PMID:23233487; http://dx.doi.org/ 10.1093/molehr/gas062 [DOI] [PubMed] [Google Scholar]
- 74.Keramari M, Razavi J, Ingman KA, Patsch C, Edenhofer F, Ward CM, Kimber SJ. Sox2 is essential for formation of trophectoderm in the preimplantation embryo. PLoS One 2010; 5:e13952; PMID:21103067; http://dx.doi.org/ 10.1371/journal.pone.0013952 [DOI] [PMC free article] [PubMed] [Google Scholar]
- 75.Shimozaki K. Sox2 transcription network acts as a molecular switch to regulate properties of neural stem cells. World J Stem Cells 2014; 6:485-90; PMID:25258670; http://dx.doi.org/ 10.4252/wjsc.v6.i4.485 [DOI] [PMC free article] [PubMed] [Google Scholar]
- 76.Dahlhoff M, Pfister S, Blutke A, Rozman J, Klingenspor M, Deutsch MJ, Rathkolb B, Fink B, Gimpfl M, Hrabe de Angelis M, et al.. Peri-conceptional obesogenic exposure induces sex-specific programming of disease susceptibilities in adult mouse offspring. Biochim Biophys Acta 2014; 1842:304-17; PMID:24275555; http://dx.doi.org/ 10.1016/j.bbadis.2013.11.021 [DOI] [PubMed] [Google Scholar]
- 77.Chawengsaksophak K, Svingen T, Ng ET, Epp T, Spiller CM, Clark C, Cooper H, Koopman P. Loss of Wnt5a disrupts primordial germ cell migration and male sexual development in mice. Biol Reprod 2012; 86:1-12; PMID:21900680; http://dx.doi.org/ 10.1095/biolreprod.111.095232 [DOI] [PubMed] [Google Scholar]
- 78.Cunningham M, Gilkeson G. Estrogen receptors in immunity and autoimmunity. Clin Rev Allergy Immunol 2011; 40:66-73; PMID:20352526; http://dx.doi.org/ 10.1007/s12016-010-8203-5 [DOI] [PubMed] [Google Scholar]
- 79.Vina J, Gambini J, Lopez-Grueso R, Abdelaziz KM, Jove M, Borras C. Females live longer than males: role of oxidative stress. Curr Pharm Des 2011; 17:3959-65; PMID:22188448; http://dx.doi.org/ 10.2174/138161211798764942 [DOI] [PubMed] [Google Scholar]
- 80.Touleimat N, Tost J. Complete pipeline for Infinium((R)) Human Methylation 450K BeadChip data processing using subset quantile normalization for accurate DNA methylation estimation. Epigenomics 2012; 4:325-41; PMID:22690668; http://dx.doi.org/ 10.2217/epi.12.21 [DOI] [PubMed] [Google Scholar]
- 81.McCulloch CE, Searle SR, Neuhaus JM. Generalized, linear, and mixed models. Hoboken, N.J.: Wiley; 2008. [Google Scholar]
- 82.Henig N, Avidan N, Mandel I, Staun-Ram E, Ginzburg E, Paperna T, Pinter RY, Miller A. Interferon-beta induces distinct gene expression response patterns in human monocytes versus T cells. PLoS One 2013; 8:e62366; PMID:23626809; http://dx.doi.org/ 10.1371/journal.pone.0062366 [DOI] [PMC free article] [PubMed] [Google Scholar]
- 83.Reiner A, Yekutieli D, Benjamini Y. Identifying differentially expressed genes using false discovery rate controlling procedures. Bioinformatics 2003; 19:368-75; PMID:12584122; http://dx.doi.org/ 10.1093/bioinformatics/btf877 [DOI] [PubMed] [Google Scholar]
- 84.McCormack T, Frings O, Alexeyenko A, Sonnhammer EL. Statistical assessment of crosstalk enrichment between gene groups in biological networks. PLoS One 2013; 8:e54945; PMID:23372799; http://dx.doi.org/ 10.1371/journal.pone.0054945 [DOI] [PMC free article] [PubMed] [Google Scholar]
- 85.Kramer A, Green J, Pollard J Jr., Tugendreich S. Causal analysis approaches in Ingenuity Pathway Analysis. Bioinformatics 2014; 30:523-30; PMID:24336805; http://dx.doi.org/ 10.1093/bioinformatics/btt703 [DOI] [PMC free article] [PubMed] [Google Scholar]
- 86.Spurgeon SL, Jones RC, Ramakrishnan R. High throughput gene expression measurement with real time PCR in a microfluidic dynamic array. PLoS One 2008; 3:e1662; PMID:18301740; http://dx.doi.org/ 10.1371/journal.pone.0001662 [DOI] [PMC free article] [PubMed] [Google Scholar]
- 87.Singh RR, Patel KP, Routbort MJ, Reddy NG, Barkoh BA, Handal B, Kanagal-Shamanna R, Greaves WO, Medeiros LJ, Aldape KD, et al.. Clinical validation of a next-generation sequencing screen for mutational hotspots in 46 cancer-related genes. J Mol Diagn 2013; 15:607-22; PMID:23810757; http://dx.doi.org/ 10.1016/j.jmoldx.2013.05.003 [DOI] [PubMed] [Google Scholar]
- 88.Thorvaldsdottir H, Robinson JT, Mesirov JP. Integrative Genomics Viewer (IGV): high-performance genomics data visualization and exploration. Brief Bioinform 2013; 14:178-92; PMID:22517427; http://dx.doi.org/ 10.1093/bib/bbs017 [DOI] [PMC free article] [PubMed] [Google Scholar]
Associated Data
This section collects any data citations, data availability statements, or supplementary materials included in this article.