

Abstract
Renal cell tumors (RCTs) are the most lethal of the common urological cancers. The widespread use of imaging entailed an increased detection of small renal masses, emphasizing the need for accurate distinction between benign and malignant RCTs, which is critical for adequate therapeutic management. Histone methylation has been implicated in renal tumorigenesis, but its potential clinical value as RCT biomarker remains mostly unexplored. Hence, the main goal of this study was to identify differentially expressed histone methyltransferases (HMTs) and histone demethylases (HDMs) that might prove useful for RCT diagnosis and prognostication, emphasizing the discrimination between oncocytoma (a benign tumor) and renal cell carcinoma (RCC), especially the chromophobe subtype (chRCC). We found that the expression levels of 3 genes—SMYD2, SETD3, and NO66—was significantly altered in a set of RCTs, which was further validated in a large independent cohort. Higher expression levels were found in RCTs compared to normal renal tissues (RNTs) and in chRCCs comparatively to oncocytomas. SMYD2 and SETD3 mRNA levels correlated with protein expression assessed by immunohistochemistry. SMYD2 transcript levels discriminated RCTs from RNT, with 82.1% sensitivity and 100% specificity [area under curve (AUC) = 0.959], and distinguished chRCCs from oncocytomas, with 71.0% sensitivity and 73.3% specificity (AUC = 0.784). Low expression levels of SMYD2, SETD3, and NO66 were significantly associated with shorter disease-specific and disease-free survival, especially in patients with non-organ confined tumors. We conclude that expression of selected HMTs and HDMs might constitute novel biomarkers to assist in RCT diagnosis and assessment of tumor aggressiveness.
Keywords: epigenetic biomarkers, histone covalent modifications, histone methyltransferases, NO66, Renal cell tumors, SMYD2, SETD3
Introduction
Kidney cancer is the most lethal of the common urological cancers, with 337,860 new cases and 143,369 deaths registered worldwide in 2012.1 In the United States, 63,920 new cases and 13,860 deaths due to kidney cancer were estimated in 2014.2 Renal cell tumors (RCTs), which originate from renal tubule cells, are the most frequent kidney neoplasms, accounting for 85% to 90% of all cases.3 RCTs are a heterogeneous group of neoplasms, comprising several different histological subtypes, each with distinct morphologic, genetic, and clinical features. The four major RCT subtypes include 3 malignant tumors [clear cell renal cell carcinoma (ccRCC, the most common subtype, 75% of all RCT), papillary RCC (pRCC, 10% of all RCT), and chromophobe RCC (chRCC, 5% of all RCT)] and a benign tumor (renal oncocytoma), comprising 3 to 5% of all adult RCT.3 Due to their different clinical aggressiveness, accurate classification is required for appropriate patient management.
The widespread use of imaging techniques has increased the detection of small renal masses, requiring novel tools for accurate diagnosis. Currently, RCT diagnosis relies on histopathological examination of biopsy or surgical specimens, a task that is challenging owing to the overlapping features of some tumor subtypes. One of the most common diagnostic problems is the differential diagnosis between renal oncocytoma and chRCC, especially its eosinophilic variant.4,5 Although these tumors share some morphologic and imagiological features, they are biologically distinct, as chRCCs constitute low-grade malignant neoplasms that sometimes behave aggressively and carry a risk of recurrence and metastization, whereas oncocytomas are benign tumors, that might be more conservatively managed.6 Among RCC, prognostication is also a challenging task. Although pathological stage, nuclear grade, histologic subtype and performance status are commonly used in clinical practice,7 their ability to accurately predict tumor behavior is limited.8,9
Epigenetic alterations, comprising aberrations in DNA methylation patterns, deregulated chromatin machinery, and non-coding RNAs expression, play a critical role in neoplastic transformation, including renal carcinogenesis.10-12 The modulation of chromatin conformation through covalent posttranslational histone modifications is a fundamental mechanism of gene transcription regulation, which includes methylation, acetylation, phosphorylation, ubiquitylation, and sumoylation of specific residues.13 Specifically, histone methylation, occurring at the side chains of lysine or arginine residues, is a dynamic process mediated by histone methyltransferases (HMTs) and histone demethylases (HDMs). More than 50 HMTs and HDMs have been identified thus far and, unlike other histone modifications, methylation does not change the charged state of the residues and, therefore, the effect on gene expression is dependent on the residue and its methylation level (mono-, di-, or tri-methylation).14,15 In RCTs, the deregulation of chromatin machinery has been increasingly acknowledged as an important mechanism of neoplastic transformation (comprehensively reviewed in16), highlighting its potential role as diagnostic and prognostic biomarker.
The main goal of this study was to identify HMTs and HDMs that might be used as biomarkers to assist in diagnosis and prognosis of RCT. For that purpose, we screened 87 HMTs and HDMs genes for differential expression between normal renal tissue and RCT, as well as among RCT subtypes, with a particular emphasis on the discrimination of chRCC from oncocytoma. Differentially expressed genes were then validated in a large series of RCTs and renal normal tissues (RNT). Finally, its clinical usefulness as biomarkers was assessed and compared with standard clinicopathological parameters.
Results
Screening of histone methyltransferases and demethylases
Globally, the analysis of 58 HMTs and 29 HDMs expression levels in 5 chRCCs, 5 oncocytomas and 5 RNTs, disclosed HMTs upregulation in RCTs compared to RNTs. Conversely, HMTs and HDMs were generally downregulated in chRCCs compared to oncocytomas (Fig. S1). However, only SMYD2 (P = 0.01), SETD3 (P = 0.005), and NO66 (P = 0.014) showed significantly higher expression levels in RCTs compared to RNTs, and were simultaneously overexpressed in chRCCs in comparison to oncocytomas.
Validation of selected genes
Validation of SMYD2, SETD3 and NO66 by RT-qPCR in a series of 160 RCTs and 10 RNTs confirmed that these 3 enzymes were significantly overexpressed in RCTs compared to RNTs (P < 0.001 for SMYD2 and SETD3, P = 0.001 for NO66; Fig. 1A, 1-3). Additionally, expression levels of SETD3 and NO66 differed significantly between benign and malignant RCTs (P = 0.003 and P = 0.001, respectively; Fig. 1B, 1-3). Among the 4 RCT subtypes analyzed, chRCC displayed the highest expression levels for the 3 genes, followed by oncocytoma and then by pRCC and ccRCC (Fig. 1C, 1-3). Pairwise comparisons showed statistically significant differences of SMYD2, SETD3, and NO66 expression, in chRCC vs. pRCC (P < 0.001, P < 0.001, and P = 0.004, respectively) and chRCC vs. ccRCC (P < 0.001 for all), as well as for SETD3 and NO66 expression in oncocytoma vs. pRCC (P < 0.001 and P = 0.001, respectively) and oncocytoma vs. ccRCC (P < 0.001 for both). Additionally, SMYD2 expression levels differed significantly (P < 0.001) between chRCC vs. oncocytoma (Fig. 1C, 1-3), in this validation series.
Figure 1.
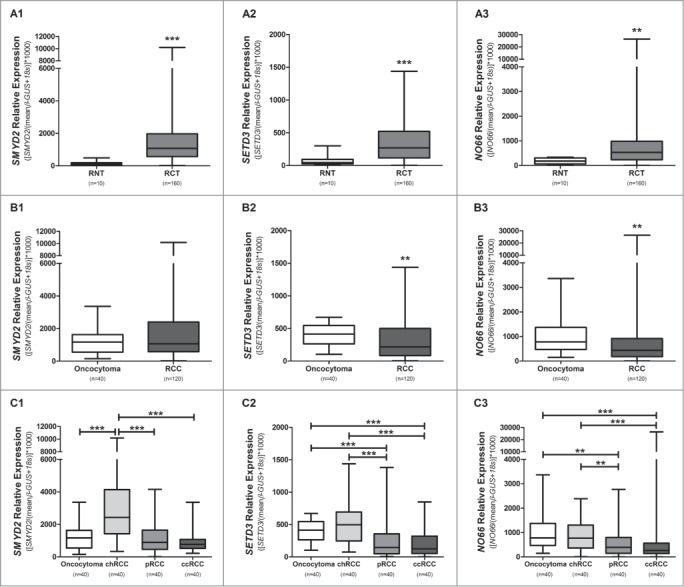
Distribution of expression levels of selected genes. Comparison between RCTs and RNTs for SMYD2 (A1), SETD3 (A2), and NO66 (A3). Benign tumors versus malignant tumors for SMYD2 (B1), SETD3 (B2), and NO66 (B3). Distribution of SMYD2 (C1), SETD3 (C2), and NO66 (C3) expression levels according to renal cell tumor subtype. (**** P < 0.0001; *** P < 0.001; ** P < 0.01).
Correlation analysis for SMYD2, SETD3, and NO66 expression in RCC revealed that these 3 genes were significantly co-expressed (SMYD2 – SETD3: r = 0.759; SMYD2 – NO66: r = 0.639; SETD3 – NO66: r = 0.741; P < 0.001 for all).
Association between gene expression and clinicopathological features
Clinical and pathological features of patients included in this study are depicted in Table 1. No significant differences in gender were apparent between RCT patients and controls (P = 0.524). In RCTs, NO66 expression levels were significantly higher in females (P = 0.044) and SMYD2 expression levels were associated with patient's age (P = 0.031). In malignant tumors, no statistically significant associations were disclosed between SMYD2, SETD3, or NO66 expression levels and pT (Table S1, Fig. S2), nor with pathological stage (P = 0.692, P = 0.724 and P = 0.843, respectivelly). SMYD2 and SETD3 expression levels were significantly higher in Fuhrman grade 1/2 vs. 3/4 ccRCCs and pRCCs (P = 0.045 and P = 0.021, respectively; Table S2, Fig. S3). Fuhrman grading was not applied to chRCCs because this grading system does not reflect chRCC clinical aggressiveness and an alternative grading system has been proposed.17
Table 1.
Clinical and pathological data of patients included in the present study
| Tumor | Normal | |
|---|---|---|
| Number of patients, n | 160 | 10 |
| Age, median (range) | 61 (29-86) | 67.5 (20-83) |
| Gender, n (%) | ||
| Male | 92 (57.5) | 7 (70.0) |
| Female | 68 (42.5) | 3 (30.0) |
| Histological subtype, n (%) | n.a. | |
| Clear cell RCC | 40 (25.0) | |
| Papillary RCC | 40 (25.0) | |
| Chromophobe RCC | 40 (25.0) | |
| Oncocytoma | 40 (25.0) | |
| pT, n (%) | n.a. | |
| pT1 | 68 (42.5) | |
| pT2 | 23 (14.4) | |
| pT3 | 29 (18.1) | |
| pT4 | 0 (0.0) | |
| n.a. (oncocytoma) | 40 (25) | |
| Pathological stage, n (%) | n.a. | |
| I | 68 (42.5) | |
| II | 23 (14.4) | |
| III | 25(15.6) | |
| IV | 4 (2.5) | |
| n.a. (oncocytoma) | 40 (25) | |
| Fuhrman grade, n (%) | n.a. | |
| 1 | 3 (1.9) | |
| 2 | 41 (25.6) | |
| 3 | 58 (36.3) | |
| 4 | 18 (11.3) | |
| n.a. | 40 (25.0) | |
| Metastasis, n (%) | 13 (10.8) | n.a. |
| Clear cell RCC | 4 (30.8) | |
| Papillary RCC | 7 (53.8) | |
| Chromophobe RCC | 2 (15.4) |
RCC, Renal Cell Carcinoma; n.a., not applicable
Diagnostic performance of selected genes
The diagnostic performance of SMYD2, SETD3, and NO66 mRNA expression was assessed in 3 different settings, using ROC curve analysis: (i) identification of RCTs vs. renal normal tissue; (ii) discrimination of malignant from benign RCTs; and (iii) distinction of chRCC from oncocytoma (Table 2). Whereas SMYD2 expression levels discriminated RCTs from normal kidney (80.6% sensitivity, 100% specificity, AUC = 0.961; Table 2 and Fig. 2), the performance of all 3 genes in distinction of malignant from benign tumors was modest (highest AUC = 0.671, for NO66) (Table 2). Finally, SMYD2 expression levels could distinguish chRCCs from oncocytomas (AUC = 0.794) with 72.5% sensitivity and 72.5% specificity (Table 2).
Table 2.
Validity estimates for each enzyme as a tissue biomarker
| (%) | SMYD2 (%) | SETD3 (%) | NO66 (%) | |
|---|---|---|---|---|
| SE | 80.6 | 85 | 65.63 | |
| SP | 100 | 80 | 100 | |
| PPV | 100 | 98.6 | 100 | |
| RCT vs. normal renal tissue | NPV | 24.4 | 25.0 | 15.4 |
| Accuracy | 81.8 | 84.7 | 67.6 | |
| AUC | 96.1 | 83.6 | 81.7 | |
| SE | 40.8 | 60.0 | 60.0 | |
| SP | 65.0 | 65.0 | 67.5 | |
| PPV | 77.8 | 83.7 | 84.7 | |
| RCC vs. oncocytoma | NPV | 26.8 | 35.1 | 36.0 |
| Accuracy | 46.9 | 61.3 | 61.9 | |
| AUC | 54.2 | 66.0 | 67.1 | |
| SE | 72.5 | 45.0 | 50.0 | |
| SP | 72.5 | 85.0 | 57.5 | |
| PPV | 72.5 | 75.0 | 54.1 | |
| chRCC vs.oncocytoma | NPV | 72.5 | 60.7 | 53.5 |
| Accuracy | 72.5 | 65.0 | 53.8 | |
| AUC | 79.4 | 59.1 | 52.3 |
Se: sensitivity; Sp: specificity; PPV: positive predictive value; NPV: negative predictive value; AUC, area under the curve; RCT, renal cell tumor; RCC, renal cell carcinoma; chRCC: chromophobe RCC
Figure 2.

Receiver operator characteristic (ROC) curves evaluating performance of SMYD2 (A), SETD3 (B), and NO66 (C) expression levels as biomarkers for discrimination between RCTs and RNTs (AUC: area under the curve).
Survival analysis
The median follow-up of RCC patients was 167 months (range: 1-391 months). When considering the 7 years period defined for survival analysis, 10 patients died and 13 developed metastasis. Patients with kidney-confined tumors (Stage I and Stage II) displayed a significantly higher disease-specific survival (DSS) (P < 0.001, respectively); however, no statistically significant difference was apparent for DFS (P = 0.055). DSS (P = 0.018), but not DFS, was also significantly different among the 3 RCC subtypes. DSS and DFS did not associate with age, gender, or Fuhrman grade for the 3 RCC subtypes in this series. However, considering only ccRCC and pRCC, Fuhrman grade 4 was associated with lower DSS (P < 0.001) and DFS (P < 0.001).
Focusing on the expression levels of the validated enzymes, survival analysis showed that low SMYD2, SETD3, and NO66 expression levels were significantly associated with shorter DSS (P = 0.012, P = 0.001, and P = 0.011, respectively; Fig. 3A) and DFS (P < 0.001, P < 0.001 and P = 0.001, respectively, Fig. 3B). When evaluating each enzyme's expression level and pT stage in multivariate analysis (pT and SMYD2 expression level; pT and SETD3 expression level; pT and NO66 expression level), low levels of all 3 genes and pT3 were significantly associated with shorter DSS, and low SMYD2 expression levels and pT3 were significantly associated with shorter DFS (Table S3). Similar results were depicted for pathological stage (pTNM; data not shown). Conversely, in a model comprising gender, histological subtype, pathological stage, SMYD2, SETD3, and NO66 expression levels simultaneously, only patients with tumors not confined to the kidney (Stage III / Stage IV) and that presented metastasis during the follow-up were found to have a significantly increased risk of death due to RCC. Moreover, patients with lower SMYD2 expression levels and tumors not confined to the kidney (Stage III / Stage IV) presented a significantly increased risk of RCC progression (Table 3).
Figure 3.
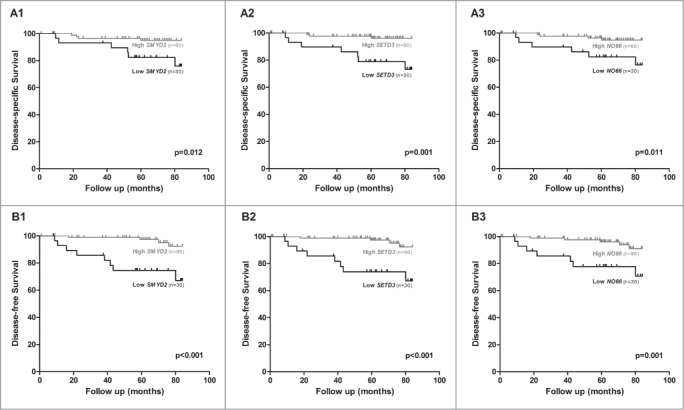
Kaplan-Meier with log-rank test estimates of disease-specific survival in 62 RCC patients according to expression levels of SMYD2 (A1), SETD3 (A2), and NO66 (A3); and of disease-free survival in 88 RCC patients according to expression levels of SMYD2 (B1), SETD3 (B2) and NO66 (B3). The results of RT-qPCR presented were categorized using first quartile (25th percentile) value as cutoff.
Table 3.
Prognostic factors for Renal Cell Carcinoma obtained by Cox regression analysis
| Prognostic Factor | Univariate Analysis |
Multivariate Analysis |
||||
|---|---|---|---|---|---|---|
| HR | 95% CI for HR | P value∞ | HR | 95% CI for HR | P value∞ | |
| Disease Specific Survival | ||||||
| Pathological Stage§ | 7.905 | 2.043-30.585 | 0.003 | 4.937 | 1.255-19.428 | 0.022 |
| Metastasis (during follow-up)ϕ | 35.88 | 7.599-169.36 | <0.001 | 27.378 | 5.702-131.459 | <0.001 |
| SMYD2 expression level* | 4.43 | 1.25-15.73 | 0.021 | 0.614 | ||
| SETD3 expression level* | 7.02 | 1.81-27.21 | 0.005 | 0.819 | ||
| NO66 expression level* | 4.50 | 1.27-15.99 | 0.02 | 0.705 | ||
| Histological Subtypeδ | ||||||
| chRCC | — | — | 0.046 | 0.407 | ||
| pRCC | 7.6 | 0.94-61.85 | 0.058 | 0.180 | ||
| ccRCC | 1.66 | 0.149-18.343 | 0.681 | 0281 | ||
| Genderψ | 0.231 | 0.680 | ||||
| Disease Free Survival | ||||||
| Pathological Stage§ | 2.81 | 0.94-8.38 | 0.064 | 3.31 | 1.105-9.887 | 0.032 |
| SMYD2 expression level* | 7.58 | 2.33-24.66 | 0.001 | 8.30 | 2.543-27.117 | <0.001 |
| SETD3 expression level* | 7.53 | 2.32-24.51 | 0.001 | 0063 | ||
| NO66 expression level* | 5.30 | 1.73-16.23 | 0.003 | 0.233 | ||
| Histological Subtypeδ | ||||||
| chRCC | — | — | 0.144 | 0.273 | ||
| pRCC | 3.97 | 0.82-19.13 | 0.086 | 0.118 | ||
| ccRCC | 1.63 | 0.30-8.95 | 0.575 | 0.152 | ||
| Genderψ | 0.238 | 0.965 | ||||
HR: Hazard Ratio; CI: Confidence Interval, n.s.: not significant.
Cox regression p value; significant when P < 0.05.
Stage I / Stage II vs Stage III / Stage IV; reference group: Stage I / Stage II.
Reference group: high expression level.
chRCC: chromophobe Renal Cell Carcinoma vs. pRCC: papillary Renal Cell Carcinoma vs. ccRCC: clear cell Renal Cell Carcinoma; Reference group: chRCC.
Reference group: Absence of metastasis.
Reference group: Male
Immunohistochemical evaluation of SMYD2 and SETD3 expression
Immunoreactivity for SMYD2 and SETD3 was observed in the cytoplasm. In normal renal parenchyma, weak to moderate SMYD2 and SETD3 expression was found in tubular epithelial cells. Oncocytomas and chRCC globally displayed higher staining intensity and/or percentage of positive cells, compared to ccRCC and pRCC, following the trend depicted for mRNA expression levels. Indeed, a significant association was documented between mRNA relative expression (RT-qPCR) and protein expression (immunohistochemistry) classified as high and low, both for SMYD2 (P = 0.002) and SETD3 (P = 0.008) (Fig. S4). However, SMYD2 and SETD3 immunoreactivity was not associated with Fuhrman grade (P = 0.403 and P = 0.110, respectively) in ccRCC and pRCC or with pathological stage (P = 0.636 and P = 0.609, respectively), DSS (P = 0.599 and P = 0.3 respectively), and DFS (P = 0.99 and P = 0.192, respectively) in RCC.
RNA expression and survival analysis of renal cell carcinoma patients from TCGA
Further validation of the results depicted for SMYD2, SETD3 and NO66 expression was performed in a larger and independent dataset from TCGA, including RNAseq expression data from 889 RCC patients (533 ccRCC, 290 pRCC, and 66 chRCC) and 129 matched normal samples (n = 72, n = 32, and n = 25, respectively; Table S4). SMYD2 expression was significantly higher (P < 0.0001), and SETD3 expression significantly lower (P < 0.0001), in RCC than in matched normal samples, whereas no statistically significant difference was disclosed for NO66 expression (Fig. 4A). Similarly to the results found in our series, for all 3 genes, statistically significant higher expression levels were found in chRCC compared to pRCC and ccRCC (Fig. 4B). Correlation analysis for SMYD2, SETD3, and NO66 expression showed that SMYD2 was significantly co-expressed with SETD3 (r = 0.24, P < 0.0001) and SETD3 with NO66 (r = 0.28, P < 0.0001) in RCTs.
Figure 4.
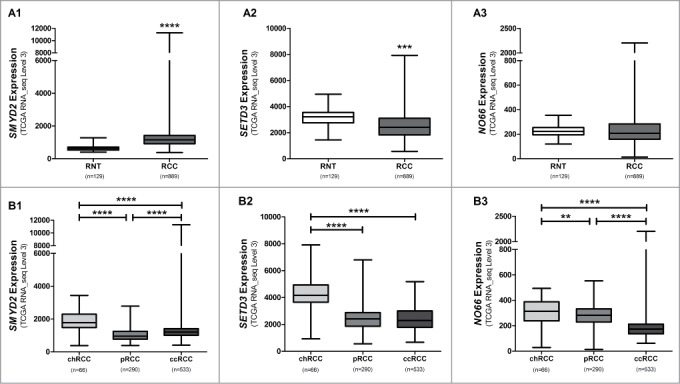
Distribution of expression levels of selected genes from the TCGA data set (http://tcga-data.nci.nih.gov/tcga/dataAccessMatrix.htm. Accessed 2015). Comparison between RCCs and RNTs for SMYD2 (A1), SETD3 (A2), and NO66 (A3). Distribution of SMYD2 (B1), SETD3 (B2), and NO66 (B3) expression levels according to renal cell carcinoma subtype. (**** P < 0.0001; *** P < 0.001; ** P < 0.01).
SETD3 and NO66 expression levels were significantly lower (P < 0.0001 and P = 0.045, respectively) in pT1/pT2 vs. pT3 RCCs, whereas no statistically significant difference was observed for SMYD2 (Fig. S5). Conversely, lower grade (Fuhrman grade 1/2) ccRCC also displayed a significantly higher SETD3 expression than tumors with higher grade (Fuhrman 3/4; Fig. S6).
The median follow-up of RCC patients from TCGA was 29.4 months (range: 0-195 months), in which 212 patients died and 92 developed metastasis. A significantly higher risk of death due to RCC was detected in ccRCC patients with non-organ confined tumors (Stage III and Stage IV), lower SETD3 expression, that developed metastasis during follow-up and with ccRCC and pRCC (compared to chRCC), in multivariate analysis (P < 0.0001; Table 4). Interestingly, Stage III / Stage IV tumors and lower NO66 expression levels associated with shorter time to disease progression in multivariate analysis (P < 0.001 and P = 0.018, respectively) (Table 4).
Table 4.
Prognostic factors for TCGA dataset (http://tcga-data.nci.nih.gov/tcga/dataAccessMatrix.htm. Accessed 2014) by Cox regression analysis
| Prognostic Factor | Univariate Analysis |
Multivariate Analysis |
||||
|---|---|---|---|---|---|---|
| HR | 95% CI for HR | P value∞ | HR | 95% CI for HR | P value∞ | |
| Disease Specific Survival | ||||||
| Pathological Stage§ | 4.81 | 3.61-6.42 | <0.0001 | 3.00 | 2.14-4.22 | <0.0001 |
| Metastasis (during follow-up)ϕ | 6.14 | 4.59-8.20 | <0.0001 | 2.62 | 1.86-3.70 | <0.0001 |
| SMYD2 expression level* | 0.143 | 0.159 | ||||
| SETD3 expression level* | 2.58 | 1.95-3.40 | <0.0001 | 1.85 | 1.39-2.46 | <0.0001 |
| NO66 expression level* | 0.220 | 0.850 | ||||
| Histological Subtypeδ | ||||||
| chRCC | — | — | <0.0001 | — | — | 0.047 |
| pRCC | 1.97 | 0.97-4.01 | 0.063 | 2.54 | 1.06-6.12 | 0.037 |
| ccRCC | 3.48 | 1.83-6.61 | <0.0001 | 2.83 | 1.24-6.48 | 0.014 |
| Genderψ | 0.625 | 0.196 | ||||
| Disease Free Survival | ||||||
| Pathological Stage§ | 5.79 | 2.23-15.00 | <0.0001 | 7.51 | 2.77-20.37 | <0.0001 |
| SMYD2 expression level* | 0.809 | 0.751 | ||||
| SETD3 expression level* | 3.91 | 1.48-10.36 | 0.006 | 0.100 | ||
| NO66 expression level* | 4.42 | 1.62-12.06 | 0.004 | 4.74 | 1.30-17.26 | 0.018 |
| Histological Subtypeδ | ||||||
| chRCC | — | — | 0.882 | 0.707 | ||
| pRCC | 1.4e5 | 0-7.5e108 | 0.923 | 0.921 | ||
| ccRCC | 1.8e5 | 0-9.7e108 | 0.921 | 0.925 | ||
| Genderψ | 0.972 | 0.449 | ||||
HR: Hazard Ratio; CI: Confidence Interval, n.s.: not significant.
Cox regression p value; significant when P < 0.05.
Stage I / Stage II vs Stage III / Stage IV; reference group: Stage I / Stage II.
Reference group: high expression level.
chRCC: chromophobe Renal Cell Carcinoma vs. pRCC: papillary Renal Cell Carcinoma vs. ccRCC: clear cell Renal Cell Carcinoma; Reference group: chRCC.
Reference group: Absence of metastasis.
Reference group: Male
When analyzing each subtype separately, multivariate analysis revealed that Stage III / Stage IV was associated with shorter DSS in all subtypes and shorter DFS in ccRCC and pRCC; occurrence of metastasis during follow-up with shorter DSS in ccRCC and pRCC; low SETD3 expression levels with shorter DSS in ccRCC and pRCC and with shorter DFS in pRCC; and low NO66 expression levels with shorter DSS in pRCC (Table S5). DFS analysis was not performed to chRCC due to insufficient available data in the TGCA database.
Discussion
The incidental diagnosis of small renal masses has increased in recent years, and current imaging techniques, even when complemented with biopsy, are limited in discriminating benign from malignant entities, leading to surgical intervention in cases in which it might be spared and the patient be managed conservatively. Epigenetic-based biomarkers, including histone posttranslational modifications and chromatin modulators, hold the promise to assist in diagnosis through the discrimination between normal and neoplastic tissue or between benign and malignant tumors, helping in prognostication and stratifying patients according to risk of disease progression. Evidence of widespread deregulation of chromatin status in RCTs has been accumulating, and several defects in epigenetic enzymes, including those responsible for chromatin packaging, histone modifications, and chromatin remodeling, have been reported.18,19
In this study, we focused on altered histone methylation patterns and screened the expression of HMTs and HDMs genes in RNT, oncocytomas and chRCCs to determine whether their expression levels might be used as diagnostic biomarkers to discriminate normal from neoplastic renal tissue, as well as benign (oncocytoma) from malignant RCTs (especially chRCC). For most of the genes assessed, differences in expression levels between normal and neoplastic samples were in line with previous reports on their role in cancer. Thus, SETD2, a putative tumor suppressor in ccRCC,20 was mostly downregulated in RCT compared to RNTS, and a similar trend was apparent for KDM5C, also reported to have a tumor suppressive effect.21 KDM6A, previously reported to be overexpressed in RCTs,22 was found to be the second most upregulated gene in RCTs in our analysis. A divergent behavior was, however, observed for EZH2, previously shown to be upregulated in ccRCCs compared to adjacent normal tissues,22,23 whereas we found EZH2 downregulation in RCTs. Notwithstanding this latter result, which might be due to the small number of cases or the main histological subtype (chRCC) used for array analysis in our study, and/or the use of adjacent morphologically normal renal tissue as control (which we have found to harbor epigenetic alterations24) in the aforementioned studies, the overall results of the array and the agreement found for the 3 genes validated in a series of 160 primary tumors, as well as in GEO database (http://www.ncbi.nlm.nih.gov/gds) published array data,25 argue in favor of the validity of our strategy for discovery of HDMs and HMTs as RCT biomarkers.
We found that 2 histone methyltransferases, SMYD2 and SETD3, and a histone demethylase, NO66,14 were significantly upregulated in RCTs compared to RNTs, and in chRCC compared to oncocytoma, in the screening array. SMYD2 targets lysines 4 and 36 of histone H3, as well as non-histone proteins including p53, RB1, HSP90, and PARP-1.26-34 It plays an important role in muscle function, mediating the methylation of Hsp90, which stabilizes the sarcomeric region,29 and in the early stages of embryonic differentiation.35 In cancer, SMYD2 is overexpressed in bladder cancer36 and leukemia,37 as well as in esophageal squamous cell carcinoma and gastric carcinoma.38,39 SETD3, which also methylates lysines 4 and 36 of histone H3, promotes differentiation of muscle cells40 and is overexpressed in lymphomas, displaying oncogenic potential.41 NO66, which specifically targets lysines 4 and 36 of histone H3,42 is involved in bone differentiation (osteoblast differentiation and bone formation),43 inducing chromatin repression through histone demethylation during osteoblast differentiation.44
Our screening data are in line with “GEO Data sets” publically available expression array data (http://www.ncbi.nlm.nih.gov/gds) of 18 cases, comprising 9 chRCC and 9 oncocytomas,25 which also revealed a higher expression of SMYD2, SETD3, and NO66 in chRCC compared to oncocytoma (Table S6). Importantly, this pattern of expression was also retained in our validation series: chRCC and oncocytoma displayed higher expression levels than ccRCC and pRCC. This finding might denote the common cellular origin of ccRCC and pRCC, on the one hand, and of chRCC and oncocytoma, on the other, as previously suggested.45 Indeed, expression levels of these 3 enzymes were significantly different between chRCC and pRCC, as well as between chRCC and ccRCC, both in our validation series and in the TCGA database. Additionally, SMYD2 expression levels differed significantly between chRCCs and oncocytomas, indicating a potential for discriminating among these 2 RCT subtypes, which frequently display overlapping and confounding morphological features that might impair differential diagnosis, especially in small biopsies. Importantly, mutational analysis data accessible in the COSMIC database (http://cancer.sanger.ac.uk/cosmic)46 revealed that, in RCC, SMYD2, and SETD3 mutations are exceedingly rare [mutation rate of 0.22% (3/1345) and 0.32% (4/1253), respectively] and were not reported for NO66. Thus, it seems unlikely that the differences in gene expression we observed might be due to genetic alterations.
We also found significantly higher expression levels of SMYD2, SETD3, and NO66 in RCTs than in RNTs in the validation series. These results are similar to those observed in the TCGA dataset for SMYD2 expression, keeping in mind that in our validation series the normal tissue was collected from non-RCT patients, whereas in TCGA database morphologically matched normal renal tissue from RCC patients was analyzed. This difference in normal samples may account for the higher SETD3 expression in normal tissue than in RCC noted in the TCGA data set. Moreover, among the 3 validated genes, SMYD2 expression levels also displayed the best diagnostic performance for distinction between RCTs and normal renal tissue, thus increasing the spectrum of scenarios in which it may assist in diagnosis and classification of suspicious renal lesions. When compared to other molecular techniques, FISH was reported to allow the identification of RCT subtypes,47 specially to distinguish chRCC from oncocytoma,48 but the overlapping genetic alterations mainly between chRCC and oncocytoma might hamper differential diagnosis.49 A molecular algorithm based on qPCR gene expression correctly identified the RCC subtype in 83.3% of cases,50 and CGH allowed for the correct diagnosis in 93.5% of ccRCC, 100% of pRCC, 61.5% of chRCC, and 14.3% of oncocytomas,51 although in both studies less than 80 cases were analyzed.
Interestingly, SMYD2 and SETD3 differential expression at transcript level was also apparent at protein level, as assessed by immunohistochemistry, and a statistically significant correlation between the 2 parameters was found. However, the wide variation in immunoexpression within RCT subtype and across subtypes precludes its use as an ancillary tool for histopathological evaluation. Notwithstanding, owing to the increasing availability and use of molecular techniques in diagnostic pathology, the assessment of mRNA expression in tissue samples or in fine-needle aspirates of suspicious lesions is within the reach of many molecular pathology laboratories.
Besides its potential role as diagnostic biomarkers, we aimed also at characterizing the prognostic value of HMTs and HDMs expression in RCCs. Interestingly, low SMYD2, SETD3, and NO66 expression levels associated with worse disease-specific survival and disease-free survival, in univariate analysis. The prognostic value of SMYD2 overexpression has been reported in leukemia,37,38 esophageal squamous cell carcinoma,37,38 and gastric carcinoma,39 contrarily to our findings in RCC. Besides differences in tumor model, it should be emphasized that survival analyses in our series were mostly influenced by pRCC and ccRCC, which displayed the lowest expression levels for the 3 validated genes, and that are acknowledged as the most aggressive RCC subtypes. Furthermore, in multivariate analysis assessing the expression level of each gene, pT, histological subtype, and gender, statistical significance was retained for pT and expression level for the 3 enzymes, both for DSS and DFS, with low expression level and pT3 associating with worse prognosis, thus indicating that each gene independently adds prognostic information to pT stage. When combining the expression levels of the 3 genes with pathological stage, occurrence of metastasis during follow-up, histological subtype, and gender, for our series and for the TCGA dataset separately, Stage III / Stage IV and the development of metastasis associated with shorter DSS in both cohorts. Furthermore, low SETD3 expression and ccRCC and pRCC (compared to chRCC) subtypes also associated with decreased DSS, but only in the TCGA data set. A shorter DFS was associated with low SMYD2 expression levels and Stage III / Stage IV in our series, and low NO66 and Stage III / Stage IV in the TCGA dataset. These differences might be due to (i) cohort size, (ii) dissimilar proportions of the 3 histological subtypes in the 2 cohorts, or (iii) differences in period of follow-up. Since the number of events, both cancer-specific deaths and development of metastasis, were scarce in our series, mainly in the ccRCC (subtypes 2 and 4, respectively) and chRCC (subtypes 1 and 2, respectively), survival analysis was not performed separately for each subtype. To overcome this limitation, TCGA data set was further explored. Interestingly, when analyzing each subtype separately in multivariate analysis, SETD3 was associated with shorter DSS in ccRCC and shorter DSS and DFS in pRCC, underlining the potential clinical value of SETD3 as a prognostic biomarker.
To the best of our knowledge, only a few studies have addressed the role of SMYD2, SETD3, and NO66 in tumorigenesis, as previously described, although none has included RCTs. The knowledge of the specific role of SMYD2, SETD3, and NO66 in renal carcinogenesis, uncovering the participation of these enzymes in the neoplastic transformation of renal epithelium and in RCC progression, might additionally provide a stronger biological rational for its use as clinically useful diagnostic and prognostic biomarkers.
Patients and Methods
Patients and sample collection
A total of 160 RCTs, comprising ccRCCs, pRCCs, chRCCs, and oncocytomas (40 cases of each type), were prospectively collected from patients consecutively diagnosed and submitted to nephrectomy at the Portuguese Oncology Institute – Porto, between 2001 and 2014. As controls, 10 renal normal tissue (RNT) samples were collected from morphologic normal kidneys of patients subjected to nephrectomy due to upper urinary tract urothelial carcinoma. All specimens were immediately frozen after surgery and stored at −80ºC. Sampling of more than 70% of malignant cell was confirmed by 2 slides stained with hematoxylin and eosin (H&E) taken before and after frozen section collection for RNA extraction. Routine histological slides from formalin-fixed paraffin-embedded (FFPE) tissue of the same surgical specimens were assessed for diagnosis, TNM staging, and Fuhrman grading. Relevant clinical data was also collected from clinical charts. This study was approved by the Institutional Review Board of Portuguese Oncology Institute – Porto [Comissão de Ética para a Saúde-(CES-IPOFG-EPE 518/10)].
RNA extraction
Samples were suspended in TRIzol® reagent (Invitrogen™, Cat.#15596018) and chloroform (Merk Millipore, Cat.#MCX10601) was added to the lysed cells. Total RNA was purified using the Ambion® PureLink RNA Mini Kit (Invitrogen™, Cat.#12183025), according to manufacturer recommendations. RNA concentrations and purity ratios were determined using a NanoDrop ND-1000 spectrophotometer (NanoDrop Technologies) and RNA quality was verified by electrophoresis.
Screening of histone methyltransferases and demethylases
A total of 10 RCT (5 oncocytomas and 5 chRCCs) and 5 RNT samples were treated with Ambion® TURBO DNA-free™ kit (Invitrogen, Cat.#1907) to remove any DNA contamination, and then 1 μg of total RNA was reversely transcribed using the High Capacity cDNA Reverse Transcription kit (Applied Biosystems®, Cat.#4368814) according to manufacturer instructions. Expression of histone methylation enzymes (58 HMTs and 29 HDMs), was assessed by RT-qPCR using custom made TaqMan® Array 96-Well expression Plates (Applied Biosystems®, Cat.#4391528) in an ABI-7500 Real-Time PCR system (Applied Biosystems®, Cat.#4351105).
Each gene was run in triplicate and the amount of mRNA was normalized to Glucuronidase β (GUSβ) and Human 18S rRNA (18S) reference genes. Comparative CT method was used to determine the fold-difference in gene expression between RNT and RCT, as well as between chRCC and oncocytoma. Genes that reached statistically significant differences in expression levels between these groups, and displayed higher or lower expression levels in RCT vs. RNT or in chRCC vs. oncocytoma, were selected for further analysis.
Validation of selected enzymes
Candidate genes' mRNA levels were evaluated in a larger series of 160 RCTs, including 40 ccRCCs, 40 pRCCs, 40 chRCCs, 40 oncocytomas, and 10 RNTs. A total of 300ng was reversely transcribed and amplified using TransPlex®Whole Transcriptome Amplification Kit (Sigma-Aldrich®, Cat.#WTA1) purified with QIAquick PCR Purification Kit (QIAGEN, Cat.#28106), and mRNA levels were evaluated using TaqMan® Gene Expression Assays [Applied Biosystems®, Cat.# Hs00220210 m1 (SMYD2), Hs00260120 m1 (SETD3), Hs02743012 s1 (NO66), Hs99999908 m1 (GUSB), Hs99999901 s1 (18s)], according to manufacturer's instructions. For each sample, expression levels were normalized using 2 internal reference genes, GUSβ and 18S, according to the formula: target gene relative expression = target gene expression level / [(GUSβ expression level + 18S expression level) / 2]. Each plate included multiple non-template controls and serial dilutions of a cDNA Human Reference Total RNA (Agilent Technologies, Cat.#750500) to construct a standard curve.
Immunohistochemistry
A representative slide from 120 RCT cases of the validation cohort (30 cases available from each subtype) was selected and 4 µm sections from FFPE tissue were obtained. Briefly, after deparaffinization antigen retrieval was performed by heating (20 min) in an antigen unmasking solution (Vector Laboratories, Cat.#H3300), endogenous peroxidase activity was neutralized with 0.6% hydrogen peroxide (Merk Millipore, Cat.#107298) for 20 minutes. Then, protein detection was performed using the Novolink™Max Polymer Detection System (Leica Biosystems, Cat.#RE7260-K), according to manufacturer instructions. Slides were incubated in a humid chamber with rabbit polyclonal antibodies, specific for SET and MYND domain containing 2 (SMYD2) (Sigma Aldrich®, Cat.#HPA029023) in a 1:250 dilution (4ºC, overnight) and specific for SET domain containing 3 (SETD3) (Novus Biologicals®, Cat.#NBP-88416) in a 1:200 dilution (room temperature, 1 hr). For NO66 several primary antibodies were tested but none was found to provide reliable results.
All washings were performed with Tris buffered saline with Tween® 20 (TBS-T) (Sigma-Aldrich®, Cat.#T9039). To unveil antigen-antibody binding reaction, slides were incubated for 7 minutes, in the dark, in a 0.05% (m/v) 3, 3′-diaminobenzidine (DAB) solution (Sigma-Aldrich®, Cat.#D7304) in phosphate-buffered saline (PBS) (Biochrom Ltd., Cat.#L1835). Then, slides were counterstained with hematoxylin (Merck Millipore, Cat.#105174), dehydrated and diaphanized.
Slides were evaluated by 2 pathologists for SMYD2 and SETD3 immunoexpression and classified using a semi-quantitative scale for both staining intensity (0 – no staining; 1 – intensity lower than normal kidney; 2 – intensity equal to normal kidney; 3 – intensity higher than normal kidney) and percentage of positive cells (0 – < 10%; 1 – 10-33%; 2 – 33-67%; 3 – >67%), in each tumor. Staining intensity and percentage of positive cell scores were combined (Score S = staining intensity x percentage of positive cells) to assign a composite score in each tumor, which was then stratified into low expression (S < 4) and high expression (S ≥ 4) groups, which basically correspond to RCTs with less than 33% stained cells or staining intensity lower than normal kidney, and RCTs with at least 33% stained cells with an intensity equal or higher than normal kidney.
TCGA dataset analysis in renal cell carcinoma patients
The Cancer Genome Atlas (TCGA) was used to obtain data on SMYD2, SETD3 and NO66 expression and clinical information, when available, from renal cell carcinoma patients and matched normal tissue samples.52 All expression data from samples hybridized by the University of North Carolina, Lineberger Comprehensive Cancer Center, using Illumina HiSeq 2000 RNA Sequencing version 2 analysis, were downloaded from TCGA data matrix (http://tcga-data.nci.nih.gov/tcga/tcgaDownload.jsp).52 This data set included 533 ccRCC and 72 matched normal patient samples, 290 pRCC and 32 matched normal patient samples, and 66 chRCC and 25 matched normal patient samples. To prevent duplicates, when there was more than one portion per patient, median values were used. The provided value was pre-processed and normalized according to “level 3” specifications of TCGA (see http://cancergenome.nih.gov/dataportal/ for details). Clinical data of each patient was provided by the Biospecimen Core Resources (BCRs). This data is available for download through TCGA data matrix (http://tcga-data.nci.nih.gov/tcga/dataAccessMatrix.htm).52
Statistical analysis
Chi-square, Fisher's exact test and, non-parametric tests were used to ascertain the statistical significance of differences among groups of samples, namely Kruskal-Wallis test (KW) for multiple comparisons and Mann-Whitney U test (MW) for pair-wise comparisons, as appropriate. Spearman's test was carried out to ascertain correlations between age and HMTs or HDMs expression levels, as well as between HMTs and HDMs mRNA expression levels.
Receiver operator characteristics (ROC) curves were constructed to assess the diagnostic performance of biomarkers, by plotting the true positive rate (sensitivity) against the false positive rate (1-specificity), and the area under the curve (AUC) was calculated. Sensitivity, specificity, positive and negative predictive values, and accuracy were calculated based on cutoff values based on ROC curve analysis, prioritizing specificity and then sensitivity.
For survival analysis, a 7-year follow-up time was considered, both for disease-specific survival (DSS) and disease free survival (DFS), as patient recruitment occurred during 13 years. Prognostic significance of standard clinicopathological variables (histological subtype, pathological stage, Fuhrman grade, age, gender) and as well as of HMTs and HDMs expression levels, was assessed by constructing disease-specific and disease-free survival curves using the Kaplan-Meier method, with log-rank test and Cox-regression analysis for each variable (univariate test). For this purpose, expression levels of SMYD2, SETD3, and NO66 were classified as low or high based on the 25th percentile expression value of each gene. Similarly, SMYD2 and SETD3 immunoreactivity was classified as low or high according to Score S. A Cox-regression model using Forward Stepwise (conditional) test comprising the different variables (multivariate test) was also performed, including the 160 RCC patients, both for disease-specific (DSS) and disease-free (DFS) survival. A similar Cox-regression analysis (univariate and multivariate) was performed for patients from the TCGA dataset, and expression levels were classified as low or high based on the 25th percentile expression value of each gene, too.
Statistical significance was set at P < 0.05. Bonferroni's correction was applied for pairwise comparisons following multiple groups' analyses. Statistical analysis was performed using SPSS software for Windows, version 22.0 (IBM-SPSS Inc.), and graphs were built using GraphPad Prism 6.0 software for Windows (GraphPad Software Inc.).
Disclosure of Potential Conflicts of Interest
No potential conflicts of interest were disclosed.
Funding
This study was funded by research grants from Research Center of Portuguese Oncology Institute – Porto (CI-IPOP 4-2012) and European Community's Seventh Framework Program – Grant number FP7-HEALTH-F5-2009-241783. ASP-L and FQV are and were supported by FCT-Fundação para a Ciência e a Tecnologia grants (SFRH/SINTD/94217/2013 and SFRH/BD/70564/2010, respectively).
Supplemental Material
Supplemental data for this article can be accessed on the publisher's website
References
- 1.Ferlay J SI EM, Dikshit R, Eser S, Mathers C, Rebelo M, Parkin DM, Forman D, Bray F. Cancer Incidence and Mortality Worldwide: IARC CancerBase No.11. GLOBOCAN 2012. v10 Lyon, France: International Agency for Research on Cancer, 2013. [DOI] [PubMed] [Google Scholar]
- 2.Siegel R, Ma J, Zou Z, Jemal A. Cancer statistics, 2014. CA Cancer J Clin 2014; 64:9-29; PMID:24399786 [DOI] [PubMed] [Google Scholar]
- 3.Moch H. An overview of renal cell cancer: pathology and genetics. Semin Cancer Biol 2013; 23:3-9. [DOI] [PubMed] [Google Scholar]
- 4.Brimo F, Epstein JI. Selected common diagnostic problems in urologic pathology: perspectives from a large consult service in genitourinary pathology. Arch Pathol Lab Med 2012; 136:360-71; PMID:22458899; http://dx.doi.org/ 10.5858/arpa.2011-0187-RA [DOI] [PubMed] [Google Scholar]
- 5.Abrahams NTP. Epithelial Neoplasms of the Renal Cortex In: Lager D AN, ed. Practical Renal Pathology: A Diagnostic Approach. Philadelphia, PA: Elsevier Inc, 2013. [Google Scholar]
- 6.Ng KL, Rajandram R, Morais C, Yap NY, Samaratunga H, Gobe GC, Wood ST. Differentiation of oncocytoma from chromophobe renal cell carcinoma (RCC): can novel molecular biomarkers help solve an old problem? J Clin Pathol 2014; 67:97-104; PMID:24170213; http://dx.doi.org/ 10.1136/jclinpath-2013-201895 [DOI] [PubMed] [Google Scholar]
- 7.Ljungberg B, Cowan NC, Hanbury DC, Hora M, Kuczyk MA, Merseburger AS, Patard JJ, Mulders PF, Sinescu IC, European Association of Urology Guideline G. EAU guidelines on renal cell carcinoma: the 2010 update. Eur Urol 2010; 58:398-406; PMID:20633979; http://dx.doi.org/ 10.1016/j.eururo.2010.06.032 [DOI] [PubMed] [Google Scholar]
- 8.Kim HL, Seligson D, Liu X, Janzen N, Bui MH, Yu H, Shi T, Belldegrun AS, Horvath S, Figlin RA. Using tumor markers to predict the survival of patients with metastatic renal cell carcinoma. J Urol 2005; 173:1496-501; PMID:15821467; http://dx.doi.org/ 10.1097/01.ju.0000154351.37249.f0 [DOI] [PubMed] [Google Scholar]
- 9.Parker AS, Leibovich BC, Lohse CM, Sheinin Y, Kuntz SM, Eckel-Passow JE, Blute ML, Kwon ED. Development and evaluation of BioScore: a biomarker panel to enhance prognostic algorithms for clear cell renal cell carcinoma. Cancer 2009; 115:2092-103; PMID:19296514; http://dx.doi.org/ 10.1002/cncr.24263 [DOI] [PMC free article] [PubMed] [Google Scholar]
- 10.Jeronimo C, Henrique R. Epigenetic biomarkers in urological tumors: A systematic review. Cancer Lett 2014; 342:264-74; PMID:22198482; http://dx.doi.org/ 10.1016/j.canlet.2011.12.026 [DOI] [PubMed] [Google Scholar]
- 11.Henrique R, Luis AS, Jeronimo C. The epigenetics of renal cell tumors: from biology to biomarkers. Front Genet 2012; 3:94; PMID:22666228; http://dx.doi.org/ 10.3389/fgene.2012.00094 [DOI] [PMC free article] [PubMed] [Google Scholar]
- 12.Silva-Santos RM, Costa-Pinheiro P, Luis A, Antunes L, Lobo F, Oliveira J, Henrique R, Jeronimo C. MicroRNA profile: a promising ancillary tool for accurate renal cell tumour diagnosis. Br J Cancer 2013; 109:2646-53; PMID:24129247; http://dx.doi.org/ 10.1038/bjc.2013.552 [DOI] [PMC free article] [PubMed] [Google Scholar]
- 13.Bannister AJ, Kouzarides T. Regulation of chromatin by histone modifications. Cell Res 2011; 21:381-95; PMID:21321607; http://dx.doi.org/ 10.1038/cr.2011.22 [DOI] [PMC free article] [PubMed] [Google Scholar]
- 14.Arrowsmith CH, Bountra C, Fish PV, Lee K, Schapira M. Epigenetic protein families: a new frontier for drug discovery. Nat Rev Drug Discov 2012; 11:384-400; PMID:22498752; http://dx.doi.org/ 10.1038/nrd3674 [DOI] [PubMed] [Google Scholar]
- 15.Mosammaparast N, Shi Y. Reversal of histone methylation: biochemical and molecular mechanisms of histone demethylases. Annu Rev Biochem 2010; 79:155-79; PMID:20373914; http://dx.doi.org/ 10.1146/annurev.biochem.78.070907.103946 [DOI] [PubMed] [Google Scholar]
- 16.Vieira-Coimbra M, Henrique R, Jeronimo C. New insights on chromatin modifiers and histone post-translational modifications in renal cell tumours. Eur J Clin Invest 2015; 45 Suppl 1:16-24; PMID:25524582; http://dx.doi.org/ 10.1111/eci.12360 [DOI] [PubMed] [Google Scholar]
- 17.Paner GP, Amin MB, Alvarado-Cabrero I, Young AN, Stricker HJ, Moch H, Lyles RH. A novel tumor grading scheme for chromophobe renal cell carcinoma: prognostic utility and comparison with Fuhrman nuclear grade. Am J Surg Pathol 2010; 34:1233-40; PMID:20679882; http://dx.doi.org/ 10.1097/PAS.0b013e3181e96f2a [DOI] [PubMed] [Google Scholar]
- 18.Larkin J, Goh XY, Vetter M, Pickering L, Swanton C. Epigenetic regulation in RCC: opportunities for therapeutic intervention? Nat Rev Urol 2012; 9:147-55; PMID:22249190; http://dx.doi.org/ 10.1038/nrurol.2011.236 [DOI] [PubMed] [Google Scholar]
- 19.Ramakrishnan S, Ellis L, Pili R. Histone modifications: implications in renal cell carcinoma. Epigenomics 2013; 5:453-62; PMID:23895657; http://dx.doi.org/ 10.2217/epi.13.40 [DOI] [PMC free article] [PubMed] [Google Scholar]
- 20.Duns G, van den Berg E, van Duivenbode I, Osinga J, Hollema H, Hofstra RM, Kok K. Histone methyltransferase gene SETD2 is a novel tumor suppressor gene in clear cell renal cell carcinoma. Cancer Res 2010; 70:4287-91; PMID:20501857; http://dx.doi.org/ 10.1158/0008-5472.CAN-10-0120 [DOI] [PubMed] [Google Scholar]
- 21.Niu X, Zhang T, Liao L, Zhou L, Lindner DJ, Zhou M, Rini B, Yan Q, Yang H. The von Hippel-Lindau tumor suppressor protein regulates gene expression and tumor growth through histone demethylase JARID1C. Oncogene 2012; 31:776-86; PMID:21725364; http://dx.doi.org/ 10.1038/onc.2011.266 [DOI] [PMC free article] [PubMed] [Google Scholar]
- 22.Shen Y, Guo X, Wang Y, Qiu W, Chang Y, Zhang A, Duan X. Expression and significance of histone H3K27 demethylases in renal cell carcinoma. BMC Cancer 2012; 12:470; PMID:23057811; http://dx.doi.org/ 10.1186/1471-2407-12-470 [DOI] [PMC free article] [PubMed] [Google Scholar]
- 23.Sakurai T, Bilim VN, Ugolkov AV, Yuuki K, Tsukigi M, Motoyama T, Tomita Y. The enhancer of zeste homolog 2 (EZH2), a potential therapeutic target, is regulated by miR-101 in renal cancer cells. Biochem Biophys Res Commun 2012; 422:607-14; PMID:22609199; http://dx.doi.org/ 10.1016/j.bbrc.2012.05.035 [DOI] [PubMed] [Google Scholar]
- 24.Costa VL, Henrique R, Ribeiro FR, Pinto M, Oliveira J, Lobo F, Teixeira MR, Jeronimo C. Quantitative promoter methylation analysis of multiple cancer-related genes in renal cell tumors. BMC Cancer 2007; 7:133; PMID:17645803; http://dx.doi.org/ 10.1186/1471-2407-7-133 [DOI] [PMC free article] [PubMed] [Google Scholar]
- 25.Rohan S, Tu JJ, Kao J, Mukherjee P, Campagne F, Zhou XK, Hyjek E, Alonso MA, Chen YT. Gene expression profiling separates chromophobe renal cell carcinoma from oncocytoma and identifies vesicular transport and cell junction proteins as differentially expressed genes. Clin Cancer Res 2006; 12:6937-45; PMID:17145811; http://dx.doi.org/ 10.1158/1078-0432.CCR-06-1268 [DOI] [PubMed] [Google Scholar]
- 26.Abu-Farha M, Lambert JP, Al-Madhoun AS, Elisma F, Skerjanc IS, Figeys D. The tale of two domains: proteomics and genomics analysis of SMYD2, a new histone methyltransferase. Mol Cell Proteomics 2008; 7:560-72; http://dx.doi.org/ 10.1074/mcp.M700271-MCP200 [DOI] [PubMed] [Google Scholar]
- 27.Abu-Farha M, Lanouette S, Elisma F, Tremblay V, Butson J, Figeys D, Couture JF. Proteomic analyses of the SMYD family interactomes identify HSP90 as a novel target for SMYD2. J Mol Cell Biol 2011; 3:301-8; PMID:22028380; http://dx.doi.org/ 10.1093/jmcb/mjr025 [DOI] [PubMed] [Google Scholar]
- 28.Brown MA, Sims RJ 3rd, Gottlieb PD, Tucker PW. Identification and characterization of Smyd2: a split SET/MYND domain-containing histone H3 lysine 36-specific methyltransferase that interacts with the Sin3 histone deacetylase complex. Mol Cancer 2006; 5:26; PMID:16805913; http://dx.doi.org/ 10.1186/1476-4598-5-26 [DOI] [PMC free article] [PubMed] [Google Scholar]
- 29.Donlin LT, Andresen C, Just S, Rudensky E, Pappas CT, Kruger M, Jacobs EY, Unger A, Zieseniss A, Dobenecker MW, et al.. Smyd2 controls cytoplasmic lysine methylation of Hsp90 and myofilament organization. Genes Dev 2012; 26:114-9; PMID:22241783; http://dx.doi.org/ 10.1101/gad.177758.111 [DOI] [PMC free article] [PubMed] [Google Scholar]
- 30.Hamamoto R, Toyokawa G, Nakakido M, Ueda K, Nakamura Y. SMYD2-dependent HSP90 methylation promotes cancer cell proliferation by regulating the chaperone complex formation. Cancer Lett 2014; 351:126-33; PMID:24880080; http://dx.doi.org/ 10.1016/j.canlet.2014.05.014 [DOI] [PubMed] [Google Scholar]
- 31.Huang J, Perez-Burgos L, Placek BJ, Sengupta R, Richter M, Dorsey JA, Kubicek S, Opravil S, Jenuwein T, Berger SL. Repression of p53 activity by Smyd2-mediated methylation. Nature 2006; 444:629-32; PMID:17108971; http://dx.doi.org/ 10.1038/nature05287 [DOI] [PubMed] [Google Scholar]
- 32.Piao L, Kang D, Suzuki T, Masuda A, Dohmae N, Nakamura Y, Hamamoto R. The histone methyltransferase SMYD2 methylates PARP1 and promotes poly(ADP-ribosyl)ation activity in cancer cells. Neoplasia 2014; 16:257-64, 64 e2; PMID:24726141; http://dx.doi.org/ 10.1016/j.neo.2014.03.002 [DOI] [PMC free article] [PubMed] [Google Scholar]
- 33.Saddic LA, West LE, Aslanian A, Yates JR 3rd, Rubin SM, Gozani O, Sage J. Methylation of the retinoblastoma tumor suppressor by SMYD2. J Biol Chem 2010; 285:37733-40; PMID:20870719; http://dx.doi.org/ 10.1074/jbc.M110.137612 [DOI] [PMC free article] [PubMed] [Google Scholar]
- 34.Wu J, Cheung T, Grande C, Ferguson AD, Zhu X, Theriault K, Code E, Birr C, Keen N, Chen H. Biochemical characterization of human SET and MYND domain-containing protein 2 methyltransferase. Biochemistry 2011; 50:6488-97; PMID:21678921; http://dx.doi.org/ 10.1021/bi200725p [DOI] [PubMed] [Google Scholar]
- 35.Sese B, Barrero MJ, Fabregat MC, Sander V, Izpisua Belmonte JC. SMYD2 is induced during cell differentiation and participates in early development. Int J Dev Biol 2013; 57:357-64; PMID:23873367; http://dx.doi.org/ 10.1387/ijdb.130051ji [DOI] [PubMed] [Google Scholar]
- 36.Cho HS, Hayami S, Toyokawa G, Maejima K, Yamane Y, Suzuki T, Dohmae N, Kogure M, Kang D, Neal DE, et al.. RB1 methylation by SMYD2 enhances cell cycle progression through an increase of RB1 phosphorylation. Neoplasia 2012; 14:476-86; PMID:22787429; http://dx.doi.org/ 10.1593/neo.12656 [DOI] [PMC free article] [PubMed] [Google Scholar]
- 37.Sakamoto LH, Andrade RV, Felipe MS, Motoyama AB, Pittella Silva F. SMYD2 is highly expressed in pediatric acute lymphoblastic leukemia and constitutes a bad prognostic factor. Leuk Res 2014; 38:496-502; PMID:24631370; http://dx.doi.org/ 10.1016/j.leukres.2014.01.013 [DOI] [PubMed] [Google Scholar]
- 38.Komatsu S, Imoto I, Tsuda H, Kozaki KI, Muramatsu T, Shimada Y, Aiko S, Yoshizumi Y, Ichikawa D, Otsuji E, et al.. Overexpression of SMYD2 relates to tumor cell proliferation and malignant outcome of esophageal squamous cell carcinoma. Carcinogenesis 2009; 30:1139-46; PMID:19423649; http://dx.doi.org/ 10.1093/carcin/bgp116 [DOI] [PubMed] [Google Scholar]
- 39.Komatsu S, Ichikawa D, Hirajima S, Nagata H, Nishimura Y, Kawaguchi T, Miyamae M, Okajima W, Ohashi T, Konishi H, et al.. Overexpression of SMYD2 contributes to malignant outcome in gastric cancer. Br J Cancer 2015; 112:357-64; PMID:25321194; http://dx.doi.org/ 10.1038/bjc.2014.543 [DOI] [PMC free article] [PubMed] [Google Scholar]
- 40.Eom GH, Kim KB, Kim JH, Kim JY, Kim JR, Kee HJ, Kim DW, Choe N, Park HJ, Son HJ, et al.. Histone methyltransferase SETD3 regulates muscle differentiation. J Biol Chem 2011; 286:34733-42; PMID:21832073; http://dx.doi.org/ 10.1074/jbc.M110.203307 [DOI] [PMC free article] [PubMed] [Google Scholar]
- 41.Chen Z, Yan CT, Dou Y, Viboolsittiseri SS, Wang JH. The role of a newly identified SET domain-containing protein, SETD3, in oncogenesis. Haematologica 2013; 98:739-43; PMID:23065515; http://dx.doi.org/ 10.3324/haematol.2012.066977 [DOI] [PMC free article] [PubMed] [Google Scholar]
- 42.Eilbracht J, Reichenzeller M, Hergt M, Schnolzer M, Heid H, Stohr M, Franke WW, Schmidt-Zachmann MS. NO66, a highly conserved dual location protein in the nucleolus and in a special type of synchronously replicating chromatin. Mol Biol Cell 2004; 15:1816-32; PMID:14742713; http://dx.doi.org/ 10.1091/mbc.E03-08-0623 [DOI] [PMC free article] [PubMed] [Google Scholar]
- 43.Sinha KM, Yasuda H, Coombes MM, Dent SY, de Crombrugghe B. Regulation of the osteoblast-specific transcription factor Osterix by NO66, a Jumonji family histone demethylase. EMBO J 2010; 29:68-79; PMID:19927124; http://dx.doi.org/ 10.1038/emboj.2009.332 [DOI] [PMC free article] [PubMed] [Google Scholar]
- 44.Sinha KM, Yasuda H, Zhou X, deCrombrugghe B. Osterix and NO66 histone demethylase control the chromatin of Osterix target genes during osteoblast differentiation. J Bone Miner Res 2014; 29:855-65; PMID:24115157; http://dx.doi.org/ 10.1002/jbmr.2103 [DOI] [PMC free article] [PubMed] [Google Scholar]
- 45.Bodmer D, van den Hurk W, van Groningen JJ, Eleveld MJ, Martens GJ, Weterman MA, van Kessel AG. Understanding familial and non-familial renal cell cancer. Hum Mol Genet 2002; 11:2489-98; PMID:12351585; http://dx.doi.org/ 10.1093/hmg/11.20.2489 [DOI] [PubMed] [Google Scholar]
- 46.Forbes SA, Beare D, Gunasekaran P, Leung K, Bindal N, Boutselakis H, Ding M, Bamford S, Cole C, Ward S, et al.. COSMIC: exploring the world's knowledge of somatic mutations in human cancer. Nucleic Acids Res 2015; 43:D805-11; PMID:25355519; http://dx.doi.org/ 10.1093/nar/gku1075 [DOI] [PMC free article] [PubMed] [Google Scholar]
- 47.Sanjmyatav J, Rubtsov N, Starke H, Schubert J, Hindermann W, Junker K. Identification of tumor entities of renal cell carcinoma using interphase fluorescence in situ hybridization. J Urol 2005; 174:731-5; PMID:16006966; http://dx.doi.org/ 10.1097/01.ju.0000166749.38455.bc [DOI] [PubMed] [Google Scholar]
- 48.Brunelli M, Delahunt B, Gobbo S, Tardanico R, Eccher A, Bersani S, Cossu-Rocca P, Parolini C, Balzarini P, Menestrina F, et al.. Diagnostic usefulness of fluorescent cytogenetics in differentiating chromophobe renal cell carcinoma from renal oncocytoma: a validation study combining metaphase and interphase analyses. Am J Clin Pathol 2010; 133:116-26; PMID:20023267; http://dx.doi.org/ 10.1309/AJCPSATJTKBI6J4N [DOI] [PubMed] [Google Scholar]
- 49.Dvorakova M, Dhir R, Bastacky SI, Cieply KM, Acquafondata MB, Sherer CR, Mercuri TL, Parwani AV. Renal oncocytoma: a comparative clinicopathologic study and fluorescent in-situ hybridization analysis of 73 cases with long-term follow-up. Diagn Pathol 2010; 5:32; PMID:20497539; http://dx.doi.org/ 10.1186/1746-1596-5-32 [DOI] [PMC free article] [PubMed] [Google Scholar]
- 50.Barocas DA, Rohan SM, Kao J, Gurevich RD, Del Pizzo JJ, Vaughan ED Jr., Akhtar M, Chen YT, Scherr DS. Diagnosis of renal tumors on needle biopsy specimens by histological and molecular analysis. J Urol 2006; 176:1957-62; PMID:17070218; http://dx.doi.org/ 10.1016/j.juro.2006.07.038 [DOI] [PubMed] [Google Scholar]
- 51.Vieira J, Henrique R, Ribeiro FR, Barros-Silva JD, Peixoto A, Santos C, Pinheiro M, Costa VL, Soares MJ, Oliveira J, et al.. Feasibility of differential diagnosis of kidney tumors by comparative genomic hybridization of fine needle aspiration biopsies. Genes Chromosomes Cancer 2010; 49:935-47; http://dx.doi.org/ 10.1002/gcc.20805 [DOI] [PubMed] [Google Scholar]
- 52.Goncalves C. The Cancer Genome Atlas (TCGA), http://cancergenome.nih.gov, accessed 2015. [Google Scholar]
Associated Data
This section collects any data citations, data availability statements, or supplementary materials included in this article.