

Abstract
Age estimation from DNA methylation markers has seen an exponential growth of interest, not in the least from forensic scientists. The current published assays, however, can still be improved by lowering the number of markers in the assay and by providing more accurate models to predict chronological age. From the published literature we selected 4 age-associated genes (ASPA, PDE4C, ELOVL2, and EDARADD) and determined CpG methylation levels from 206 blood samples of both deceased and living individuals (age range: 0–91 years). This data was subsequently used to compare prediction accuracy with both linear and non-linear regression models. A quadratic regression model in which the methylation levels of ELOVL2 were squared showed the highest accuracy with a Mean Absolute Deviation (MAD) between chronological age and predicted age of 3.75 years and an adjusted R2 of 0.95. No difference in accuracy was observed for samples obtained either from living and deceased individuals or between the 2 genders. In addition, 29 teeth from different individuals (age range: 19–70 years) were analyzed using the same set of markers resulting in a MAD of 4.86 years and an adjusted R2 of 0.74. Cross validation of the results obtained from blood samples demonstrated the robustness and reproducibility of the assay. In conclusion, the set of 4 CpG DNA methylation markers is capable of producing highly accurate age predictions for blood samples from deceased and living individuals
Keywords: CpG marker, DNA-based age prediction, DNA methylation, quadratic regression modeling
Introduction
Age estimation is very important in the forensic field for the identification of human remains; to this end, various methods with different accuracy are available. Some of the methods routinely used are based on dental morphology and bone elongation/epiphyseal ossification, but chemical methods involving aspartic acid racemization, lead accumulation, collagen crosslinks, chemical composition of teeth, and glycosylation of proteins have also been promising as potential novel age estimation methods.1 On the molecular biology front, telomere shortening, mitochondrial mutations, and single joint T-cell receptor excision circle rearrangements were initially greeted with enthusiasm, but the low accuracy of these assays has quickly diminished hope for these methods to become routinely implemented in forensic investigations.
It has been long known that the aging process leads to modifications in tissues and organs on a molecular level but only recently has it been associated with changes in DNA methylation patterns. Studies involving identical twins show that epigenetic drift is associated with aging, with global DNA methylation levels decreasing during aging,2 even though specific local CpG sites can either become hypo- or hyper-methylated with aging.3 CpG sites that become hypermethylated with aging are primarily located in CpG islands, unlike the hypomethylated CpGs, which are usually located outside of CpG islands.4 In addition, aberrant DNA methylation patterns have been linked to several age-related diseases, including Type II diabetes mellitus,5 Alzheimer's disease,6 cancer,6 and diseases characterized by premature aging, such as Werner syndrome and Hutchinson-Gilford progeria.7
Over the past few years, multiple research groups have used the Illumina BeadArray technology to identify numerous CpG sites that are significantly correlated with age, some of which have been used to infer age with linear models using a selected set of DNA methylation markers in single or multiple tissues. These studies have shown that DNA methylation patterns of close to a third of all CpG dinucleotides in the human genome are influenced by age,4 and that age-associated hypermethylation at CpG islands preferentially targets genes that are not expressed in blood tissue, whereas age-associated hypomethylation correspondingly targets more highly expressed genes.8 Bocklandt et al. identified 88 sites in saliva samples from adults of which the EDARADD gene showed a linear correlation with age over a 5-decade period. When using only 2 CpGs (in genes EDARADD and NPTX2), 73% of the variance between predicted and chronological age was explained with an accuracy of 5.2 years.9 At the same time, an epigenetic-aging-signature was constructed to determine age in different tissues using only 19 CpG sites, including PDE4C, with an absolute average difference between predicted and chronological age of ±11 years. Garagnani and colleagues showed for the first time the ELOVL2 was significantly associated with age (R2 = 0.92) using a large dataset of 501 individuals between 9–99 years of age. A study based on a strict pediatric population (age range: 3–17 years, n = 398, boys) showed that ITGA2B and EDARADD were among the top 10 ranked genes of the 2078 pediatric age-associated loci in blood.10 Using Illumina BeadArray metadata from previous publications Steve Horvath designed a panel of 353 CpG sites as a multi-tissue predictor of age.11 A study by Hannum and colleagues showed that with 71 markers, the prediction error could be lowered to 3.9 years in adult blood samples.12 Zbieć-Piekarska and colleagues investigated methylation in the ELOVL2 gene and obtained a correlation of R2 = 0.859 between predicted and chronological age and a Mean Absolute Deviation (MAD) of 5.03 years.13 Weidner et al. used a multivariate linear model to predict age based on 102 CpGs including a CpG located in EDARADD.14 In this study, predicted age correlated well with chronological age in blood with a MAD of only 3.34 years. Furthermore, applying an adjusted version of this model, containing 99 of the 102 CpG sites, to a data set published by Hannum and his team12 yielded a MAD of 4.12 years. An age prediction model by the same researchers.14 with only the 3 most age-associated CpGs of ASPA, ITG2B, and EDARADD resulted in an accurate age prediction with a MAD of 5.4 years. More recently, ELOVL2 was again highlighted as the top gene of high-confidence aging-associated CpG sites in blood when comparing nonagenarians with young healthy controls,15 and both ELOVL2 and EDARADD were included in a shortlist of 44 regions most significantly associated with age in a meta-analysis.16 Differentiating themselves from other researchers, Florath and her team employed a longitudinal study design to examine the relationship between DNA methylation and aging by collecting blood samples from 67 individuals at baseline and 8 years later.3 Analysis of 94 CpG sites that were initially shown to be significantly correlated with age in a previous confirmatory analysis in an independent sample of 498 participants, revealed a significant change in methylation level within these 8 years of life for 78 of these CpG sites. Similar results were observed when comparing CpG methylation in adults and newborns. Seventeen of these CpGs were included in a multivariate regression model accounting for 71% of the variance in age with an average absolute difference between predicted and chronological age of 2.6 years. In addition, a meta-analysis on the association between DNA methylation and age in blood resulted in 44 genes whose methylation levels were highly correlated with age.16 Among these genes were ELOVL2 and EDARADD. Recently, 2 other papers were published: GRIA2 and NPTX2 were suggested as potential markers for age prediction in blood and saliva samples, though accuracy was fairly low with an average difference of 6.9 and 9.2 years, respectively.17 The group of Zbieć-Piekarska published a second assay where they included several other CpG markers next to ELOVL2. In this assay ELOVL2, C1orf132, TRIM59, KLF14, and FHL2 produced age predictions with a MAD of 3.9 years.18
Most of the CpG markers used in the age-association studies described above show linear correlations with chronological age; however, when examining the methylation data from the ELOVL2 marker in more detail (e.g., in13), it is apparent that the curve of this marker is rather non-linearly correlated with age and might be better modeled using a quadratic model, thereby improving the age-prediction accuracy of the model.
In the current study, we aimed to (i) increase the accuracy of age estimations of blood samples based on DNA methylation markers by comparing linear and non-linear regression models; (ii) assess the prediction accuracy in different age groups and; (iii) test the selected CpGs in a limited set of dentin samples extracted from third molars.
Results
Methylation measurements by pyrosequencing are reproducible
To assess the reproducibility of the pyrosequencing assays, 2 separate bisulfite-conversions, PCR amplifications and pyrosequencing analyses of 7 DNA samples for all 5 genes (ASPA, PDE4C, ITGA2B, EDARADD, and ELOVL2) were performed. Methylation values of both conversions were not significantly different (P > 0.05) between the samples for each gene, demonstrating that the assays are highly reproducible. The mean difference in DNA methylation between conversions for all genes was 1.7% (±1.0), 2.4% (±1.8), 6.6% (±7.7), 4.2% (±3.6), and 3.5% (±2.8) for ASPA, PDE4C, ITGA2B, EDARADD, and ELOVL2, respectively.
Methylation of ITGA2B is not correlated with age in blood in an exploratory study
Correlation between CpG methylation of all 5 genes (ASPA, ITGA2B, PDE4C, ELOVL2, and EDARADD) and age was first assessed for 36 of the 206 blood samples in an exploratory phase. Simple linear regression revealed strong correlations (R2 > 0.3) between CpG methylation and age for at least one CpG for each gene, except for ITGA2B (Table S2). The CpGs located in ITGA2B displayed only a weak correlation between methylation level and age (R2 < 0.3). ITGA2B was therefore excluded from further analysis. Age-associated methylation was subsequently further assessed in the remaining 170 blood samples for CpGs located in ASPA, PDE4C, ELOVL2, and EDARAD.
Accurate age prediction with CpGs located in ASPA, PDE4C, ELOVL2, and EDARADD
Methylation of CpG sites in ASPA and EDARADD was negatively correlated with age, whereas positive correlations were found between methylation and age for PDE4C and ELOVL2 (Fig. 2). From this data, the CpGs most highly associated with age were selected for further statistical analysis: CpG1 ASPA (R2 = 0.65), CpG1 PDE4C (R2 = 0.85), and CpG1 EDARADD (R2 = 0.62). Several CpGs from ELOVL2 were strongly associated with age (Table S2 and Fig. S1). Because DNA methylation values in ELOVL2 did not show a straight linear relationship, we compared linear, logarithmic, and quadratic regressions. This showed that the quadratic regression was a better fit for the relationship between age and DNA methylation values of ELOVL2 (Quadratic R2 = 0.95; Linear R2 = 0.88; Logarithmic R2 = 0.86). When restricting the dataset to DNA methylation values from ELOVL2 in the multiple quadratic regression, only CpGs1, 6 and 9 were significantly correlated (P < 0.05) contributing to the model, with CpG6 being, by far, the most informative CpG for age estimation (Table 3). CpG6 ELOVL2 was therefore selected to be included in the final regression model.
Figure 2.
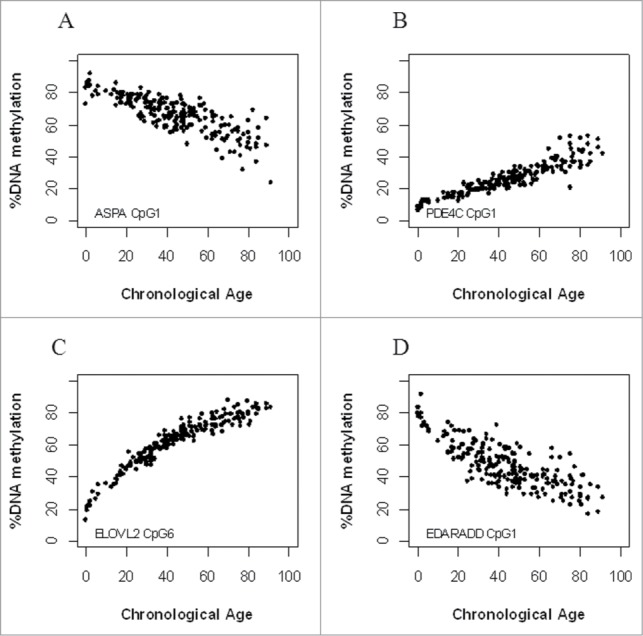
CpG markers ASPA (A), PDE4C (B), ELOVL2 (C), and EDARADD (D) are significantly correlated with age.
Table 3.
Regression statistics for ELOVL2
| CpG | P-value |
|---|---|
| CpG1 ELOVL2 | 0.034808 |
| CpG2 ELOVL2 | 0.161531 |
| CpG3 ELOVL2 | 0.121995 |
| CpG4 ELOVL2 | 0.156382 |
| CpG5 ELOVL2 | 0.41381 |
| CpG6 ELOVL2 | 1.04E-11 |
| CpG7 ELOVL2 | 0.183272 |
| CpG8 ELOVL2 | 0.255735 |
| CpG9 ELOVL2 | 0.000683 |
The methylation values of all 206 samples of the 4 CpGs from all 4 genes were put in a multivariate quadratic regression model to obtain a formula to predict age: Y = 26.44 − 0.20 X1 + 0.63 X2 + 0.01 X32 − 0.24 X4; where X1 = methylation level of CpG1 ASPA, X2 = methylation level of CpG1 PDE4C, X32 = squared methylation level of CpG6 ELOVL2, and X4 = methylation level of CpG1 EDARADD. Results of the age predictions are shown in Figure 3. Predicted and chronological ages were highly correlated (Pearson correlation r=0.97) with MAD of 3.75 years between predicted and chronological ages (median absolute deviation = 3.06 years). The overall prediction model was highly significant (F-test P-value: 1.27e−129) and explained 95% of the variation in age (Table 4). Finally, we compared the MAD values for samples obtained from living and deceased individuals. The difference between the MAD of ages predicted for samples obtained from living individuals and the MAD of ages predicted for samples obtained from deceased individuals was not significant (t-test, P > 0.05)
Figure 3.
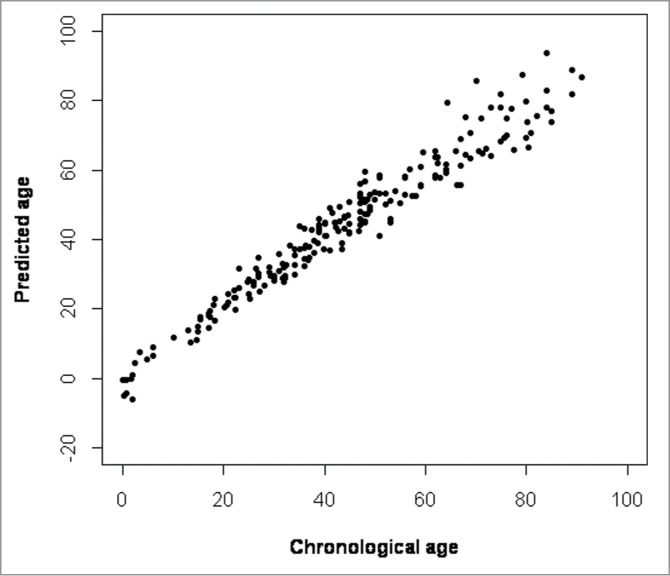
Predicted vs. chronological age. Four CpGs (ASPA CpG1, PDEC4C CpG1, ELOVL2 CpG6, and EDARADD CpG1) were selected for a multivariate quadratic regression model to predict age. A strong correlation was found between predicted and chronological age (r = 0.96) with a mean absolute deviation of 3.75 years. The overall prediction model was highly significant (F-test P-value: 1.27e−129).
Table 4.
Regression statistics of the age prediction model with the 4 best age predictors: APSA, PDE4C, ELOVL2 and EDARADD
| CpG | P-value | R square |
|---|---|---|
| CpG1 ASPA | 1.4071E-07 | |
| CpG1 PDE4C | 6.0245E-05 | |
| CpG6 ELOVL2 | 1.2628E-11 | |
| CpG1 EDARADD | 7.4543E-25 | |
| Prediction model | 1.272E-129 | 0.95 |
Methylation values of ELOVL2 were squared in the model.
Differences between predicted and chronological age increase with age in blood
When we plotted the differences between chronological age vs. predicted age we could see that the model was less accurate with increasing age (Fig. 4). Because of the larger differences in the older age groups we divided the population into 4 age categories (0–19, 20–39, 40–59, and ≥60) and calculated the MAD between predicted and chronological age for each age group separately (Fig. 5), revealing a clear positive correlation between age and model accuracy. The MAD between predicted and chronological age was the largest for people ≥60 years old (MAD = 5.28 years) and smallest for individuals <20 years old (MAD = 2.32 years) .
Figure 4.
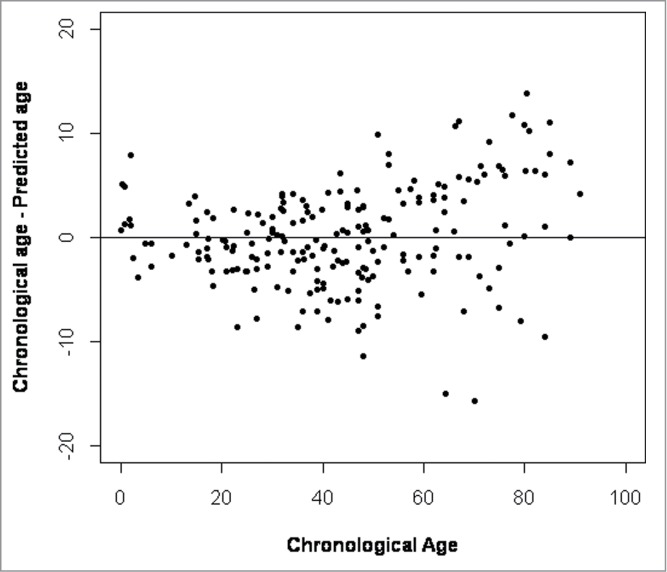
Differences between chronological age and predicted age plotted against chronological age.
Figure 5.
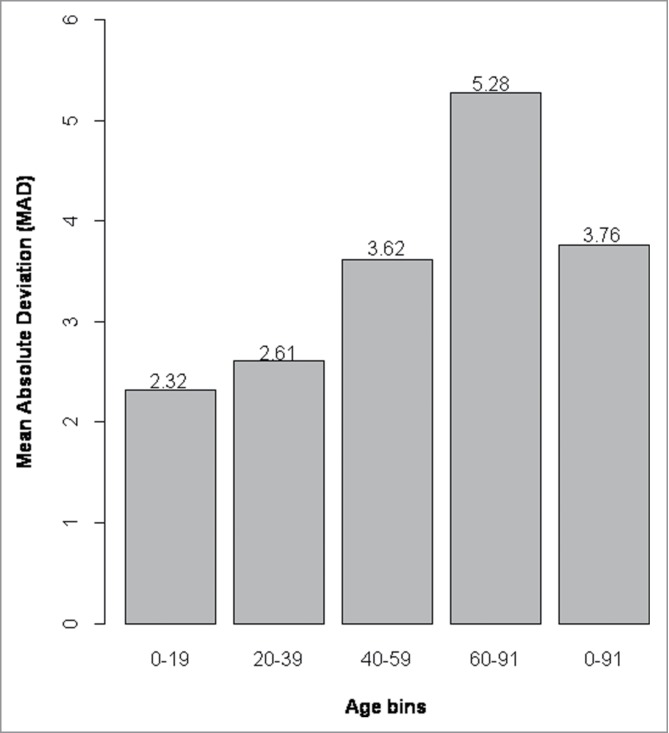
Mean absolute deviation between predicted and chronological age for each age group. The mean absolute deviation (MAD) increases from age group 0–19 to age group 60–91, with the largest MAD observed for the age group 60–91 years. Age groups 60–79 and 80–91 were grouped together because of the lower number of samples (n = 10) in the top bin. The MAD is printed on top of each respective age bin.
We evaluated the prediction potential of our CpG marker set by considering a prediction result as correct when the predicted age matched the chronological age ±5 years as in.18 As expected, the number of incorrect calls increased with increasing age (Table 5). These results showed a significant improvement in the 2 youngest age categories of 13% and 8%, respectively, when compared to the results produced by Zbieć-Piekarska and colleagues. Overall, 79.6% of all 206 samples were predicted to be correct within ±5 years.
Table 5.
Number and percentage of correct and incorrect age predictions
| Age |
|||||
|---|---|---|---|---|---|
| 0–19 | 20–39 | 40–59 | 60–91 | Total | |
| Total incorrect | 1 (3.6%) | 4 (6.6%) | 14 (21.9%) | 23 (45.1%) | 42 (20.4%) |
| Total correct | 27 (96.4%) | 57 (93.4%) | 50 (78.1) | 28 (54.9%) | 164 (79.6%) |
| Total | 28 | 61 | 64 | 51 | 206 |
Correct prediction was assumed when predicted and chronological age matched ±5 years.
Validation of the age-prediction model
In order to validate the prediction model k-fold cross validation was performed during which a number of samples (a ‘fold’) is randomly removed from the data set as a validation set. The multiple quadratic regression model is then fit on the remaining samples (training set). Subsequently, this prediction model is used to predict the age of the removed samples. The cross validation with 10 folds produced a mean prediction error of 4.89 years (Residual sums of square = 23.91; Fig. S2). The relative importance of each predictor (each selected CpG) was calculated using the relaimpo package in R (Fig. S3). The diagnostic plots show that CpG6 from ELOVL2 and CpG1 from EDARADD explain most of the variance in each of the methods. Furthermore, a leave-one-out cross validation (LOOCV) was performed in which the prediction model was fit on all but one subject and the age of the left-out subject is then predicted with this model. A complete LOOCV, meaning that the procedure was repeated for 206 times so that each subject served as validation set, resulted in a prediction error of 4.96 years. Cross validation of the model's R2 with package bootstrap provided an R2 of 0.9469, which is only slightly lower than the raw value (R2 = 0.9501). As a final validation, we split the dataset into 2 equal sets of 103 samples each (training and test set) and re-fitted the multivariate quadratic regression model on the training set. This allowed us to obtain an independent MAD value for the training set of 3.88 years. When this model was applied to the test set we obtained a MAD of 3.99 years. Both independent MAD values were very close to the MAD of 3.75 obtained from the whole data set.
Age-associated methylation in blood is not related to sex
Because gender-related DNA methylation has been previously reported,19 we investigated the relationship between sex- and age-associated methylation. No significant differences in either absolute methylation levels or the correlation between methylation and age were observed for any of the selected CpGs between men and women (Fig. S4). In addition, the MAD between predicted and chronological age was not significantly different (t-test P-value = 0.8) between males (MAD = 3.53 years, r = 0.98) and females (MAD = 3.95 years, r = 0.97).
Age-associated CpG methylation in dentin
In a second phase, the CpGs that were shown to be highly correlated with age in blood were also analyzed for dentin samples extracted from teeth from 29 different individuals. A multivariate quadratic regression model was selected from all CpGs present in the pyrosequencing assays of ASPA, PDE4C, ELOVL2, and EDARADD by using the step function in R, which selects the model that explains most of the observed variance: Y = 3.94379 − 2.06161 X1 + 0.04859 X22 − 0.08086 X32 + 0.04396 X42 + 0.04276 X52 − 0.02485 X62 + 0.4197 X72; where X1 is the methylation level of CpG4 PDE4C, X22 is the squared methylation level of CpG2 ELOVL2, X32 is the squared methylation level of CpG6 ELOVL2, X42 is the squared methylation level of CpG7 ELOVL2, X52 is the squared methylation level of CpG8 ELOVL2, X62 is the squared methylation level of CpG9 ELOVL2, and X7 is the methylation level of CpG2 EDARADD. This model predicted age with an adjusted R2 of 0.74 and a MAD of 4.86 years (F-test P-value < 0.001; Fig. 6) .
Figure 6.
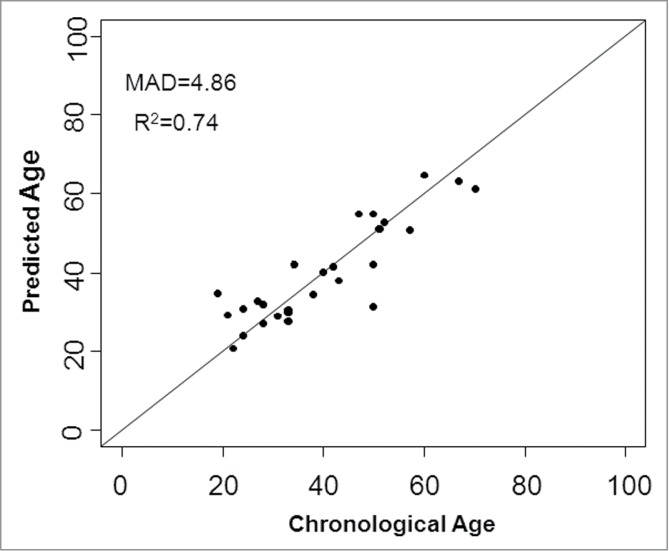
Chronological age versus predicted age for 29 dentin samples with an MAD of 4.86 years.
Discussion
In this study, we assessed age-associated methylation for 19 CpGs located in 5 genes: ASPA, ITGA2B, PDE4C, EDARADD, and ELOVL2 (Table 2). CpG1 ASPA, CpG1 PDE4C, CpG6 ELOVL2, and CpG1 EDARADD were shown to be the CpGs most highly associated with chronological age in our study and were therefore put in a model to predict the age of 206 blood samples derived from both living and deceased individuals. The resulting multivariate quadratic regression model was able to predict donor age with a mean error of 3.75 years.
Table 2.
CpGs selected for age-associated methylation analysis
| Gene ID | CpG number | CpG ID | Position |
|---|---|---|---|
| ASPA | CpG1 | cg02228185 | chr17: 3,379,567 |
| ITGA2B | CpG1 | — | chr17:42,467,742 |
| CpG2 | cg25809905 | chr17:42,467,728 | |
| CpG3 | — | chr17:42,467,726 | |
| PDE4C | CpG1 | — | chr19:18,343,888 |
| CpG2 | cg17861230 | chr19:18,343,902 | |
| CpG3 | — | chr19:18,343,911 | |
| CpG4 | — | chr19:18,343,914 | |
| EDARADD | CpG1 | cg09809672 | chr1:236,557,683 |
| CpG2 | — | chr1:236,557,695 | |
| ELOVL2 | CpG1 | cg21572722 | chr6:11,044,661 |
| CpG2 | cg24724428 | chr6:11,044,655 | |
| CpG3 | — | chr6:11,044,647 | |
| CpG4 | cg16867657 | chr6:11,044,644 | |
| CpG5 | — | chr6:11,044,642 | |
| CpG6 | — | chr6:11,044,640 | |
| CpG7 | — | chr6:11,044,634 | |
| CpG8 | — | chr6:11,044,628 | |
| CpG9 | — | chr6:11,044,625 |
The CpGs numbers are used in the paper for easy-reading.
Selection of CpG sites
We based the selection of genes used in our model on shortlists published by other research groups. A summary of the studies used for the selection can be found in Table S3. CpG sites were selected based on their overall rankings in multiple studies and their absolute difference in methylation between young and old individuals. The latter parameter is important, as biological variability needs to be greater than the technical variability of pyrosequencing. To this end, we determined the technical variability of the pyrosequencing assays. The small differences in DNA methylation values between duplicates proved the reproducibility of the assays.
There is considerable variation in the rankings of age-associated CpGs produced by different studies. An overview of the ranking positions of the CpGs in different publications is given in Table S1. For instance, CpG2 ITGA2B was ranked first by Alisch et al.10 and tenth by Weidner et al,14 but were not even in the top 30 of other studies.4,20 CpG2 PDE4C (not included in our model) was ranked in the top 10 or top 20 of several publications,9,14,20,21 but did not reach the top 60 of others.4,22,23 The same is true for CpG1 ASPA.4,9,10,14,20,22 and CpG1 EDARADD.3,4,9,10,12,14,20,22 In contrast, CpGs located in ELOVL2 were ranked in the top 10 or 20 of all the publications reporting an age-associated methylation pattern for this gene.3,4,12,24,25 The reason why not all studies share the same ranking lists is most probably due to differences in population age ranges, methods, and statistical techniques. This demonstrates that the selection of CpGs to build a prediction model is a complex task. In addition, it is important to choose CpG sites that show a high degree of absolute methylation differences. Larger differences are easier to be picked up in the pyrosequencing assay and will result in an increased accuracy of the prediction model.
Comparing different age prediction models
The prediction model presented in the current study consists of 4 CpGs located in 4 genes. The overall prediction model explains 95% of the variation in age and is highly significant (F-test P-value: 1.27e−129; Table 4). In contrast to previously published results, we did not observe a significant correlation between ITGA2B DNA methylation and chronological age.14 ITGA2B was therefore not further analyzed and left out of the final age prediction model. The correlation between DNA methylation and age for CpGs located in ELOVL2 has previously been reported by several research groups. ELOVL2 encodes for an enzyme that plays a role in the synthesis of very long chain polyunsaturated fatty acids (PUFAs).24 Considering that PUFAs are involved in crucial biological processes, such as energy production, inflammation, and maintenance of membrane integrity, it is possible that methylation of ELOVL2 is causally linked to the aging process. PUFAs also play a role in the photoaging response of the human skin.12 Zbieć-Piekarska et al. developed a prediction model with CpG5 ELOVL2 and CpG7 ELOVL2, explaining 86% of the variation in age in blood samples and with a MAD from chronological age of 5.03 years.13 ELOVL2 was also included in the prediction model of Hannum and co-workers.12 However, they included CpG4 ELOVL2 in their prediction model. This prediction model with a root mean square error (RMSE) of 3.9 years included 70 other CpG sites. This is more accurate than the RMSE generated by our prediction model, which was 4.8 years; this is most likely due to the fact that 71 CpGs were used for their model compared to the 4 CpGs in the current study. In addition, the prediction model by Hannum et al. included CpG1 EDARADD, which was also included in our model. EDARADD codes for a death domain adaptor that interacts with the death domain of EDAR, a receptor that is required for the development of hair and teeth.26 Through its interaction with EDAR, EDARADD links the receptor to downstream signaling pathways. CpG1 of EDARADD was previously also recognized in a number of other studies as an age-associated DNA methylation marker.9,14 Weidner et al. used a multivariate linear model to predict age based on 102 CpGs including CpG1 EDARADD. Predicted age correlated well with chronological age (R2 = 0.98) in blood with a MAD of only 3.34 years and a RMSE of 4.26 years. Furthermore, applying an adjusted version of this model, containing 99 of the 102 CpG sites to a dataset published by Hannum and his team,12 yielded a MAD of 4.12 years (RMSE = 5.34, R2 = 0.87). An age prediction model by the same researchers 14 with only the 3 most age-associated CpGs being CpG1 ASPA, CpG2 ITGA2B, and CpG1 EDARADD resulted in a less accurate age prediction with a MAD of 5.4 years and a RMSE of 7.2 years.
The recently published assay by Zbieć-Piekarska is a significant improvement of the existing assays. It analyses 5 CpGs in 5 genes with a MAD of 3.9 years. Though our assay performs only marginally better (MAD of 3.75 years) it only consists of 4 CpG markers in 4 genes and has a lower age prediction error in the younger age categories due to its quadratic regression model in which the non-linear curve of ELOVL2 is taken into account.
Validation of the age prediction model
The age prediction model was validated by comparing the cross-validation residual sums of squares, which is a corrected means of prediction error averaged across all 10 folds. In addition, we performed a LOOCV analysis and bootstrapping to correct for over-fitting the data. Finally we split the data set into a training and test set of equal sample numbers. Fitting the model of the training set on the data of the test set showed highly similar MAD values. The data from these cross validations demonstrate that the model is very robust and reproducible.
Chronological age versus biological age
DNA methylation changes accumulate rapidly until adulthood after which it slows to a constant tick rate 23. This is in accordance with the results from our study where we observed an increase in MAD between predicted and chronological age from younger to older individuals (Table 5, Fig. 3). The smaller DNA methylation differences of currently used aging-marking in older individuals might therefore not have sufficient discrimination capacity for people older than 60, resulting in less accurate predictions. New markers should therefore be investigated, especially for the older age groups.
Age-associated methylation in men and women
Some researchers have reported that age-associated methylation might be different between sexes.9,12,13,25,27-29 though others have not.21 In the current study, however, we did not find significant differences in methylation levels between men and women for any CpG marker (Fig. S4). With these results, we can conclude that gender does not play a significant role in the age-associated methylation observed in our study.
The use of non-linear models to express the relationship between CpG methylation and age
Alisch et al. investigated the relationship between DNA methylation and age in pediatric populations (age range: 3–17 years) and observed that age-related DNA methylation changes do not occur at a constant rate during life.10 Therefore, they used a logarithmic model to assess the relationship between DNA methylation and age and found that this model fit the data better than a linear model. Bocklandt and colleagues also applied a quadratic model instead of a linear model to their data.9 This suggests that linear models are not always a good fit to predict age and that non-linear models can sometimes increase the accuracy of the prediction. In the current study we compared results from 3 different regression methods (linear, logarithmic, and quadratic) for ELOVL2, as we noticed that the relationship between DNA methylation of ELOVL2 and age was not a straight line but rather increased exponentially during childhood, while flattening out during later life. This type of data is better modeled through a quadratic than a linear relationship. This quadratic model was superior in predicting age for our sample set and performed equally well on samples obtained from living individuals and deceased individuals.
Age-associated methylation in teeth
Age-associated methylation was also assessed in dentin extracted from teeth. The MAD obtained using the current model is still fairly large (±4.86) compared to the blood prediction model (±3.75) and, more importantly, is based on a very limited dataset (29 samples), though it shows the potential of the technique. To our knowledge, we are the first to explore age-associated methylation in teeth and because of its highly resistant properties against environmental changes and therefore usefulness in the forensic field, it would be interesting to further explore this new technique. New markers can be identified through whole genome CpG studies identical to the ones that identified the age-associated DNA CpGs in blood, as mentioned in the introduction of this paper. Other matrices that might be forensically relevant are sperm, saliva, bones, and hair, among others.
Conclusion
We have developed a highly accurate age-prediction quadratic regression model for blood samples from living and deceased individuals using a limited set of 4 CpG DNA methylation markers. The model is not biased toward gender, though a decrease in accuracy was observed with increasing age. We have cross-validated the model and have shown that it is robust and reproducible. Additionally, we have demonstrated that age-estimation using CpG methylation ratios can also be used for dentin samples, though more research is needed for this matrix to decrease the current prediction error.
Materials and Methods
Sample collection and DNA extraction
This study was approved by the Ethics Committee of the University Hospitals Leuven in Belgium (case number S56775) and by the district prosecutor of Leuven. Blood from 169 deceased and 37 living individuals (age range: 0–91 years; mean age: 44 years) was collected in EDTA-tubes (Fig. 1 and Table 1) and frozen at −20°C until DNA extraction. Genomic DNA was extracted from 200 µl or 300 µl whole blood with QIAamp DNA Mini Kit (#51304, Qiagen) or Maxwell® 16 LEV Blood DNA Kit (#AS1290, Promega), respectively. Additionally, 29 healthy erupted third molars were collected from patients in dentals clinic in Spain (age range: 19 to 70 years; mean age: 39 years; Table 1). First, the teeth were washed with a soft toothbrush under running distilled water. Afterwards, the teeth were irradiated with ultraviolet light (254 nm) for 15 min at each side to eliminate exogenous DNA. Dentin was isolated from the teeth as described in.30 All DNA extracts were quantified in duplicate with the Quantifiler Human DNA Quantification Kit (#4343895, Applied Biosystems) using the Applied Biosystems® 7500 Real Time PCR System software.
Figure 1.
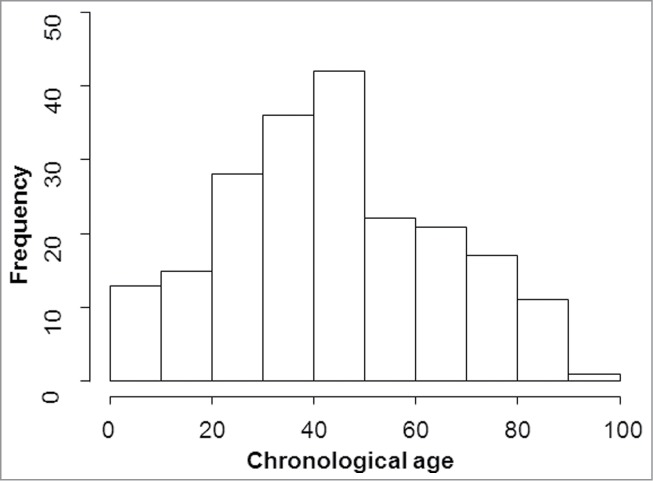
Age distribution of the blood samples. Age ranged from 0 to 91 years with a mean age of 44 years.
Table 1.
Details of blood and teeth sample characteristics
| Sample size |
||||
|---|---|---|---|---|
| Age range (years) | Mean age (years) | Men | Women | |
| Blood | 0–91 | 44 | 105 | 101 |
| Teeth | 19–70 | 39 | 12 | 17 |
Bisulfite conversion and PCR
Genomic DNA (200 ng) was bisulfite converted using the EpiTect Fast Bisulfite Conversion Kit (#59826, Qiagen) or the Methylamp DNA Modification Kit (#P-1001-2, Epigentek). Converted DNA was eluted with 20 µl of elution buffer. Subsequently, 2 µl of converted DNA was amplified by singleplex PCR in a total volume of 25 µl containing 0.8 µM of primers for ASPA, ITGA2B, EDARADD, and ELOVL2 or 0.4 µM of primers for PDE4C and 2x Qiagen Multiplex PCR Master Mix (#206143, Qiagen). Primers for EDARADD and ELOVL2 were designed according to the human GRCh37/hg19 assembly. Primer sequences for ASPA, ITGA2B, and PDE4C were taken from the original paper.14 All primer sequences are listed in table S1. PCR reactions consisted of an initial hold at 95°C for 15 min followed by 40 cycles of 30 s at 95°C, 30 s at 56°C, and 30 s at 72°C for ASPA, ITGA2B, and EDARADD; 50 cycles of 35 s at 95°C, 35 s at 52.9°C, and 35 s at 72°C for PDE4C and 40 cycles of 30 s at 95°C, 30 s at 60°C, and 30 s at 72°C for ELOVL2. PCR amplification ended with a final extension step at 72°C for 6 min.
Pyrosequencing
An overview of the CpGs queried in this study can be found in Table 2. Because not every CpG has a unique identifier (i.e., a cg number) we numbered the CpGs chronologically for each amplicon to ease the interpretation of the results. In order to assess CpG methylation levels, 10 µl (ELOVL2) or 20 µl (ASPA, ITGA2B, PDE4C, and EDARADD) of biotinylated PCR product was immobilized to Streptavidin Sepharose High Performance beads (#17-5113-01, GE Healthcare) followed by annealing to 25 µl of 0.3 µM sequencing primer (Table S1) at 80°C for 2 min with a subsequent 10 min cooling down period. Pyrosequencing was performed using Pyro Gold reagents (#970802, Qiagen) on the PyroMark Q24 instrument (Qiagen) following the manufacturer's instructions.
Reproducibility testing
Reproducibility of the pyrosequencing method was assessed by comparing DNA methylation values of 7 DNA samples extracted from blood after performing 2 separate bisulfite-conversions, PCR amplifications for ASPA, ITGA2B and PDE4C, and pyrosequencing.
Study set-up, age prediction, and statistics
Pyrosequencing results were analyzed using the PyroMark analysis 2.4.0 software (Qiagen). Initially, age-associated methylation was first assessed for 36 of the 206 blood samples in an exploratory phase to exclude CpGs with a low correlation between methylation level and age. Simple linear regression analyses were performed between chronological age and methylation levels of ASPA, ITGA2B, PDE4C, ELOVL2, and EDARADD. CpGs with R2 < 0.3 were excluded and not further analyzed in the remaining 170 blood samples. Finally, the CpGs with the highest R2 were selected for analysis using a multivariate linear regression model to predict age (Microsoft Excel 2010). CpGs that were found to be age-associated in blood were subsequently analyzed in teeth samples as well.
Validation of the age prediction model was performed by k-fold cross validation, whereby a random set of samples is removed from the data set and assigned as a validation set while the rest of the dataset is used as training set. In addition, a leave-one-out cross validation (LOOCV) was performed, in which one observation is left out and used as validation set and the remaining samples as training set. This was repeated 206 times so that a complete LOOCV was performed. The R2 was cross-validated using a bootstrap method and compared to the raw R2. Finally, the complete data set was split into 2 sets (training and test set). An independent regression was calculated for the training set and applied to the test set. All analyses were performed in R v.3.2.0 using the DAAG, relaimpo, bootstrap, and boot packages.
Disclosure of Potential Conflicts of Interest
No potential conflicts of interest were disclosed.
Acknowledgments
The authors would like to thank Nancy Vanderheyden and Claudio Ottoni for the useful discussions and their suggestions. For providing the teeth samples, authors acknowledge Dr. José María Tejerina Lobo and Dr. Inés Rodríguez Antón from Clínica Tejerina in Gijón, Asturias, Spain and Dr. María José Adserias Garriga from University of Girona, Girona, Cataluña Spain.
Supplemental Material
Supplemental data for this article can be accessed on the publisher's website.
References
- 1.Zapico SC, Ubelaker DH. Applications of physiological bases of ageing to forensic sciences. Estimation of age-at-death. Ageing Res Rev 2013; 12:605-17; PMID:23454111; http://dx.doi.org/ 10.1016/j.arr.2013.02.002 [DOI] [PubMed] [Google Scholar]
- 2.Fraga MF, Esteller M. Epigenetics and aging: the targets and the marks. Trends Genet 2007; 23:413-8; PMID:17559965; http://dx.doi.org/ 10.1016/j.tig.2007.05.008 [DOI] [PubMed] [Google Scholar]
- 3.Florath I, Butterbach K, Muller H, Bewerunge-Hudler M, Brenner H. Cross-sectional and longitudinal changes in DNA methylation with age: an epigenome-wide analysis revealing over 60 novel age-associated CpG sites. Human Mol Genetics 2014; 23:1186-201; PMID:24163245; http://dx.doi.org/ 10.1093/hmg/ddt531 [DOI] [PMC free article] [PubMed] [Google Scholar]
- 4.Johansson A, Enroth S, Gyllensten U. Continuous Aging of the Human DNA Methylome Throughout the Human Lifespan. PLoS One 2013; 8:e67378; PMID:23826282; http://dx.doi.org/ 10.1371/journal.pone.0067378 [DOI] [PMC free article] [PubMed] [Google Scholar]
- 5.Gu T, Gu HF, Hilding A, Sjoholm LK, Ostenson CG, Ekstrom TJ, Brismar K. Increased DNA methylation levels of the insulin-like growth factor binding protein 1 gene are associated with type 2 diabetes in Swedish men. Clin Epigenetics 2013; 5:21; PMID:24246027; http://dx.doi.org/ 10.1186/1868-7083-5-21 [DOI] [PMC free article] [PubMed] [Google Scholar]
- 6.Bennett DA, Yu L, Yang J, Srivastava GP, Aubin C, De Jager PL. Epigenomics of Alzheimer's disease. Transl Res 2015; 165:200-20; PMID:24905038; http://dx.doi.org/ 10.1016/j.trsl.2014.05.006 [DOI] [PMC free article] [PubMed] [Google Scholar]
- 7.Heyn H, Moran S, Esteller M. Aberrant DNA methylation profiles in the premature aging disorders Hutchinson-Gilford Progeria and Werner syndrome. Epigenetics 2013; 8:28-33; PMID:23257959; http://dx.doi.org/ 10.4161/epi.23366 [DOI] [PMC free article] [PubMed] [Google Scholar]
- 8.Yuan T, Jiao Y, de Jong S, Ophoff RA, Beck S, Teschendorff AE. An integrative multi-scale analysis of the dynamic DNA methylation landscape in aging. PLoS Genet 2015; 11:e1004996; PMID:25692570; http://dx.doi.org/ 10.1371/journal.pgen.1004996 [DOI] [PMC free article] [PubMed] [Google Scholar]
- 9.Bocklandt S, Lin W, Sehl ME, Sanchez FJ, Sinsheimer JS, Horvath S, Vilain E. Epigenetic predictor of age. PLoS One 2011; 6:e14821; PMID:21731603; http://dx.doi.org/ 10.1371/journal.pone.0014821 [DOI] [PMC free article] [PubMed] [Google Scholar]
- 10.Alisch RS, Barwick BG, Chopra P, Myrick LK, Satten GA, Conneely KN, Warren ST. Age-associated DNA methylation in pediatric populations. Genome Res 2012; 22:623-32; PMID:22300631; http://dx.doi.org/ 10.1101/gr.125187.111 [DOI] [PMC free article] [PubMed] [Google Scholar]
- 11.Horvath S. DNA methylation age of human tissues and cell types. Genome Biol 2013; 14:R115; PMID:24138928; http://dx.doi.org/ 10.1186/gb-2013-14-10-r115 [DOI] [PMC free article] [PubMed] [Google Scholar]
- 12.Hannum G, Guinney J, Zhao L, Zhang L, Hughes G, Sadda S, Klotzle B, Bibikova M, Fan JB, Gao Y, et al.. Genome-wide methylation profiles reveal quantitative views of human aging rates. Mol Cell 2013; 49:359-67; PMID:23177740; http://dx.doi.org/ 10.1016/j.molcel.2012.10.016 [DOI] [PMC free article] [PubMed] [Google Scholar]
- 13.Zbiec-Piekarska R, Spolnicka M, Kupiec T, Makowska Z, Spas A, Parys-Proszek A, Kucharczyk K, Płoski R, Branicki W. Examination of DNA methylation status of the ELOVL2 marker may be useful for human age prediction in forensic science. Forensic Sci Int Genet 2015; 14:161-7; PMID:25450787; http://dx.doi.org/ 10.1016/j.fsigen.2014.10.002 [DOI] [PubMed] [Google Scholar]
- 14.Weidner CI, Lin Q, Koch CM, Eisele L, Beier F, Ziegler P, Bauerschlag DO, Jöckel KH, Erbel R, Mühleisen TW, et al.. Aging of blood can be tracked by DNA methylation changes at just three CpG sites. Genome Biol 2014; 15:R24; PMID:24490752; http://dx.doi.org/ 10.1186/gb-2014-15-2-r24 [DOI] [PMC free article] [PubMed] [Google Scholar]
- 15.Marttila S, Kananen L, Hayrynen S, Jylhava J, Nevalainen T, Hervonen A, Jylhä M, Nykter M,Hurme M. Ageing-associated changes in the human DNA methylome: genomic locations and effects on gene expression. BMC Genomics 2015; 16:179; PMID:25888029; http://dx.doi.org/ 10.1186/s12864-015-1381-z [DOI] [PMC free article] [PubMed] [Google Scholar]
- 16.Bacalini MG, Boattini A, Gentilini D, Giampieri E, Pirazzini C, Giuliani C, Fontanesi E, Remondini D, Capri M, Del Rio A, et al.. A meta-analysis on age-associated changes in blood DNA methylation: results from an original analysis pipeline for Infinium 450k data. Aging (Albany NY) 2015; 7:97-109; PMID:25701668 [DOI] [PMC free article] [PubMed] [Google Scholar]
- 17.Silva DS, Antunes J, Balamurugan K, Duncan G, Alho CS, McCord B. Evaluation of DNA methylation markers and their potential to predict human aging. Electrophoresis 2015; 36(15):1775-80 In press [DOI] [PubMed] [Google Scholar]
- 18.Zbiec-Piekarska R, Spolnicka M, Kupiec T, Parys-Proszek A, Makowska Z, Paleczka A, Kucharczyk K, Płoski R, Branicki W. Development of a forensically useful age prediction method based on DNA methylation analysis. Forensic Sci Int Genet 2015; 17:173-9; PMID:26026729; http://dx.doi.org/ 10.1016/j.fsigen.2015.05.001 [DOI] [PubMed] [Google Scholar]
- 19.Andrew T, Calloway CD, Stuart S, Lee SH, Gill R, Clement G, Chowienczyk P, Spector TD, Valdes AM. A twin study of mitochondrial DNA polymorphisms shows that heteroplasmy at multiple sites is associated with mtDNA variant 16093 but not with zygosity. PLoS One 2011; 6:e22332; PMID:21857921; http://dx.doi.org/ 10.1371/journal.pone.0022332 [DOI] [PMC free article] [PubMed] [Google Scholar]
- 20.Teschendorff AE, Menon U, Gentry-Maharaj A, Ramus SJ, Weisenberger DJ, Shen H, Campan M, Noushmehr H, Bell CG, Maxwell AP, et al.. Age-dependent DNA methylation of genes that are suppressed in stem cells is a hallmark of cancer. Genome Res 2010; 20:440-6; PMID:20219944; http://dx.doi.org/ 10.1101/gr.103606.109 [DOI] [PMC free article] [PubMed] [Google Scholar]
- 21.Koch CM, Wagner W. Epigenetic-aging-signature to determine age in different tissues. Aging (Albany NY) 2011; 3:1018-27; PMID:22067257 [DOI] [PMC free article] [PubMed] [Google Scholar]
- 22.Bell JT, Tsai PC, Yang TP, Pidsley R, Nisbet J, Glass D, Mangino M, Zhai G, Zhang F, Valdes A, et al.. Epigenome-wide scans identify differentially methylated regions for age and age-related phenotypes in a healthy ageing population. PLoS Genet 2012; 8:e1002629; PMID:22532803; http://dx.doi.org/ 10.1371/journal.pgen.1002629 [DOI] [PMC free article] [PubMed] [Google Scholar]
- 23.Horvath S, Zhang Y, Langfelder P, Kahn RS, Boks MP, van Eijk K, van den Berg LH, Ophoff RA. Aging effects on DNA methylation modules in human brain and blood tissue. Genome Biol 2012; 13:R97; PMID:23034122; http://dx.doi.org/ 10.1186/gb-2012-13-10-r97 [DOI] [PMC free article] [PubMed] [Google Scholar]
- 24.Garagnani P, Bacalini MG, Pirazzini C, Gori D, Giuliani C, Mari D, Di Blasio AM, Gentilini D, Vitale G, Collino S, et al.. Methylation of ELOVL2 gene as a new epigenetic marker of age. Aging Cell 2012; 11:1132-4; PMID:23061750; http://dx.doi.org/ 10.1111/acel.12005 [DOI] [PubMed] [Google Scholar]
- 25.Marttila S, Kananen L, Häyrynen S, Jylhävä J, Nevalainen T, Hervonen A, Jylhä M, Nykter M, Hurme M. Ageing-associated changes in the human DNA methylome: genomic locations and effects on gene expression. BMC Genomics 2015; 16:179; PMID:25888029 [DOI] [PMC free article] [PubMed] [Google Scholar]
- 26.Yan M, Zhang Z, Brady JR, Schilbach S, Fairbrother WJ, Dixit VM. Identification of a novel death domain-containing adaptor molecule for ectodysplasin-A receptor that is mutated in crinkled mice. Curr Biol 2002; 12:409-13; PMID:11882293; http://dx.doi.org/ 10.1016/S0960-9822(02)00687-5 [DOI] [PubMed] [Google Scholar]
- 27.Boks MP, Derks EM, Weisenberger DJ, Strengman E, Janson E, Sommer IE, Kahn RS, Ophoff RA. The relationship of DNA methylation with age, gender and genotype in twins and healthy controls. PLoS One 2009; 4:e6767; PMID:19774229; http://dx.doi.org/ 10.1371/journal.pone.0006767 [DOI] [PMC free article] [PubMed] [Google Scholar]
- 28.Fuke C, Shimabukuro M, Petronis A, Sugimoto J, Oda T, Miura K, Miyazaki T, Ogura C, Okazaki Y, Jinno Y. Age related changes in 5-methylcytosine content in human peripheral leukocytes and placentas: an HPLC-based study. Ann Hum Genet 2004; 68:196-204; PMID:15180700; http://dx.doi.org/ 10.1046/j.1529-8817.2004.00081.x [DOI] [PubMed] [Google Scholar]
- 29.El-Maarri O, Becker T, Junen J, Manzoor SS, Diaz-Lacava A, Schwaab R, Wienker T, Oldenburg J. Gender specific differences in levels of DNA methylation at selected loci from human total blood: a tendency toward higher methylation levels in males. Hum Genet 2007; 122:505-14; PMID:17851693; http://dx.doi.org/ 10.1007/s00439-007-0430-3 [DOI] [PubMed] [Google Scholar]
- 30.Zapico SC, Ubelaker DH. Sex determination from dentin and pulp in a medicolegal context. J Am Dent Assoc 2013; 144:1379-85; PMID:24282268; http://dx.doi.org/ 10.14219/jada.archive.2013.0074 [DOI] [PubMed] [Google Scholar]
Associated Data
This section collects any data citations, data availability statements, or supplementary materials included in this article.